Bloomberg Terminal
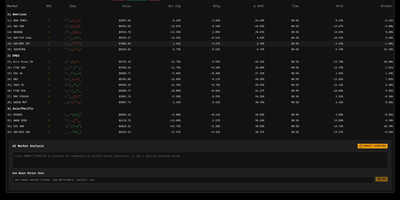
With 1,450+ GitHub stars and a live demo on Vercel, this Bloomberg Terminal clone delivers a professional-grade financial dashboard without the $24,000 annual seat license. The Next.js 15 App Router with React 19 and TypeScript serves a single-page terminal interface optimized for constantly mutating financial data, with partial pre-rendering enabling sub-500ms initial loads even on data-heavy views. Upstash Redis caches AlphaVantage market data to minimize API calls while maintaining sub-second update latency through React Query polling with configurable refresh rates. OpenAI integration provides AI-powered market insights, sentiment analysis, and trend interpretation directly within the terminal interface. Multiple specialized views cover market data tables with bid/ask spreads, financial news aggregation with category filtering, market movers highlighting top gainers and losers, and volatility analysis with historical comparison charts. Jotai atoms manage local state for watchlists, layout preferences, and terminal sessions while React Query handles server-state synchronization with aggressive stale-while-revalidate caching. The shadcn/ui component library with Tailwind CSS delivers accessible, keyboard-navigable interface elements styled after Bloomberg's iconic dark terminal aesthetic. Security features include origin restriction, rate limiting via Redis, and Zod-based input validation on all API routes. Motion (formerly Framer Motion) animates transitions between views and data updates without layout shift. Running on a dedicated VPS on RepoCloud with guaranteed CPU, RAM, and SSD, full root SSH access, and a browser serial console. MIT licensed.
Quant-UX
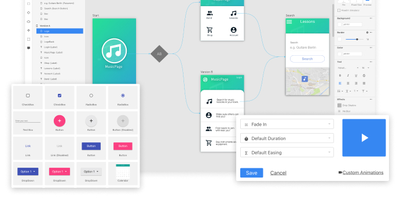
Most design tools stop at prototyping; Quant-UX also measures how real users actually perform with the prototype. The visual editor creates prototypes that behave like real apps - functional input widgets, animations, form validation, data binding across screens, and business logic modeled with REST requests and decision elements. Design systems are first-class, with components, design tokens, and master screens; if you design elsewhere, drop in image files or import from Figma. Testing is a shared link or QR code - no installs on the tester's side. Define user tasks up front, and Quant-UX records every session: click heatmaps show where users found (or missed) actionable elements, user journey graphs expose lost users, drop-off charts reveal where tasks stall, and success rates and task KPIs are extracted automatically into a dashboard. An A/B test operator wires two design variants into one prototype and compares task duration, success rate, and interaction counts. In-prototype surveys collect qualitative feedback alongside the numbers, and an AI assistant generates prototype fragments like styled forms on request. The RepoCloud deployment runs the full stack - frontend, backend, and WebSocket server containers over MongoDB - so all test recordings and research data stay on your infrastructure.
Briefer
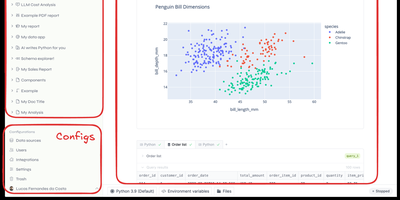
Backed by Y Combinator with 4,300 GitHub stars and growing rapidly since its September 2024 launch, Briefer delivers the first truly unified notebook-and-dashboard platform that eliminates the fragmented workflow of juggling Jupyter for analysis, Tableau for visualization, and Notion for documentation — combining all three in a single Notion-like workspace where SQL query results automatically become Python DataFrames accessible in subsequent code blocks. The built-in AI analyst understands your database schema and notebook context to generate SQL queries, write Python transformations, create visualizations, and fix errors on demand using configurable OpenAI or private LLM backends. Connect directly to PostgreSQL, MySQL, BigQuery, Redshift, Snowflake, and Amazon Athena as data sources, or upload CSV files for immediate analysis. Native point-and-click visualizations produce charts, tables, and dashboards without writing code, while interactive data apps use inputs, dropdowns, and date pickers to create parameterized reports for non-technical stakeholders. Scheduled execution runs notebooks and dashboards periodically with results delivered via Slack integration or public shareable links. Write-back queries modify production data directly from notebooks for ad-hoc pipeline testing. The architecture runs as three Docker containers — web frontend, API server, and optional AI service — backed by PostgreSQL and a Jupyter server for Python execution, deployable via single Docker command, Docker Compose, or Helm charts for Kubernetes. Running on a dedicated VPS on RepoCloud with guaranteed CPU, RAM, and SSD, full root SSH access, and a browser serial console. AGPLv3 licensed.
OpenSearch
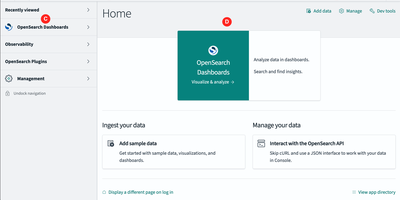
OpenSearch is a search and analytics platforms, powering full-text search, log analytics, observability, and AI-powered vector retrieval at petabyte scale. The distributed engine provides BM25 full-text search alongside k-NN vector search using NMSLIB, Faiss, and Lucene libraries, enabling semantic search, hybrid search combining keyword and vector scoring through normalization processors, neural sparse search, and retrieval-augmented generation workflows with built-in ML Commons for model hosting. OpenSearch Dashboards delivers interactive visualization with Discover for log exploration, custom dashboards, alerting, anomaly detection using Random Cut Forest algorithms, and Security Analytics with detection rules mapped to MITRE ATT&CK. Native Prometheus integration with full PromQL support unifies metrics alongside logs and traces in a single observability interface, while Data Prepper handles telemetry ingestion from OpenTelemetry collectors, Fluent Bit, and Logstash-compatible pipelines. SQL and Piped Processing Language queries with a visual PPL builder enable analysts to query data without learning the native DSL. Index State Management automates index lifecycle with rollover, shrink, and delete policies, while cross-cluster replication and searchable snapshots on S3-compatible storage provide disaster recovery. Scoped API keys, field-level security, document-level security, and audit logging deliver enterprise-grade access control. Docker Compose deploys multi-node clusters alongside the Kubernetes operator for orchestrated production environments. Running on a dedicated VPS on RepoCloud with guaranteed CPU, RAM, and SSD, full root SSH access, and a browser serial console. Apache 2.0 licensed.
Tautulli
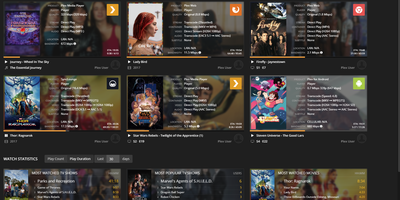
Plex's own dashboard shows current streams and forgets everything else - which is why every Plex server admin eventually installs Tautulli, the analytics layer. This Python web application (descended from PlexWatch and Headphones) logs complete watch history - what was watched, who watched it, when, where, from which device and IP, and whether it played directly or transcoded - and turns it into clean Highcharts graphs of daily plays, concurrent streams, bandwidth, and platform breakdowns. The home page surfaces top statistics over configurable windows: most-watched content, most active users, stream type ratios. For running a server shared with family and friends, this is operational truth: spot the user forcing 4K transcodes on a phone, see which libraries earn their disk space, and track sync activity across users. The notification engine triggers on server events - playback starts, transcode decision changes, recently added media, server down - through dozens of agents (Discord, Telegram, Slack, email, webhooks) with fully customizable text and conditions, plus arbitrary script execution. Scheduled newsletters email your users a styled digest of recently added content. A comprehensive API exposes every statistic for dashboards like Homarr, and an official mobile app monitors activity on the go. Themed to match Plex/Web. GPL-licensed.
Dittofeed
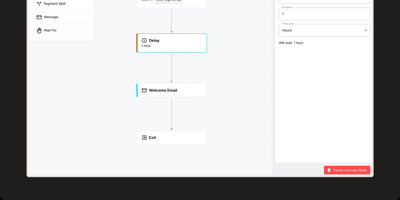
Automate transactional and marketing messages across email, SMS, mobile push, WhatsApp, Slack, and custom webhooks from a single visual journey canvas. Dittofeed provides the capabilities of Customer.io or Braze while keeping customer PII within your own infrastructure and eliminating volume-based pricing entirely. The drag-and-drop journey builder creates multi-trigger automations with branching logic, wait nodes, random cohort splits for A/B testing, and local timezone delivery without writing code. User segments combine trait conditions, event history, and array-based filtering through AND/OR operators with real-time evaluation. Template authoring supports both a low-code visual editor and direct HTML/MJML input, with templates reusable across journeys and one-off broadcasts. Data flows in through Segment integration, Reverse ETL connections, or the REST API with Web, Node.js, and React Native SDKs. Message delivery routes through SendGrid, Amazon SES, Twilio, or SignalWire with per-channel analytics tracking opens, clicks, bounces, and unsubscribes. Authentication supports Keycloak, AWS Cognito, and GCP OAuth for enterprise SSO. Embeddable iframe and headless React components let SaaS platforms white-label journey builders into their own products. Deploy on RepoCloud with a dedicated VPS for full GDPR compliance under the MIT license.
Mixpost
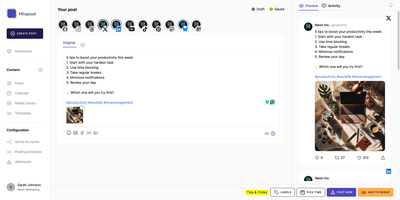
Mixpost puts Facebook, Instagram, X, LinkedIn, YouTube, TikTok, Pinterest, Threads, Bluesky, Mastodon, Pixelfed, and Google Business under a single scheduling dashboard — plan content visually on a drag-and-drop calendar, queue posts for optimal engagement windows, and track audience growth per platform without juggling twelve separate apps or paying per-seat SaaS fees. Built on Laravel with a Vue.js 3 and Inertia.js frontend styled with Tailwind CSS, the Lite edition provides unified content management where each post supports platform-specific customization with individual captions, media attachments, hashtag groups, and first-comment scheduling. Posting queues automate publishing at configurable time slots throughout the day. The media library provides a centralized asset manager with drag-and-drop uploads, stock photo integration via Unsplash, and Tenor GIF search. AI-powered content assistance generates and optimizes post copy. Per-platform analytics dashboards display audience growth, engagement metrics, reach, and impressions with exportable reports. Team workspaces support role-based permissions for collaborative content management across departments. External integrations connect through the REST API, webhooks, n8n, Zapier, and RSS feeds, plus an MCP server for AI assistant publishing. Deploy via Docker Compose with MySQL and Redis. Running on a dedicated VPS on RepoCloud with guaranteed CPU, RAM, and SSD, full root SSH access, and a browser serial console. MIT licensed.
Endurain
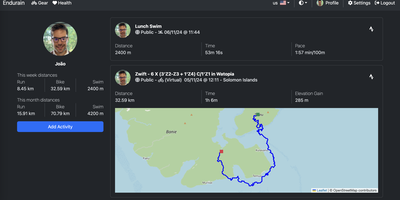
A personal Strava on your own server: Endurain is a self-hosted fitness platform that keeps your complete workout history, GPS routes, and health data out of a vendor's cloud. It ingests the standard device formats (.gpx, .tcx, and preferred .fit with full sensor data) via manual or bulk upload, and syncs directly with Strava and Garmin Connect so migrating years of history is straightforward - Garmin sync covers activities, gear, and body composition. The dashboard shows activity feeds with weekly and monthly statistics, routes on maps, and distance, speed, and training-volume trends over time, with definable goals that update automatically. Gear tracking is notably deep: log wetsuits, bicycles, shoes, racquets, skis, and snowboards, assign default gear per activity type, and track individual components like bike chains against replacement mileage. Multi-user support with admin and user roles, follower features, per-activity privacy settings, and configurable sign-up (email verification, admin approval) make it usable for clubs and coaches as well as individuals. Auth is serious for a fitness app: MFA TOTP, OIDC/SAML SSO, and email-based password resets via Apprise. The stack is Vue.js over a Python FastAPI backend with PostgreSQL, plus weight, steps, and sleep logging, imperial/metric units, multi-language support, and third-party app integration.
Kutt
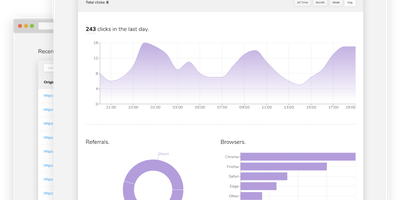
Built for self-hosting from the ground up, Kutt is a modern, MIT-licensed URL shortener: zero-configuration setup, no build step, and SQLite, PostgreSQL, or MySQL with optional Redis caching. Links carry real management features - custom slugs from a configurable alphabet (confusable characters like 0/O and l/1 omitted by default), password protection, descriptions, expiration times, and the ability to edit a destination URL without changing the short link already in circulation. Custom domains make branded short links first-class: add as many as you like and serve each under your own name instead of a third-party's. Private, per-link statistics track clicks, browsers, operating systems, and countries without logging visitor IPs or sensitive data. An admin page manages users and links instance-wide, and two environment flags (DISALLOW_REGISTRATION, DISALLOW_ANONYMOUS_LINKS) lock the instance down for private use; OpenID Connect login integrates with an existing identity provider. Automation runs through a documented REST API - create, list, delete, and pull stats - plus Chrome and Firefox extensions and ShareX compatibility for shortening from anywhere. Built with Node.js and React, deployed in one Docker container, it replaces Bitly with something you own: your domain, your analytics, and links that never die with a vendor.
Marketing Dashboard
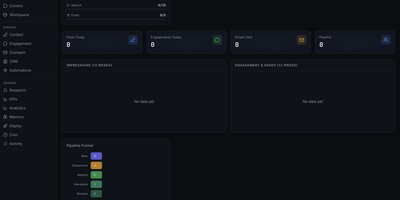
This is a marketing operations control center that replaces fragmented CRM, outreach, content, and analytics tools with a unified self-hosted interface designed for AI agent-assisted go-to-market teams. The CRM module manages leads through a configurable pipeline funnel with stages from New through Sequenced, Replied, Interested, and Booked, tracking source attribution, industry segments, company size, lead quality scores, and LinkedIn URLs per contact. Outreach sequencing supports email campaigns with pause controls, audit endpoints, suppression workflows, and engagement tracking. The content operations surface provides calendar views, content item management, performance metrics, and approval queues for editorial control. Analytics and KPI dashboards show impressions, engagement, and send volumes over configurable time periods, with optional connectors to Plausible, Google Analytics 4, X, and LinkedIn for cross-platform reporting. The OpenClaw-native agent runtime enables dynamic agent and squad discovery, workspace management, session monitoring, and communications surfaces. Automation scheduling uses cron job templates with OpenClaw-compatible schedule variants including cron expressions, every intervals, and at timestamps. The tech stack combines Next.js 16 App Router with React 19, Tailwind CSS 4, Recharts, and Zustand for state management. Authentication supports session cookies, API keys, and optional Google OAuth with role-based access controls. All state persists locally in SQLite via better-sqlite3 with no required external infrastructure. On RepoCloud, deploy Marketing Dashboard on a dedicated VPS with persistent SQLite storage, root SSH access, and complete control over your marketing operations data, all under the MIT license.
Quickwit
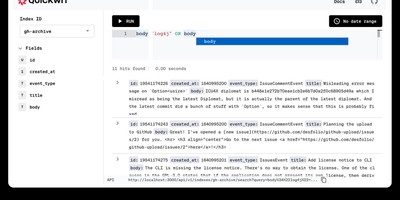
With over 11,000 GitHub stars and now backed by Datadog while remaining fully Apache 2.0 licensed, Quickwit delivers the search performance Elasticsearch users expect at a fraction of the infrastructure cost by moving the index to object storage instead of expensive local SSDs. The Rust-based engine, built on the Tantivy search library with SIMD-accelerated vectorized processing and zero garbage collection overhead, achieves sub-second search latency directly against Amazon S3, Azure Blob Storage, Google Cloud Storage, or any S3-compatible backend like MinIO and Ceph. The Elasticsearch-compatible REST API covers ingest, search, query DSL, and aggregations, enabling existing log shippers including Vector, Fluent Bit, and Syslog to migrate without rewriting configurations. Native OpenTelemetry Protocol endpoints accept logs and traces via gRPC, while Jaeger integration provides a drop-in distributed tracing backend. Ingestion from Apache Kafka, Amazon Kinesis, and Apache Pulsar supports streaming pipelines with multi-index partitioning, and the schemaless JSON indexing mode eliminates the need for upfront schema definitions. Stateless searchers and indexers scale horizontally on Kubernetes or bare metal, with a control plane that distributes indexing tasks and a janitor that manages retention policies and GDPR-compliant deletions. The built-in web UI displays search results and cluster state, while the official Grafana data source enables log exploration dashboards. Running on a dedicated VPS on RepoCloud with guaranteed CPU, RAM, and SSD, full root SSH access, and a browser serial console. Apache 2.0 licensed.
Laminar
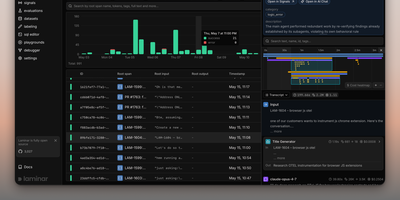
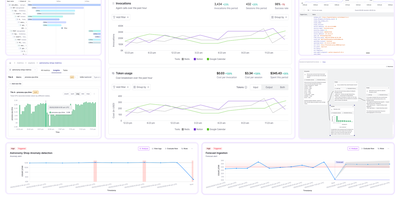
Backed by Y Combinator (S24) and processing traces from thousands of AI agents in production, Laminar is the open-source observability platform that treats agent debugging as a first-class engineering discipline rather than an afterthought. Its OpenTelemetry-native SDK auto-instruments Vercel AI SDK, LangChain, OpenAI, Anthropic, Gemini, Browser Use, Stagehand, Mastra, Pydantic AI, and the OpenAI Agents SDK with a single line of code, capturing every LLM turn, tool call, and sub-agent delegation as nested spans with full input/output data and token costs. The Signals engine lets you describe failures in plain language — "agent is stuck in a loop" or "tool returned empty results" — then reads every trace and alerts via Slack when it detects a match. A built-in debugger records runs and replays them from cache so each iteration takes seconds, designed for Claude Code, Cursor, or Codex to drive the repair loop via the MCP server or CLI. Run code-first evaluations in Python or TypeScript locally or in CI/CD pipelines, build datasets from production traces, and query everything with raw SQL through custom dashboards, the in-app editor, or your coding agent. The Rust backend delivers 20x trace compression, a custom real-time streaming engine, ultra-fast full-text search, and gRPC ingestion, while ClickHouse powers columnar analytics and PostgreSQL stores application state. Running on a dedicated VPS on RepoCloud with guaranteed CPU, RAM, and SSD, full root SSH access, and a browser serial console. Apache 2.0 licensed.
Parseable
Parseable replaces expensive Elasticsearch clusters and fragmented monitoring stacks with a single Rust binary that ingests, queries, and stores logs, metrics, and traces on commodity object storage at a fraction of the cost. The data lake architecture decouples stateless compute from S3-compatible storage, enabling independent scaling of ingestion throughput and query capacity while cutting storage costs by up to 90% compared to indexed alternatives. OpenTelemetry-native OTLP ingestion accepts telemetry from existing OTel collector pipelines, Prometheus Remote Write endpoints, Kafka consumers, eBPF probes, and popular logging agents including Fluentd, Fluent Bit, and Vector without proprietary format conversions. The SQL-first query interface enables cross-signal analysis across all telemetry types, while native PromQL support with 50+ functions and 12 aggregation operators provides Prometheus-compatible metrics querying that works directly with Grafana dashboards. Built-in features include customizable dashboards, real-time alerting with Webhook, Slack, and Alertmanager targets, role-based access control, OpenID single sign-on integration, LogIQ automatic unstructured-to-structured log transformation, smart caching for frequently accessed data, and retention policies for lifecycle management. AI-powered Keystone Q&A provides natural language to SQL conversion and dataset summarization. All data stored as standard Apache Parquet on object storage remains accessible to any Parquet-compatible engine (DuckDB, Spark, Trino), ensuring zero vendor lock-in. Deploys on AWS S3, Azure Blob, Google Cloud Storage, MinIO, Wasabi, and DigitalOcean Spaces. Running on a dedicated VPS on RepoCloud with guaranteed CPU, RAM, and SSD, full root SSH access, and a browser serial console. Apache 2.0 licensed.
Tianji
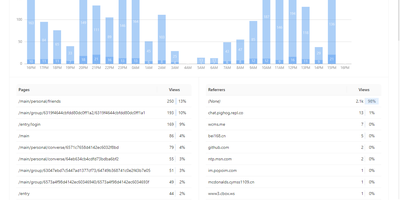
Website analytics, uptime monitoring, and server status - three tools most teams run separately - combined in Tianji, an open-source observability platform. The analytics layer tracks page views, unique visitors, referrers, and UTM parameters with a lightweight cookie-less script, which keeps collection GDPR and CCPA friendly. The uptime monitor checks availability and latency on configurable intervals, accepts passively reported results, and publishes public status pages for incident communication. Server status agents report CPU, memory, disk, and network metrics with threshold-based alerts, and notifications route through webhooks, Slack, Telegram, and other channels with noise control. It also includes anonymous telemetry for tracking deployments of your own open-source projects, surveys, waitlists, team collaboration, and an OpenAPI interface for integrations and exports. The consolidation is the point: traffic analytics, uptime checks, and server metrics share one interface and one alerting layer, so diagnosing an incident does not mean hopping between Google Analytics, Uptime Kuma, and Prometheus - and the built-in public status pages replace a separate paid Statuspage-style subscription. Because collection uses no cookies with IP truncation and aggregation by default, basic traffic measurement requires no consent banner. Built in TypeScript under the Apache 2.0 license and inspired by Umami and Uptime Kuma, it is deliberately right-sized for independent developers and small SaaS teams whose monitoring needs are real but lightweight.
OpenLIT
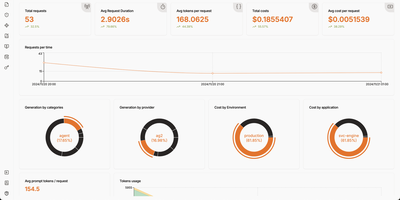
Your AI application is burning through API tokens faster than you can refresh the billing page, and you have no idea which prompt template is responsible. OpenLIT plugs that visibility gap with a self-hosted observability platform built specifically for LLM workloads. Add one line of code to instrument 90+ LLM providers, agent frameworks, and vector databases, then watch every request flow through a tracing dashboard that shows tokens consumed, latency measured, and dollars spent per call, per model, per environment. The requests view lists every LLM interaction with provider, model, cost, and token breakdown in a filterable table, while the trace detail panel lets you drill into individual spans to read the exact prompt sent and response received. Prompt Hub turns prompts into versioned artifacts you deploy, rollback, and A/B test without touching application code. OpenGround compares models side by side on the same input, so you can evaluate cost-versus-quality tradeoffs before committing to a provider. Automated evaluations run LLM-as-a-judge scoring on live production traces, flagging hallucinations, bias, and toxicity in real time. The Vault stores and rotates API keys centrally so secrets stay out of your codebase. Custom dashboards let you build drag-and-drop monitoring views with charts, stat cards, and tables backed by SQL queries against ClickHouse. GPU utilization, memory, temperature, and power metrics feed into the same platform for end-to-end infrastructure visibility. Running on a dedicated VPS on RepoCloud with guaranteed CPU, RAM, and SSD, full root SSH access, and a browser serial console. Apache 2.0 licensed.
QuestDB
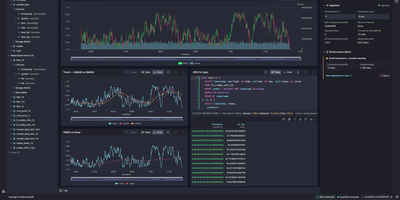
Powering trading floors at firms processing millions of market data events per second and trusted by organizations including Airbus, Yahoo, and Copenhagen Atomics, QuestDB has earned over 17,000 GitHub stars as the time-series database that refuses to make you choose between ingestion speed and query latency. The column-oriented, time-partitioned storage engine processes millions of rows per second on ingest through write-ahead logging with instant durability, while SIMD-accelerated parallel execution returns analytical queries over billions of rows in milliseconds. Time-series SQL extensions add ASOF JOIN for point-in-time lookups across tables with misaligned timestamps, SAMPLE BY for downsampling at arbitrary time intervals, LATEST ON for last-value queries, and WINDOW JOIN for sliding window aggregations — all through standard SQL syntax accessible via the PostgreSQL wire protocol, REST API, or the QuestDB Wire Protocol (QWP) that streams Apache Arrow at 220 million rows per second. Multi-tier storage automatically moves data from the WAL through native columnar format to Parquet files on S3-compatible object storage, keeping hot data fast and cold data portable without manual tiering. The built-in web console provides an interactive SQL editor with syntax highlighting, autocomplete, and charting for quick data exploration. Views, materialized views, and n-dimensional arrays support real-time analytics, while native Parquet export enables direct integration with Python, DuckDB, and AI/ML frameworks. Running on a dedicated VPS on RepoCloud with guaranteed CPU, RAM, and SSD, full root SSH access, and a browser serial console. Apache 2.0 licensed.
Traggo
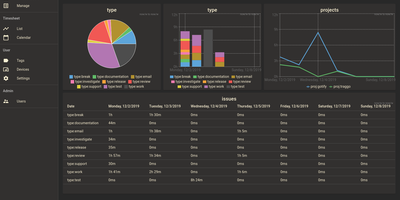
With over 1,600 GitHub stars and a design philosophy that fundamentally rethinks how time tracking should work, Traggo abandons the traditional project-task hierarchy that forces your work into rigid categories and instead lets you tag time spans with arbitrary key-value pairs — project:website, type:coding, client:acme, billable:yes — enabling cross-dimensional analysis that conventional trackers cannot replicate. The Go backend compiles into a single binary that runs alongside a SQLite database and embedded web UI in under 10MB total, consuming approximately 50MB of RAM at runtime and starting in seconds on even the smallest VPS. Tags are the fundamental data model: create any tag key with any set of values, then apply multiple tags to each time span simultaneously to track by project, client, task type, energy level, or any other dimension your workflow demands. Customizable dashboards render pie charts, bar charts, and line graphs from tag-aggregated data, letting you visualize time distribution across any combination of dimensions over configurable date ranges. The calendar view displays time spans as colored blocks across days and weeks, while the list view provides chronological entry browsing with inline editing. Multiple themes including light and dark modes adapt the interface to personal preference, and simple user management with role-based access supports small team deployments. Docker deployment runs a single container exposing port 3030 with multi-architecture support for amd64, arm64, and arm v7. Running on a dedicated VPS on RepoCloud with guaranteed CPU, RAM, and SSD, full root SSH access, and a browser serial console. GPL-3.0 licensed.
Redpanda
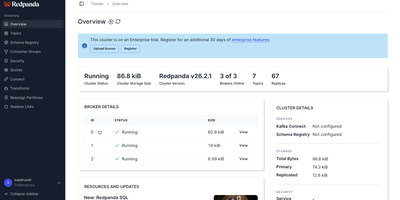
With 12,400 GitHub stars and adoption across enterprises processing billions of events daily, Redpanda delivers a complete Kafka wire protocol implementation in C++ that existing Kafka producers, consumers, Kafka Connect connectors, and Kafka Streams applications connect to without code changes — eliminating JVM garbage collection pauses and ZooKeeper coordination overhead through a single binary architecture built on the Seastar framework's thread-per-core model. The integrated schema registry supports Avro, Protobuf, and JSON Schema validation directly within the broker without separate infrastructure. Tiered storage automatically offloads cold data to object storage while maintaining seamless consumer access across the full retention window. Redpanda Console provides a web-based management interface for topic inspection, consumer group monitoring, schema management, and ACL configuration. Redpanda Connect extends the platform with 200+ pre-built connectors for data pipelines between databases, cloud services, and streaming systems. Exactly-once semantics with idempotent producers and transactional guarantees ensure data integrity for financial, healthcare, and compliance workloads. The Adaptable Data Plane in version 26.1 enables per-topic performance profiles balancing throughput, latency, and durability within a single cluster. Deploy via Docker or Kubernetes with official Helm charts — a three-node cluster starts with a single rpk command. Running on a dedicated VPS on RepoCloud with guaranteed CPU, RAM, and SSD, full root SSH access, and a browser serial console. BSL 1.1 licensed (converts to Apache 2.0 after four years).