Erxes
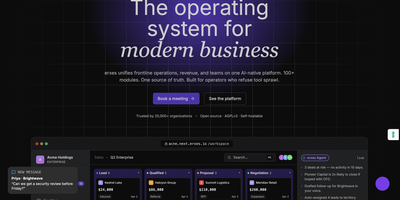
Replacing HubSpot, Zendesk, Intercom, and Linear with a single self-hosted platform, erxes delivers an Experience Operating System trusted by over 4,000 GitHub stars and built on a modern Nx-powered monorepo architecture. The core ships with six foundational modules — My Inbox for omnichannel conversations across email, web chat, voice, and Discord; Contacts for unified customer profiles; Products for catalog management; Segments for behavioral targeting; Automation for visual workflow builders; and Documents for template generation. Beyond the core, a plugin marketplace activates Frontline for ticket management and omnichannel support queues, Sales for deal pipelines and lead scoring, Operations for project boards with cycle management, Content for headless CMS and knowledge bases, and Team for employee directories, time clocks, and internal chat. The technical stack combines GraphQL Federation with Apollo Server v4 and tRPC v11 microservices on Node.js, React 18 micro-frontends via Rspack Module Federation with TailwindCSS 4, MongoDB with Mongoose for persistence, Redis for caching, BullMQ for job queues, and Elasticsearch for full-text search. Deployment supports Docker Compose orchestration with automatic service discovery across all plugin containers. The Global Profile architecture enables agencies to manage multiple client brands under a single login with separated data stores. iOS and Android SDKs embed the messenger widget directly into mobile applications. Running on a dedicated VPS on RepoCloud with guaranteed CPU, RAM, and SSD, full root SSH access, and a browser serial console. AGPLv3 licensed.
Google Maps Scraper
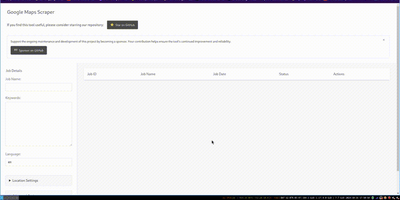
The leading open-source tool for extracting business leads from Google Maps at production scale. The Go-based engine processes approximately 120 places per minute with optimized concurrency, extracting 33+ data points per listing including business name, address, phone number, website URL, rating, review count, latitude and longitude, opening hours, price level, and optionally crawling business websites for email addresses. Three interfaces serve different workflows: the CLI accepts query files for cron jobs and CI/CD pipelines with output to CSV, JSON, PostgreSQL, S3, or LeadsDB; the Web UI provides a browser-based dashboard with real-time job monitoring, a map view of scraped places, and interactive query submission; and the REST API at /api/v1 enables programmatic integration with full Swagger documentation at /api/docs. Built-in proxy rotation supports SOCKS5, HTTP, and HTTPS with authentication for large-scale runs, while the architecture scales from a laptop to Kubernetes clusters with queue-based worker distribution. The SaaS edition adds multi-user access with API key management, admin UI with 2FA, job queue orchestration, and one-command cloud deployment via an interactive wizard. An AI Agent Skill enables coding agents to run scrapes programmatically. Deploy via Docker or build from source requiring Go 1.26.5+. Running on a dedicated VPS on RepoCloud with guaranteed CPU, RAM, and SSD, full root SSH access, and a browser serial console. MIT licensed.
Apache Superset
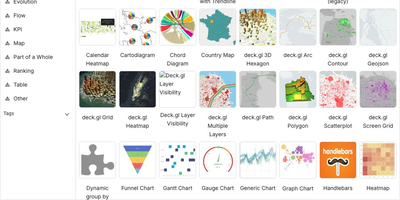
Powering data analytics at companies like Airbnb, Twitter, and Lyft where it originated, Apache Superset has become the leading open-source business intelligence platform with over 65,000 GitHub stars and an Apache Software Foundation top-level project designation. The platform ships with over forty visualization types out of the box including geographic maps, time-series charts, pivot tables, heatmaps, treemaps, and Sankey diagrams, all rendered with Apache ECharts for publication-quality output. Its SQL Lab provides a full-featured IDE experience with syntax highlighting, autocomplete, query history, and result caching for interactive data exploration. Superset connects natively to PostgreSQL, MySQL, ClickHouse, Trino, Presto, BigQuery, Snowflake, Apache Druid, Apache Hive, and dozens more databases through SQLAlchemy connectors, with support for custom database drivers via Python plugins. The semantic layer allows data teams to define calculated columns, metrics, and virtual datasets that business users can query without writing SQL. Role-based access control with row-level security enables fine-grained data governance, while the embedded analytics SDK lets you integrate dashboards directly into external applications via iframes with SSO pass-through. The caching layer supports Redis and Memcached for query result caching, and the asynchronous query execution engine powered by Celery handles long-running queries without blocking the UI. Alerts and reports can be scheduled via email or Slack with PNG or CSV attachments generated from any chart or dashboard. Running on a dedicated VPS on RepoCloud with guaranteed CPU, RAM, and SSD, full root SSH access, and a browser serial console. Apache 2.0 licensed.
Redash
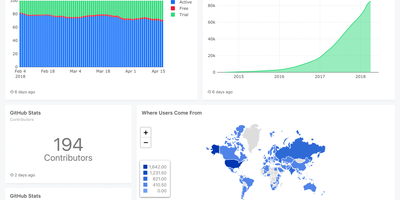
Used by millions of users at thousands of organizations worldwide and holding 29,000+ GitHub stars, Redash is the most established open-source SQL-first business intelligence tool — enabling anyone from analysts to executives to query databases, visualize results, and share dashboards without writing a single line of application code. The browser-based query editor supports SQL and NoSQL with schema browsing, auto-complete, query snippets, and parameterized queries that turn static reports into interactive data applications. Native connectors span 35+ data sources including PostgreSQL, MySQL, Amazon Redshift, Google BigQuery, Snowflake, ClickHouse, MongoDB, Elasticsearch, Databricks, Apache Presto, Microsoft SQL Server, and REST APIs — with an extensible data source API for custom integrations. Visualization types cover line, bar, area, pie, scatter, box plot, funnel, cohort, sankey, sunburst, choropleth map, and pivot tables, all draggable onto shared dashboards with cross-filtering parameters. Scheduled refreshes automatically update query results at configurable intervals, while threshold-based alerts notify teams via email, Slack, or webhook when metrics cross defined boundaries. SAML and Google OAuth SSO integration, role-based access control, API key management, and query-level permissions ensure enterprise-grade security for sensitive datasets. The self-hosted stack deploys via Docker Compose with PostgreSQL for metadata storage, Redis for job queuing, and Celery workers for background task execution. Running on a dedicated VPS on RepoCloud with guaranteed CPU, RAM, and SSD, full root SSH access, and a browser serial console. BSD 2-Clause licensed.
Cube
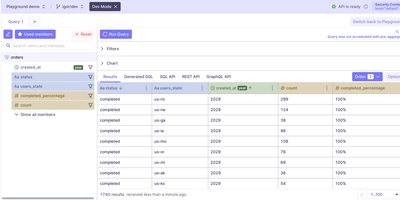
BI tools, customer-facing apps, and AI agents all receive the same governed answer from Cube Core, an open-source semantic layer where every metric is defined once, in code. Models are written in YAML or JavaScript. Cubes describe business entities with measures, dimensions, and joins. Views curate datasets for consumers. Git holds every version, with code review and CI like any other codebase. Queries arrive through a Postgres-compatible SQL API with a MEASURE function, through REST returning JSON, or through GraphQL, which means any tool that speaks Postgres connects without custom drivers. Sources include Snowflake, BigQuery, Databricks, Amazon Athena, Presto, and Postgres. Pre-aggregations declared in the model refresh in the background and live in Cube Store. An aggregate-aware planner routes matching queries to those rollups, and dashboards answer in milliseconds without rescanning the warehouse. Access policies set member-level visibility, row-level filters, and data masking from the security context. Multi-tenant SaaS analytics becomes practical: each customer sees only their own rows, whichever API asks. A development-mode Playground, meant for local use and never for public exposure, composes queries from measures and dimensions, shows the generated SQL, charts the results, and copies ready-made SQL, REST, and GraphQL calls. Running on a dedicated VPS on RepoCloud with guaranteed CPU, RAM, and SSD, full root SSH access, and a browser serial console. Apache 2.0 licensed.
Apache Zeppelin
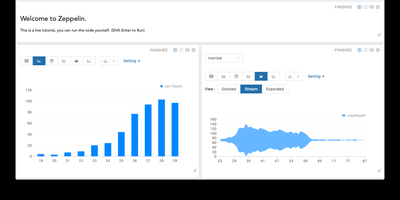
Analysts explore data where it lives with Apache Zeppelin, a web notebook where each paragraph can speak a different language: run Spark in Scala, query through SQL, prototype in Python, and plot the results without leaving the page. Pluggable interpreters connect notebooks to Spark, Flink, JDBC databases, Neo4j, Elasticsearch, and dozens of other engines, all sharing variables through the ZeppelinContext so a DataFrame built in one paragraph feeds the next in another language. Built-in visualizations turn query output into bar, pie, line, and scatter charts with pivot controls, while dynamic forms add dropdowns and inputs that make notebooks reusable reports for colleagues. Multiple Spark and Scala versions coexist in one instance, with interpreter binding modes from globally shared to isolated per note, and execution on local, standalone, YARN, or Kubernetes clusters. Teams collaborate through multi-user support with authentication and note permissions, schedule notebooks as jobs, and drive everything through a REST API. The 0.12.1 maintenance release hardens JWT validation and path traversal defenses, upgrades the Angular frontend, and stabilizes the Spark, Flink, Python, Neo4j, and File interpreters. Running on a dedicated VPS on RepoCloud with guaranteed CPU, RAM, and SSD, full root SSH access, and a browser serial console. Apache-2.0 licensed.
DB-GPT
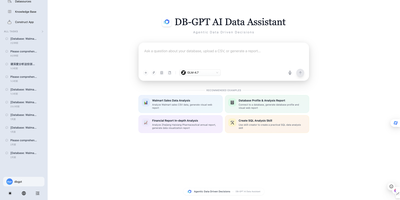
DB-GPT lets a team talk to its data: ask a business question in plain English, and an AI agent plans the work, writes the SQL, runs it, and hands back charts and a written report. Connect MySQL, PostgreSQL, SQL Server, ClickHouse, DuckDB, Doris, StarRocks, or MaxCompute, or drop in CSV and Excel files, including several at once. Every step appears in a live task view with its query, result table, code, and console output, and the agent pauses to ask clarifying questions, with answer options, when the data cannot settle the matter. Reusable skills package proven procedures, including CSV analysis, SQL analysis, and financial report analysis, and a skill creator helps write new ones. Code executes in a sandbox, parallel sub-agents split larger jobs, and an agentic knowledge-base search answers questions over uploaded documents. Scheduled tasks run saved conversations on a cron timetable with on/off switches and execution history, while MCP connectors link tools like Notion, Linear, Tavily, and GitHub. Pick OpenAI, DeepSeek, Qwen, SiliconFlow, Ollama, or vLLM for the model, then use the application and AWEL workflow tools to build data apps of your own. Running on a dedicated VPS on RepoCloud with guaranteed CPU, RAM, and SSD, full root SSH access, and a browser serial console. MIT licensed.
Obsei
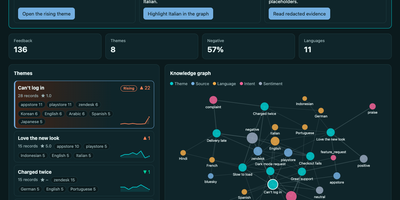
Before any AI model reads a single customer message, Obsei has already stripped out the names, email addresses, card numbers, and ID numbers hiding inside it. Obsei pulls in what customers are saying from App Store and Google Play reviews, Zendesk, Freshdesk, and Intercom tickets, GitHub issues, surveys, YouTube comments, Bluesky, RSS feeds, SQL databases, and even Gong call transcripts. Every record is pseudonymised on the way in and stored in an encrypted database that never phones home. Then the labelling starts: sentiment, intent, language, and your own custom questions, each answered with a confidence score by a zero-shot classifier running locally on your machine, or by an LLM you choose through your own keys. Answers the model is unsure about are escalated to a stronger model or queued for a human instead of being silently wrong. Related complaints roll up into stable themes with week-by-week trends, and anything mentioned by fewer than five people stays hidden, so individuals cannot be picked out of a chart. When a theme spikes, alerts and digests land in Slack, and individual findings can be routed straight into Jira, Linear, or GitHub issues. Your analysts browse it all in the built-in Studio, and your AI agents can ask questions over MCP and get cited, redacted evidence back, with any action they propose waiting for your approval. Running on a dedicated VPS on RepoCloud with guaranteed CPU, RAM, and SSD, full root SSH access, and a browser serial console. Apache-2.0 licensed.
CubeJS
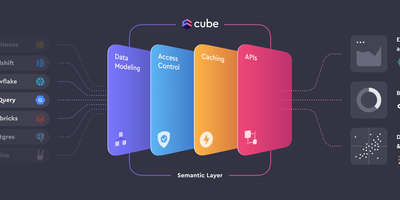
Between your databases and everything that consumes data - BI tools, embedded analytics, AI agents - sits Cube (formerly Cube.js), an open-source semantic layer. Metrics, dimensions, joins, and access rules are defined once as code in YAML, JavaScript, or Python, forming a governed data model that every downstream consumer shares, so "revenue" means the same thing in every dashboard. Caching is two-level: an in-memory cache absorbs bursts of identical queries, and declared pre-aggregations - rollup tables built in the warehouse or in Cube Store, Cube's distributed columnar engine, and refreshed in the background - deliver sub-second latency while cutting warehouse compute costs. The query planner routes each request to cache, rollup, or source automatically. Consumers connect through a Postgres-compatible SQL API (any tool that speaks Postgres works), plus REST, GraphQL, and a Meta API for model introspection. Row-level security and multi-tenancy are enforced in the layer itself, upstream of every client. Sources include Snowflake, BigQuery, Databricks, Postgres, MySQL, Presto, and Athena. Headless by design - bring your own UI.
LightDash
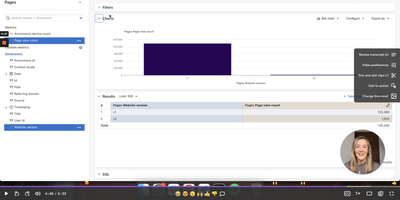
With 5,600+ GitHub stars and deep dbt integration, Lightdash is the open-source Agentic BI platform that treats analytics like software — defining metrics, dimensions, joins, permissions, and caching in a governed context layer that powers dashboards, AI agents, data apps, embedded analytics, and MCP server endpoints simultaneously. The dbt Write-Back feature lets business users create custom metrics and models in the UI, then automatically generates pull requests in GitHub or GitLab so every change flows through code review and CI validation before reaching production. Context-specific AI analysts automatically select relevant models and metrics, build queries, and present insights in plain English, while row-level security, user attributes, and customer-facing permissions ensure data governance at every layer. The platform connects to BigQuery, Snowflake, Redshift, Databricks, PostgreSQL, Trino, and ClickHouse through warehouse adapters, with the TypeScript monorepo built on React, Mantine, Vite, and TanStack Query on the frontend plus Node.js, Express, Knex, and PostgreSQL on the backend. Data teams build analytics with coding agents, preview changes from the CLI, validate in CI pipelines, and review charts and dashboards in pull requests — making the entire analytics lifecycle version-controlled and reproducible. Running on a dedicated VPS on RepoCloud with guaranteed CPU, RAM, and SSD, full root SSH access, and a browser serial console. MIT licensed.
Matomo
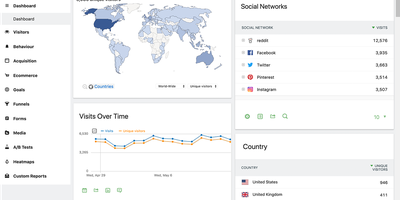
Several EU data protection authorities have ruled Google Analytics deployments unlawful; Matomo (formerly Piwik) is the most complete open-source replacement - a full analytics platform with 30+ report types across visitors, actions, referrers, goals, and ecommerce. The self-hosted PHP/MySQL edition is free and keeps every byte of visitor data on your infrastructure, which matters more each year: several EU data protection authorities have ruled Google Analytics deployments unlawful, while Matomo configured for cookieless tracking is approved by France's CNIL for use without a consent banner. All reporting runs on 100% unsampled data - no extrapolation at high traffic volumes. The GDPR Manager handles data subject requests and deletion, with IP anonymization, retention controls, and Do Not Track support built in. A dedicated importer pulls your historical Google Analytics data so years of trends survive the migration. Core analytics cover campaigns, custom variables and dimensions, entry/exit pages, downloads, site search, and full ecommerce tracking with a comprehensive HTTP API for reporting and ingestion. Premium plugins extend the platform into Hotjar-class behavioral tooling - click and scroll heatmaps, session recordings, conversion funnels, form analytics, A/B testing - plus a tag manager and SAML SSO. For teams that need GA-equivalent depth with actual data ownership, Matomo is the realistic drop-in replacement.
DAC
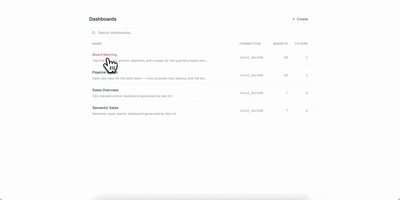
Your dashboards deserve version control, code review, and reproducible builds, just like the rest of your stack. DAC lets you define interactive data dashboards in YAML or TSX, validate them in CI, and serve them from a single Go binary that embeds a full React frontend. Choose from 21 chart types including line, bar, area, pie, scatter, bubble, funnel, sankey, heatmap, calendar, sparkline, waterfall, gauge, treemap, radar, and candlestick, plus metric cards, data tables, text blocks, and image widgets. The built-in semantic layer lets you define metrics and dimensions once in reusable model files, then reference them from any widget while DAC generates the SQL automatically. Connect to Postgres, MySQL, Snowflake, BigQuery, Redshift, Databricks, and DuckDB through standard Bruin connection configs. Interactive filters with date pickers, dropdowns, multiselects, and search inputs inject values via Jinja templating and re-execute only affected widgets. Live reload via Server-Sent Events refreshes connected browsers instantly when you save a file. Export dashboards as self-contained static HTML with baked-in query results for S3, GitHub Pages, or offline sharing, and render slide decks via the Google Slides export command. On RepoCloud, deploy DAC on a dedicated VPS with root SSH access and persistent storage for your dashboard definitions and database connections under the AGPL-3.0 license.
Duckle
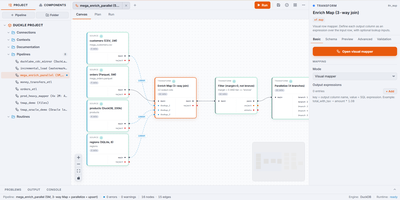
Duckle compiles visual data integration pipelines into vectorized analytical SQL executed on an embedded columnar engine, eliminating the overhead and cloud egress costs of traditional ETL infrastructure. Engineers can construct data pipelines on a drag-and-drop canvas, connecting hundreds of data sources spanning relational databases, cloud object storage, streaming event buses, vector databases, and SaaS application programming interfaces. An interactive mapping editor enables complex joins between primary data inputs and lookup streams with typed transform expressions and live sample inspections. Built-in transformation blocks execute change data capture, slowly changing dimensions, aggregation rollups, and integrated dbt models with zero row-based metering or cloud egress fees. Teams schedule headless production executions through a dedicated web console equipped with role-based access management, execution audit trails, and automated failure alerts dispatched to webhook endpoints. Embedded Model Context Protocol capabilities allow AI coding assistants to validate schema configurations, inspect execution logs, and trigger batch workflows directly through conversational commands. Workspaces store entire pipeline definitions as individual files in version control, ensuring reproducible deployments across staging and production environments. Running on a dedicated VPS on RepoCloud with guaranteed CPU, RAM, and SSD, full root SSH access, and a browser serial console. Apache-2.0 licensed.
GEOInflow
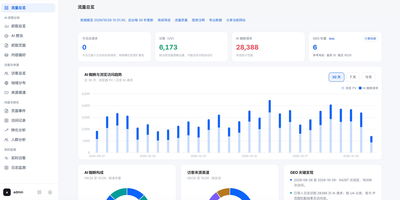
GEOInflow is a self-hosted analytics platform that shows website owners which AI crawlers visit their pages, what those crawlers read, and how much traffic and revenue AI search actually sends back. Import a sitemap, CSV, or JSON inventory and the coverage report compares it against observed crawl logs, flagging important pages that no AI crawler has ever requested and directories where coverage keeps dropping. The built-in catalog recognizes 61 AI crawler identities, including crawlers from OpenAI, Anthropic, Perplexity, Google, Microsoft, ByteDance, Baidu, Kimi, and Tencent Hunyuan, and separates training, AI search, and user-triggered visits. Verification combines declared user agents with official IP ranges and DNS evidence, so a spoofed crawler name never counts as a confirmed visit. Browser tracking connects AI search referrals to landing pages, custom events, goals, funnels, and conversions, letting teams measure whether visibility in AI answers turns into signups and sales. Alongside the GEO reports, teams get pageviews, unique visitors, referrers, geography, devices, heatmaps, retention, and visitor paths, with CSV, JSON, and ZIP exports for any selected scope. Workspaces, team permissions, and public sharing links let agencies and publishers give each client or department its own dashboards without exposing raw data or other sites. Running on a dedicated VPS on RepoCloud with guaranteed CPU, RAM, and SSD, full root SSH access, and a browser serial console. MIT licensed.
Frappe Insights
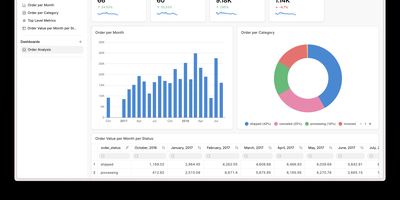
Frappe Insights delivers a self-hosted business intelligence platform where non-technical users build complex analytical queries without writing SQL. The visual query builder uses Ibis under the hood to compose optimized SQL from drag-and-drop column selections, filters, aggregations, and group-by operations — translating point-and-click interactions into performant database queries across MySQL, PostgreSQL, DuckDB, and BigQuery. The join editor provides a graphical interface for defining multi-table relationships, letting analysts connect data across schemas without understanding foreign keys or join types. The chart builder renders interactive visualizations using Apache eCharts with support for bar, line, area, pie, scatter, funnel, and pivot table chart types — each configurable with axes, colors, legends, and formatting options. Dashboards combine multiple charts into shareable views with layout customization, auto-refresh intervals, and filter propagation across widgets. Data source management handles connection pooling across multiple databases simultaneously, enabling cross-database analysis in single queries. Server scripts extend query capabilities with custom Python transformations for complex business logic that visual tools cannot express. Built on the Frappe Framework's full-stack architecture, deployment uses Docker via the official easy-install script that provisions the complete stack including MariaDB, Redis, and Nginx. Running on a dedicated VPS on RepoCloud with guaranteed CPU, RAM, and SSD, full root SSH access, and a browser serial console. AGPL-3.0 licensed.
Briefer
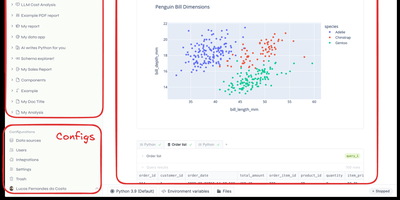
Backed by Y Combinator with 4,300 GitHub stars and growing rapidly since its September 2024 launch, Briefer delivers the first truly unified notebook-and-dashboard platform that eliminates the fragmented workflow of juggling Jupyter for analysis, Tableau for visualization, and Notion for documentation — combining all three in a single Notion-like workspace where SQL query results automatically become Python DataFrames accessible in subsequent code blocks. The built-in AI analyst understands your database schema and notebook context to generate SQL queries, write Python transformations, create visualizations, and fix errors on demand using configurable OpenAI or private LLM backends. Connect directly to PostgreSQL, MySQL, BigQuery, Redshift, Snowflake, and Amazon Athena as data sources, or upload CSV files for immediate analysis. Native point-and-click visualizations produce charts, tables, and dashboards without writing code, while interactive data apps use inputs, dropdowns, and date pickers to create parameterized reports for non-technical stakeholders. Scheduled execution runs notebooks and dashboards periodically with results delivered via Slack integration or public shareable links. Write-back queries modify production data directly from notebooks for ad-hoc pipeline testing. The architecture runs as three Docker containers — web frontend, API server, and optional AI service — backed by PostgreSQL and a Jupyter server for Python execution, deployable via single Docker command, Docker Compose, or Helm charts for Kubernetes. Running on a dedicated VPS on RepoCloud with guaranteed CPU, RAM, and SSD, full root SSH access, and a browser serial console. AGPLv3 licensed.
Chartbrew
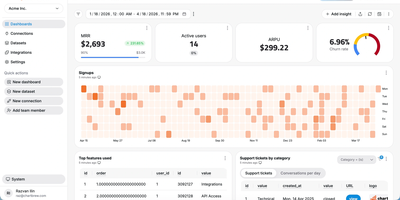
Chartbrew transforms raw database queries and API responses into polished, shareable dashboards without requiring a data engineering team. Connect to MySQL, PostgreSQL, MongoDB, Firestore, or any REST API, then build datasets using the visual query editor with syntax highlighting and auto-completion. Charts render through Chart.js with line, bar, pie, donut, radar, polar, KPI card, and table visualizations, each customizable with colors, legends, filters, and goal indicators. An AI assistant accelerates dashboard creation by generating queries and suggesting chart configurations from natural language descriptions of the metrics you want to track. Reusable datasets let teams prepare data transformations once and share them across multiple charts, while automatic scheduling through BullMQ and Redis refreshes data at intervals from every 10 minutes to monthly. The embed feature generates standalone chart URLs for insertion into external websites, internal tools, or customer portals, and the Reporting API enables programmatic dashboard management and automated report delivery. Team workspaces with role-based permissions control who can view, edit, or manage data connections. Nearly 4,000 GitHub stars reflect steady community adoption. The platform runs on Node.js with Express and Sequelize ORM, supporting MySQL or PostgreSQL as its application database. Running on a dedicated VPS on RepoCloud with guaranteed CPU, RAM, and SSD, full root SSH access, and a browser serial console. FSL-1.1-MIT licensed (converts to MIT two years after each release).
Metabase
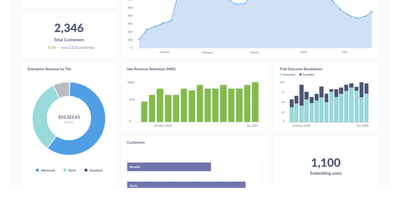
The most widely deployed open-source BI tool, Metabase is a visualization and query layer that sits on top of your existing databases without ingesting or copying data. Non-technical users ask questions through a visual query builder with drill-through menus that answer follow-ups like "broken down by month" without writing a new query, while analysts use the native SQL editor with variables and templates for complex work. Questions assemble into interactive dashboards with filters, auto-refresh, fullscreen mode, and custom click behavior, and dashboard subscriptions email or Slack scheduled reports to stakeholders. It connects to 20+ data sources including PostgreSQL, MySQL, MongoDB, SQL Server, BigQuery, Snowflake, Redshift, and ClickHouse - always querying in place, so there is no second data store to secure, sync, or pay for, and results are always current. Models and metrics let a data team define official, reusable starting points so self-service stays consistent, collections with permissions organize content, and alerts fire when a metric crosses a threshold. The practical effect is cutting the ad-hoc query queue that lands on the data team, since non-technical staff can answer their own questions. Written in Clojure, licensed AGPL, and shipped as a single JAR or Docker image with an embedded application database - a working BI instance runs before most tools finish their installer - the open-source edition has no limits on users, dashboards, or connected databases, where commercial BI platforms price per viewer as well as per creator.