CyberChef
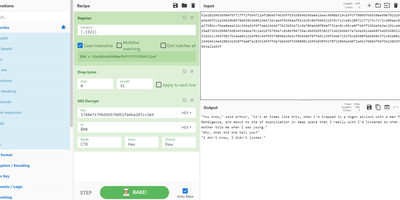
GCHQ open-sourced its "Cyber Swiss Army Knife", and CyberChef became the web app security analysts, incident responders, and CTF players reach for when data needs decoding, decrypting, or dissecting. Its interface is four panes: paste or drag input (files up to 2GB), search a categorized library of hundreds of operations, drag them into a recipe with arguments, and read the output. Operations span Base64, hex, and XOR encoding; AES, DES, and Blowfish encryption; classical ciphers from Caesar to Railfence; hashes and checksums; compression; regex and string extraction of IPs, domains, and URLs; timestamp conversion; and parsers for IPv6, X.509 certificates, and more. Recipes chain arbitrarily - convert from a hexdump then decompress, decrypt AES pulling the IV from the cipher stream, or let the Magic operation auto-detect several layers of nested encoding. Auto Bake re-runs the recipe live as input or arguments change, Step executes one operation at a time for debugging, and flow control (forks, subsections, registers) applies different operations to different parts of the data. Recipes save to files or share as URLs encoding the full pipeline. Crucially, CyberChef is entirely client-side JavaScript - nothing uploads anywhere - and self-hosting guarantees an unmodified copy inside your own network, where malware artifacts belong.
SQL Chat
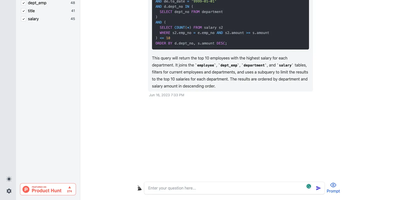
Describe what you want in plain language and get real SQL against your real schema: SQL Chat is an open-source, chat-based SQL client from the Bytebase team. Instead of writing queries in a traditional editor, you connect a database and describe what you want in plain language; the AI reads your schema automatically, generates SQL that references real table and column names, executes it, and returns tabular results in the conversation. Follow-up messages refine the query, so exploration becomes a dialogue - narrow a result set, add a join, change an aggregation - without retyping statements. It supports MySQL, PostgreSQL, SQL Server, TiDB Cloud, and OceanBase from one interface, and covers modification as well as reads: insert, update, and delete operations phrased conversationally. Built with Next.js and TypeScript, it deploys as a single stateless Docker container in single-user mode - connection profiles live in the browser, so there is nothing server-side to maintain. A custom AI endpoint setting routes inference through any OpenAI-compatible API, including self-hosted models, and an optional database-backed mode adds accounts and quotas for offering the tool to a team. MIT-licensed.
DB-GPT
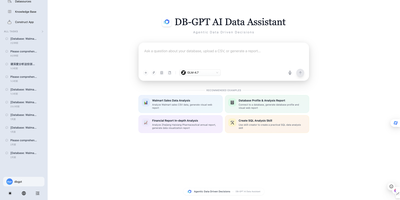
DB-GPT lets a team talk to its data: ask a business question in plain English, and an AI agent plans the work, writes the SQL, runs it, and hands back charts and a written report. Connect MySQL, PostgreSQL, SQL Server, ClickHouse, DuckDB, Doris, StarRocks, or MaxCompute, or drop in CSV and Excel files, including several at once. Every step appears in a live task view with its query, result table, code, and console output, and the agent pauses to ask clarifying questions, with answer options, when the data cannot settle the matter. Reusable skills package proven procedures, including CSV analysis, SQL analysis, and financial report analysis, and a skill creator helps write new ones. Code executes in a sandbox, parallel sub-agents split larger jobs, and an agentic knowledge-base search answers questions over uploaded documents. Scheduled tasks run saved conversations on a cron timetable with on/off switches and execution history, while MCP connectors link tools like Notion, Linear, Tavily, and GitHub. Pick OpenAI, DeepSeek, Qwen, SiliconFlow, Ollama, or vLLM for the model, then use the application and AWEL workflow tools to build data apps of your own. Running on a dedicated VPS on RepoCloud with guaranteed CPU, RAM, and SSD, full root SSH access, and a browser serial console. MIT licensed.
RStudio Server
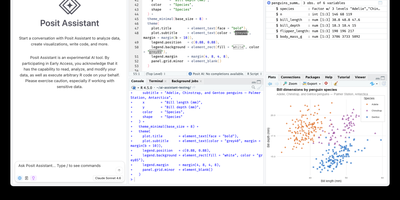
Open a browser tab, sign in, and the whole RStudio workbench is waiting there, running against R on a Linux server instead of your laptop. The familiar four-pane layout holds a source editor, an R console, Environment and History tabs, and Files, Plots, Packages, Help, and Viewer tabs. The editor opens R scripts, R Markdown, Quarto, and Python files, with code completion, diagnostics, section outlines, and a visual mode for Quarto documents. A Terminal tab and a Python console sit beside the R console, and the Data Viewer sorts, filters, and searches data frames and nested lists. Editor breakpoints and tracebacks help debug functions, while Background Jobs run long scripts in separate R sessions so the IDE stays usable. Shiny apps and Plumber APIs run as background jobs with live reload, and a Git pane handles diffs, commits, pushes, and branches. The Connections tab browses databases, and finished reports go to Posit Connect, shinyapps.io, Quarto Pub, or RPubs. Optional Posit Assistant adds an AI chat pane that works with the model provider you choose, and administrators can switch it off. Because everything runs server-side, a class, a lab, or a team can share one large-memory machine and keep computation next to the data without installing anything locally. Running on a dedicated VPS on RepoCloud with guaranteed CPU, RAM, and SSD, full root SSH access, and a browser serial console. AGPL-3.0 licensed.
D-Tale
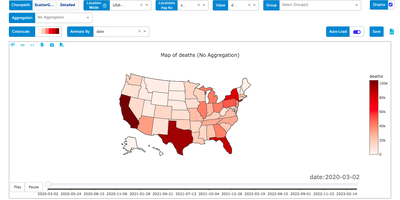
If your data lives in a pandas DataFrame, D-Tale gives it a spreadsheet-style grid, a column profiler, and a chart builder in the browser, started with one call from a notebook or script. In the grid you sort, filter, and edit cells inline, lock, hide, reorder, rename, or reformat columns from their menus, and open a Describe view with each column's distribution, summary statistics, outliers, and missing values, while highlight modes color dtypes, outliers, and numeric ranges across the whole table. Correlation matrices, a predictive power score, and duplicate reports sit beside dataframe functions that add numeric, binned, date, random, and type-converted columns, and Merge & Stack combines dataframes, including ones uploaded from Excel files. The chart builder draws line, bar, stacked, pie, wordcloud, heatmap, 3D scatter, surface, and map charts with grouping and aggregation, exports them as standalone HTML, and a network viewer graphs relationships between nodes. Whatever you build in the interface can be exported as reproducible Python code, and data can be saved as CSV or TSV. Launch it from Jupyter, Google Colab, Kaggle, a terminal, or the command line with a CSV path, protect it with optional authentication, and choose light or dark themes and English or Chinese. Running on a dedicated VPS on RepoCloud with guaranteed CPU, RAM, and SSD, full root SSH access, and a browser serial console. LGPL-2.1 licensed.