Briefer
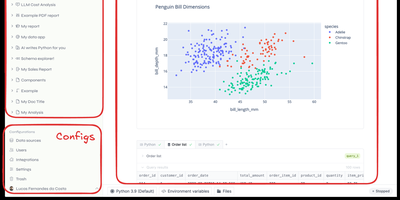
Backed by Y Combinator with 4,300 GitHub stars and growing rapidly since its September 2024 launch, Briefer delivers the first truly unified notebook-and-dashboard platform that eliminates the fragmented workflow of juggling Jupyter for analysis, Tableau for visualization, and Notion for documentation — combining all three in a single Notion-like workspace where SQL query results automatically become Python DataFrames accessible in subsequent code blocks. The built-in AI analyst understands your database schema and notebook context to generate SQL queries, write Python transformations, create visualizations, and fix errors on demand using configurable OpenAI or private LLM backends. Connect directly to PostgreSQL, MySQL, BigQuery, Redshift, Snowflake, and Amazon Athena as data sources, or upload CSV files for immediate analysis. Native point-and-click visualizations produce charts, tables, and dashboards without writing code, while interactive data apps use inputs, dropdowns, and date pickers to create parameterized reports for non-technical stakeholders. Scheduled execution runs notebooks and dashboards periodically with results delivered via Slack integration or public shareable links. Write-back queries modify production data directly from notebooks for ad-hoc pipeline testing. The architecture runs as three Docker containers — web frontend, API server, and optional AI service — backed by PostgreSQL and a Jupyter server for Python execution, deployable via single Docker command, Docker Compose, or Helm charts for Kubernetes. Running on a dedicated VPS on RepoCloud with guaranteed CPU, RAM, and SSD, full root SSH access, and a browser serial console. AGPLv3 licensed.
Tick Stock Panel
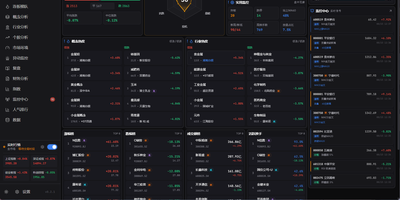
Screen equities against dozens of technical indicators, backtest algorithmic trading strategies, and spot intraday market anomalies using Tick Stock Panel, a self-hosted quantitative analysis workbench. Traders can filter entire exchanges across technical indicators including moving averages, relative strength index, and Bollinger bands with near-instantaneous execution. The platform provides a full backtesting environment where users test customized entry and exit rules, account for simulated slippage and commission fees, and review streamed performance metrics. Dedicated monitoring modules track intraday volume spikes, price breakouts, and multi-day limit streaks with automated alert dispatching to messaging channels and voice announcements. Users can explore individual stock profiles featuring multi-dimensional technical breakdowns, financial balance sheets, and automated event post-mortems generated via integrated language models. Visual factor mining tools allow analysts to discover uncorrelated signals and assemble composite portfolio screens without external database overhead. An interactive dashboard aggregates sector rotations, hot concept heatmaps, and customizable watchlists into modular operational views. Running on a dedicated VPS on RepoCloud with guaranteed CPU, RAM, and SSD, full root SSH access, and a browser serial console. MIT licensed.