Tugtainer
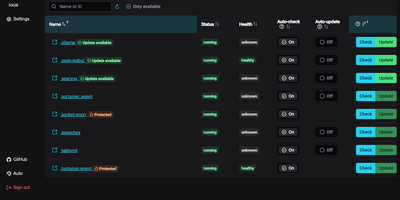
Tugtainer delivers a visual command center for Docker environments that automates container image updates, monitors registry releases, and manages application lifecycles across multiple servers without command-line intervention. System administrators can inspect running containers across all connected hosts, trigger immediate image pulls, and configure automated cron schedules for recurring health and registry checks. Flexible update policies allow teams to flag production databases as notification-only while automatically updating stateless web applications whenever new image tags publish. When updating linked services, the platform analyzes Docker Compose project definitions and custom dependency labels to stop and restart containers in strict dependency order, preventing broken network links and orphaned volume mounts. Administrators can authenticate private container registries, browse image layers and tags, and view real-time container log streams directly within the browser console. Automated pruning jobs continuously reclaim server disk space by deleting obsolete, untagged images and dangling build layers after successful deployments. Multi-channel alerting integrates with over fifty notification providers, delivering real-time update summaries and error warnings directly to Discord, Telegram, Slack, and email webhooks. Running on a dedicated VPS on RepoCloud with guaranteed CPU, RAM, and SSD, full root SSH access, and a browser serial console. MIT licensed.
Cupdate
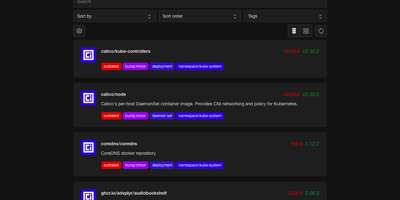
Cupdate keeps a watchful eye on every container image you run, reporting which ones are outdated or vulnerable while deliberately never touching the update button itself. Point it at a Kubernetes cluster, a Docker socket, or Podman hosts (local or remote, one or several) and it inventories every image in use with no configuration to write. Each image is matched against its registry to find the newest available version, and the dashboard shows the gap between what you deployed and what you could be running, with release notes inline so the decision to upgrade takes seconds instead of a changelog hunt. Vulnerability data is layered on top from four sources: Docker Scout for Docker Hub images, Clair for participating Quay images, GitHub Advisories for images tied to repositories, and osv.dev correlation for images shipping SBOMs. A dependency graph explains why each image exists in your stack by showing which workloads pull it, which ends the "can I delete this?" guessing game. Subscribe to the RSS feed to hear about new releases passively, query the REST API to drive scripts that update compose files or kustomizations, or surface outdated and vulnerable counts in a Homepage dashboard widget. Prometheus metrics and traces are available when you want the watcher itself watched. Running on a dedicated VPS on RepoCloud with guaranteed CPU, RAM, and SSD, full root SSH access, and a browser serial console. MIT licensed.
Docker Updater
Docker Updater puts you back in charge of container updates: it watches your registries for newer images, and nothing updates until you approve it, so no database restarts itself at dinner. Polls run on a schedule you set, and each container card shows the newer image waiting before anything is pulled. The check costs nothing: it compares the digest your container runs against the registry manifest without pulling a byte, across Docker Hub, GHCR and other Bearer-token registries. Read the last five GitHub releases for an image before committing, update one container or a batch, and watch the pull percentage, layer count and recreation step stream live on the card. If the new container fails to start, the old one returns automatically, and you can keep a backup even after a clean update. Not ready? Defer an update for 7, 14, 30 or 90 days, or indefinitely, and it leaves your notifications alone until then. Several Docker hosts join the same dashboard over SSH or TCP with health indicators, and Compose stacks restart together so services find new addresses. Notifications arrive through an auto-generated ntfy topic or your own Apprise URL, every update keeps a persistent log, and a reclaimable-images view shows what disk space old images hold. The dashboard serves on port 9090 in English or Simplified Chinese, with optional login. Running on a dedicated VPS on RepoCloud with guaranteed CPU, RAM, and SSD, full root SSH access, and a browser serial console. MIT licensed.
InfraCanvas
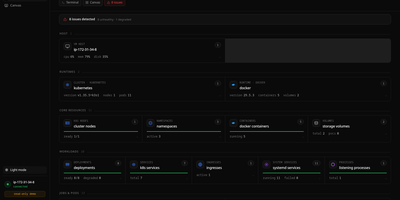
InfraCanvas draws the picture ten terminal commands cannot: a live map in your browser of every container, pod, service, volume and network on a machine, showing what runs where, what talks to what, and what is broken in one glance. Nodes turn green, amber or red from real state, including container health, pod phases, ready replicas, zombie processes and host thresholds, and real connection edges appear between processes, like your app server talking to Postgres on port 5432, read straight from the machine. It works where workloads already live: Docker and Podman containers, full Kubernetes object graphs from nodes to ingresses, LXD and Incus containers, and plain systemd or PM2 services on VMs with no container runtime. From any node you can shell into the container, pod or host, tail logs, restart or stop a service, scale a deployment, run a rolling restart, change an image or kill a process, with secrets masked before anything reaches the screen. A second machine joins through an outbound-only agent, and clusters connect by dropping in a kubeconfig with nothing installed inside them. The self-hosted binary needs no account, sends no telemetry and opens no inbound port: it binds localhost on port 7777 behind a random per-install token, with an optional read-only mode, and every action is audit-logged. Running on a dedicated VPS on RepoCloud with guaranteed CPU, RAM, and SSD, full root SSH access, and a browser serial console. AGPL-3.0 licensed.

Nanocl
One server, treated properly: Nanocl runs your containers and full virtual machines from a single declarative Statefile, reconciling what is running against what the file says, so a lone host gets cluster discipline without cluster ceremony. Containers group into Cargoes with replica counts, ordered init containers, and health-aware restarts; finite jobs run to completion and stop. When a workload needs a real kernel or a custom disk image, it boots as a QEMU virtual machine beside the containers instead of forcing a second platform. Publishing is built in: the proxy controller terminates TLS and routes HTTP and TCP traffic, and the DNS controller keeps service names resolving while workloads come and go. Secrets for registries, certificates, and environment variables attach where they are used, never inside the file itself. The daily loop is a CLI and an API: list processes, follow logs, exec into a container, watch events, and back up the entire deployment state before you change it. Namespaces keep projects apart on the same host, and Statefile arguments, templates, and sub-states carry one definition from staging to production. Running on a dedicated VPS on RepoCloud with guaranteed CPU, RAM, and SSD, full root SSH access, and a browser serial console. MIT or Apache-2.0 licensed.
AutoXpose
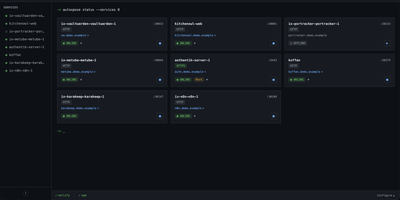
Tag a Docker container with two labels, and AutoXpose turns it into a published service with a DNS record, a reverse proxy route, and HTTPS, without you opening a single provider dashboard. From the web dashboard you connect one of six DNS providers, Cloudflare, Netlify, DigitalOcean, Porkbun, Aliyun, or Tencent DNSPod, and point it at the Nginx Proxy Manager or Caddy instance you already run. It watches your containers continuously after that: a new label creates the record, propagation is verified before the service shows as live, and removing the container removes its public entries too. Auto-expose mode publishes containers the moment they appear, while manual mode stages them in the dashboard for approval first. Color-coded service tags sort what you run into web, database, and media groups at a glance, and dashboard warnings flag misconfigurations before they become broken links. Nginx Proxy Manager access lists attach by label, so an admin panel stays reachable only from the networks you trust. When containers vanish, orphaned cleanup hunts down the stale DNS records and proxy hosts they left behind. Settings and state live inside the same single container, so the publishing pipeline for a homelab or a small fleet stays one compose service you can back up as a unit. Running on a dedicated VPS on RepoCloud with guaranteed CPU, RAM, and SSD, full root SSH access, and a browser serial console. MIT licensed.
HomeLabInfo
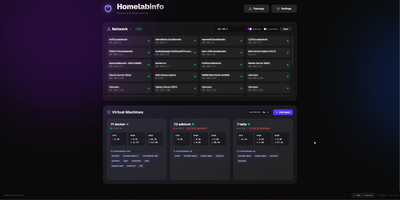
HomeLabInfo gives your homelab one dashboard where the network itself and everything running on it finally appear together, instead of scattered across router pages and terminal sessions. It watches for new devices the instant they ask the network for an address, identifies who made them, and can fire a webhook so you hear about a stranger joining your LAN before you notice it yourself. Scans keep track of which devices are online and which have gone quiet, and the interactive topology view lets you arrange the map of switches, access points, NAS boxes, and servers the way your rack actually looks. Lightweight agents installed on each machine report their containers back to the hub, so running and stopped containers, uptime, health, and host CPU, memory, and disk all show in one place without opening a separate tool per server. When an agent falls behind, its card tells you a newer version exists instead of leaving you guessing. You can add a username and password login before putting the dashboard anywhere beyond your desk, and arrange container layouts that stay put between visits. Running on a dedicated VPS on RepoCloud with guaranteed CPU, RAM, and SSD, full root SSH access, and a browser serial console. GPL-3.0 licensed.
Usulnet
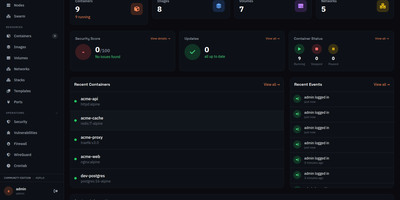
Usulnet packs container management, Trivy security scanning, Nginx reverse proxy, scheduled backups, WireGuard VPN, firewall rules, and multi-node orchestration into a single 70MB Go binary with zero external runtime dependencies. Every module ships in one download with no paid tiers, no telemetry, and no edition gating. Container lifecycle management covers creation, start, stop, restart, pause, kill, and removal with bulk operations, real-time resource statistics, filesystem browsing, and settings editing. Trivy integration scans images and running containers for CVEs with severity scoring, generates SBOMs, and validates CIS benchmarks. The multi-node architecture supports standalone, master, or agent modes where agents connect over NATS JetStream with mTLS encryption, enabling remote Docker host management from a central dashboard. Reverse proxy configuration handles Nginx with automatic Let's Encrypt certificates, TCP/UDP stream proxying, access lists, and dead host detection. Backup operations capture container volumes and Compose stacks on configurable schedules with retention policies and full restore capabilities. A built-in application catalog provides 60+ one-click templates for common services. JWT license validation uses an RSA-4096 public key embedded in the binary, requiring no call-home and working entirely offline. For teams tired of maintaining separate tools for each infrastructure concern, Usulnet collapses the entire stack into a single point of management with Docker Compose deployment alongside PostgreSQL, Redis, and NATS.
Simon
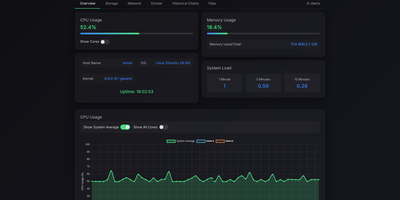
Simon is a lightweight self-hosted system monitor that shows live CPU, memory, disk, and network metrics for your server and its Docker containers in one web dashboard, with threshold alerts and a built-in file browser. Open the dashboard to watch real-time gauges alongside historical charts, so a slow memory leak becomes visible hours before it takes a service down. Every running container appears with its own CPU and memory stats, and its logs open in a searchable viewer, so routine diagnosis never needs a terminal session on the host. The file browser lets you navigate the directories you choose to expose, preview file contents, upload with drag and drop, create folders, and move or delete items. Downloads support range requests, which means large files resume cleanly after a dropped connection and media files stream instead of failing halfway. Alert rules fire when CPU, memory, disk, or network activity crosses thresholds you set, and notifications arrive through Telegram, ntfy, Gotify, Pushover, Pushbullet, Matrix, or any custom webhook. Prebuilt notification templates get common setups running in minutes, and password authentication keeps the dashboard private on a public server. Resource-constrained machines benefit most: the monitor runs comfortably on single-board computers and small instances where heavier monitoring stacks would consume the very memory they exist to watch. Running on a dedicated VPS on RepoCloud with guaranteed CPU, RAM, and SSD, full root SSH access, and a browser serial console. MIT licensed.
Statainer
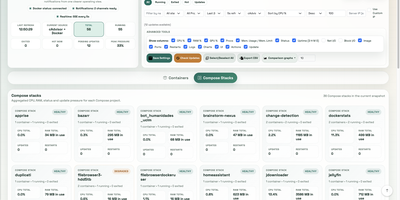
Monitoring and safeguarding Docker infrastructure without heavy enterprise software overhead is the primary mission of Statainer, an open-source management control center for container hosts. System operators inspect live CPU loads, memory consumption, network throughput, and disk I/O metrics across individual containers or comparative top-ranking charts. The interface groups containers by Compose projects, enabling administrators to start, stop, or restart entire application stacks and inspect real-time log streams without opening SSH sessions. The built-in Update Manager detects available image tags, executes single-click container updates, and maintains persistent deployment history with automated rollback capabilities for failed recreations. Custom alert configurations trigger instant notifications to Telegram, Discord, Slack, Pushover, or generic webhook endpoints whenever resource thresholds are breached or container health states change. Developers can provision scoped API keys with token authentication to automate container state transitions and export performance telemetry into custom monitoring workflows. Running on a dedicated VPS on RepoCloud with guaranteed CPU, RAM, and SSD, full root SSH access, and a browser serial console. MIT licensed.
Composr
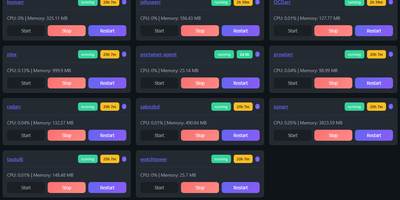
Managing multi-server container fleets often deteriorates into fragmented SSH sessions, mismatched compose files, and conflicting port allocations. Composr consolidates multiple Docker host daemons into a unified web dashboard that controls running containers, stack definitions, and system metrics from a single interface. Operators can connect remote Docker daemons through encrypted TCP sockets, inspect container health, and stream live execution logs with sub-second responsiveness. A built-in project creation wizard guides administrators through drafting new Compose topologies across local directories or remote server nodes. In-browser CodeMirror editors deliver live syntax highlighting for YAML files, configuration dotfiles, and reverse proxy definitions without detaching containers from disk. The platform tracks service properties directly, letting you toggle Compose profiles, relocate services between YAML manifests with pre-flight risk checks, and detect target port collisions before redeployment. Integrated backup managers bundle container metadata, compose files, and environment definitions into downloadable archive packages for automated disaster recovery. System operators can open interactive browser terminals into any active container, execute batch maintenance tasks, and configure scheduled image update checks. Running on a dedicated VPS on RepoCloud with guaranteed CPU, RAM, and SSD, full root SSH access, and a browser serial console. MIT licensed.
ContainerFlow
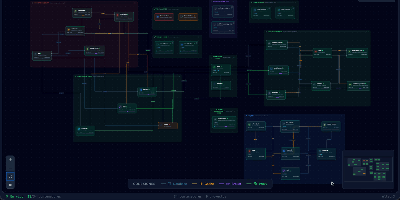
Your database container is probably not at 98 percent memory, whatever docker stats claims, because most of that figure is reclaimable page cache; ContainerFlow subtracts the full cache and shows the memory your containers actually hold. Point it at a Docker socket and it draws the whole estate as a living map: every Compose project discovered automatically, services grouped and colour coded, and the connections between them inferred, app to database, proxy to app, worker to broker. CPU and memory refresh every three seconds, the graph flashes when a container starts, stops, or restarts, and seven days of metric history wait in a local store when you need to know what happened overnight. Click any node and a detail panel opens with live logs you can filter by stream, an inline terminal that runs commands inside the container, and buttons to start, stop, restart, rebuild, recreate, or remove it. The same panel teaches as it works, flagging containers that run with no memory limit, no CPU limit, or no restart policy, while Discord webhooks fire when a container you care about crosses a threshold you set. Running on a dedicated VPS on RepoCloud with guaranteed CPU, RAM, and SSD, full root SSH access, and a browser serial console. AGPL-3.0 licensed.
LLemonStack
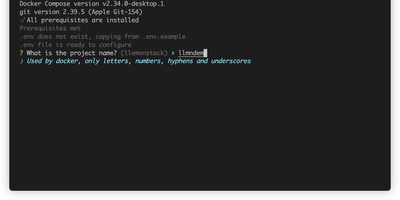
One CLI command deploys a complete AI development environment: n8n, Flowise, Supabase, Ollama, Qdrant, LiteLLM, Langfuse, Open WebUI, LightRAG, Browser-Use, Firecrawl, Crawl4AI, and more, all pre-wired with networking, credentials, and database connections. LLemonStack eliminates the hours of Docker Compose configuration that typically precede any local AI agent project. The llmn CLI initializes isolated project environments with auto-generated secure credentials, starts services in dependency order (databases first, then middleware, then apps), and displays a dashboard showing every service URL and access token. n8n brings 400+ workflow integrations, Flowise provides visual agent building, Ollama runs local LLMs like Llama and Mistral, Qdrant stores vectors at high performance, Open WebUI offers ChatGPT-style model interaction, and LiteLLM proxies requests to any provider with cost tracking. Langfuse automatically logs traces for every LiteLLM query, providing full observability. Each project maintains isolated Postgres schemas preventing data collision across parallel stacks. Firecrawl and Crawl4AI extract web content into LLM-ready formats for RAG pipelines feeding LightRAG or Qdrant. Dozzle streams live container logs for debugging. Import/export tooling migrates workflows between projects with automatic credential reconfiguration. Running on a dedicated VPS on RepoCloud with guaranteed CPU, RAM, and SSD, full root SSH access, and a browser serial console. AGPL-3.0 licensed.