Solectrus
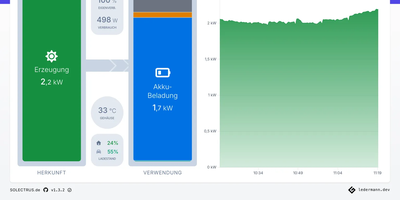
The inverter app tells you the sun shone; SOLECTRUS tells you what that sunshine was worth. It is a dashboard for your whole photovoltaic system that balances every watt: what the panels produced, what the house consumed, what the battery stored, and what crossed the grid meter in either direction, for any period you care to name. Up to five generators, from the main roof array to a balcony power plant, appear individually or summed, and up to twenty custom consumers, wallbox included, get their own accounting. The Power-Splitter shows how much green electricity actually landed in the car, the heat pump, or the washing machine, and what each load truly cost once lost feed-in revenue counts. Enter your electricity prices and feed-in tariff, including their changes over the years, and it computes savings, self-consumption costs, return, and the day the system has paid for itself from measured data rather than the sales brochure. Forecasts from pvnode, Solcast, or Forecast.Solar look up to seven days ahead using your location, orientation, tilt, and peak capacity. Heat pump owners see generated heat and coefficient of performance beside the power draw. Everything lands in InfluxDB and stays there, with daily aggregation keeping multi-year views fast, trends against last month or last year, and a Top-10 of your best and worst days. Running on a dedicated VPS on RepoCloud with guaranteed CPU, RAM, and SSD, full root SSH access, and a browser serial console. AGPL-3.0 licensed.
Deploy