OpenObserve
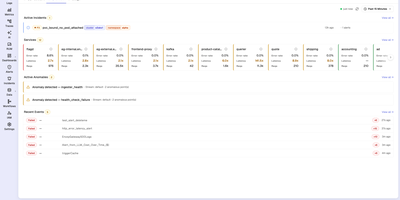
With 20,500+ GitHub stars and over 6,000 organizations running it in production — including a Fortune 100 company ingesting more than 4 PB per day — OpenObserve is the open-source observability platform that replaces your entire Datadog, Splunk, or ELK stack with a single Rust binary deploying in under two minutes. Apache Parquet columnar storage with zstd compression on S3-compatible object storage delivers 140x lower storage costs than Elasticsearch while providing better query performance on a quarter of the hardware. Ingest logs, metrics, and distributed traces via native OpenTelemetry OTLP endpoints with no vendor lock-in. Query logs and traces with standard SQL, metrics with SQL or PromQL — no proprietary query language to learn. The built-in dashboard builder offers 19 chart types including time-series graphs, heatmaps, gauges, tables, and top-K lists with drag-and-drop layout combining data from all signal types. Data pipelines process, enrich, redact, or normalize ingestion streams using Vector Remap Language for real-time transformations including PII redaction and logs-to-metrics conversion. Real User Monitoring captures frontend performance with session replay. The Service Catalog provides topology-based trace analysis with side-panel drill-downs into database queries and error details. Alerting supports real-time and scheduled rules with SQL and PromQL conditions. Native multi-tenancy isolates organizations and streams with complete data separation. Running on a dedicated VPS on RepoCloud with guaranteed CPU, RAM, and SSD, full root SSH access, and a browser serial console. AGPLv3 licensed.
Grafana Loki
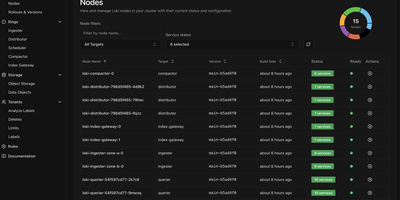
With over 28,600 GitHub stars and 450 contributors, Grafana Loki is the log aggregation system that takes the Prometheus approach to logging — indexing only metadata labels instead of full log content, making it dramatically cheaper and simpler to operate than traditional log management platforms. The label-based indexing strategy groups log streams using the same labels already applied to Prometheus metrics, enabling seamless switching between metrics and logs in Grafana dashboards without maintaining separate indexing infrastructure. Grafana Alloy, the telemetry collector replacing Promtail, scrapes and pushes logs with Prometheus-style service discovery, automatic Kubernetes Pod label extraction, and pipeline stages for parsing, filtering, and relabeling before ingestion. LogQL, the query language, combines label matchers for stream selection with regex line filters and aggregation functions, supporting rate calculations, pattern parsing, and metric generation from log data for alerting and dashboard panels. The storage architecture writes compressed log chunks and TSDB indexes to S3, GCS, Azure Blob Storage, or MinIO-compatible object stores, with configurable retention and compaction policies. Deployment modes scale from a single binary for development through monolithic high-availability mode with multiple replicas to full microservices decomposition with separate ingester, distributor, querier, query-frontend, compactor, and ruler components on Kubernetes via Helm charts. Multi-tenancy isolates data and query paths per tenant through header-based tenant ID assignment. Running on a dedicated VPS on RepoCloud with guaranteed CPU, RAM, and SSD, full root SSH access, and a browser serial console. AGPL-3.0 licensed.
Exceptionless
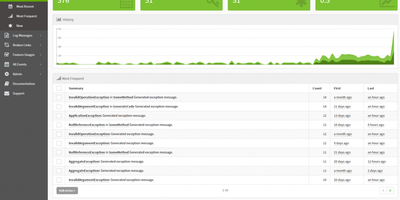
Exceptionless has earned over 2,400 GitHub stars and has been processing production errors since 2014 as the real-time event monitoring platform that captures far more than crashes. Built with ASP.NET Core on Elasticsearch for storage and Redis for caching, Exceptionless ingests exceptions, log messages, feature usage events, broken links, and custom event types through official SDKs for JavaScript, Node.js, .NET Core, ASP.NET, WPF, Web API, WebForms, Console apps, and React Native. Automatic event stacking groups related occurrences by exception type, message, and call stack into single actionable items, while manual stacking keys let developers create custom groupings for specific features or workflows. The real-time dashboard displays Most Frequent, Most Recent, and New event views with filtering by project, date range, environment, and custom tags. Stack management tracks resolution status with version-aware regression detection that automatically reopens resolved issues when the same error surfaces in a newer release. Webhook integrations connect to Slack, Discord, and external services through Zapier for automated issue tracking in GitHub Issues and Jira. Per-project notification settings control email and chat alerts for new errors, regressions, and critical events. OpenTelemetry support captures distributed traces alongside error data. The v8.6.0 release introduced a hosted Model Context Protocol server at the /mcp endpoint, enabling AI tools to query error data via OAuth-authenticated access. Deploy via Docker with the exceptionless/exceptionless image alongside Elasticsearch and Redis. Running on a dedicated VPS on RepoCloud with guaranteed CPU, RAM, and SSD, full root SSH access, and a browser serial console. Apache 2.0 licensed.
LogTide
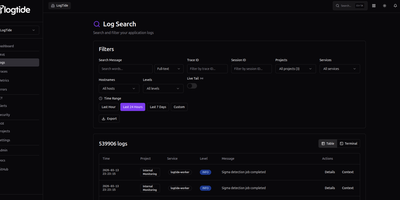
Every production incident starts the same way: someone asks "what do the logs say?" and the answer takes 45 minutes to find. LogTide collapses that search into seconds with a unified observability platform that indexes logs, traces, and metrics into a single queryable interface, backed by your choice of TimescaleDB, ClickHouse, or MongoDB. The log search interface supports full-text queries across millions of entries with filters for trace ID, session ID, project, service, hostname, and severity level, plus a live tail mode that streams new log lines as they arrive. Distributed traces render as waterfall timelines showing every span, its duration, and cross-service dependencies, while correlated logs for each trace are one click away. The metrics explorer visualizes OTLP gauge and counter data from your applications with system CPU, memory, disk, and network panels that update in near real-time. Where LogTide diverges from standard observability is its built-in SIEM engine: Sigma-compatible detection rules scan incoming logs for security threats like SQL injection, privilege escalation, lateral movement, and C2 communication, surfacing findings on a dedicated security dashboard with severity distribution, detection timelines, and affected service breakdowns. Alerting pushes notifications to Email, Slack, or Discord webhooks when thresholds trip or security rules fire. Native SDKs for Node.js, Python, Go, PHP, Kotlin, and Ruby ship logs with retry logic and circuit breakers, and the platform accepts OpenTelemetry data natively. Running on a dedicated VPS on RepoCloud with guaranteed CPU, RAM, and SSD, full root SSH access, and a browser serial console. AGPL-3.0 licensed.
Moneat
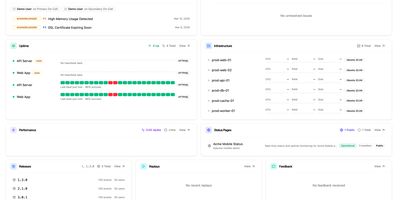
Moneat is the open-source observability platform that unifies error tracking, session replay, performance monitoring, logging, uptime checks, synthetics, product analytics, and AI observability into a single self-hosted application — replacing Sentry, Datadog, and Statuspage with one deployment. The Sentry SDK compatibility layer accepts data from @sentry/browser, @sentry/node, @sentry/react, @sentry/nextjs, sentry-sdk for Python, sentry-kotlin, sentry-java, sentry-android, sentry-cocoa, sentry-go, sentry-ruby, and Sentry.NET by updating one DSN endpoint. Datadog Agent compatibility redirects existing fleets by setting dd_url, and native OpenTelemetry OTLP ingestion accepts logs, traces, and metrics from any exporter or Collector. Error monitoring groups exceptions with smart deduplication, session replay records DOM-based user interactions linked to errors, distributed tracing visualizes transaction and span breakdowns with live service maps, and continuous profiling renders flamegraphs in pprof, JFR, and Sentry formats. Uptime monitoring runs HTTP, TCP, and ping checks with public status pages, while synthetics executes API tests, multi-step workflows, SSL checks, and DNS probes. Custom dashboards support drag-and-drop widgets with Grafana import, product analytics provides funnels and retention cohorts, release tracking surfaces crash-free rates with source map upload, and AI observability traces LLM calls end to end. Built on Kotlin and Java with ClickHouse for analytical storage, PostgreSQL for relational data, and Redis for caching, deployment uses Docker Compose with an interactive installer automating secrets and service orchestration. Running on a dedicated VPS on RepoCloud with guaranteed CPU, RAM, and SSD, full root SSH access, and a browser serial console. AGPL-3.0 licensed.