Akvorado
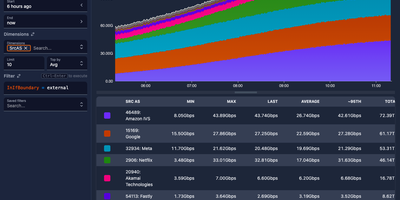
Point your routers at Akvorado and every NetFlow, IPFIX, and sFlow record crossing your network becomes a chart you can interrogate. The web console opens on a live summary of flows per second, exporter count, and traffic split by autonomous system, port, protocol, country, and address family. From there, the visualize page turns stored flows into stacked, line, grid, and heatmap time series, plus Sankey diagrams that show how traffic moves between networks, interfaces, and countries. Filters use a simple SQL-like syntax, so a question like which customers pulled traffic over a transit link last night becomes a query, not a support ticket to your future self. Because the outlet polls each exporter with SNMP or gNMI, flows arrive wearing real interface names, descriptions, and speeds instead of raw ifIndex numbers nobody can read. GeoIP lookups attach country and city to addresses, classification rules tag providers, peers, and connectivity types, and optional BMP sessions add AS paths and BGP communities to every flow. Retention is tiered: raw flows keep full detail for recent days while one-minute, five-minute, and hourly rollups stretch summaries across a year of history. A Grafana plugin is available too, so the same flow data can sit on the dashboards your team already watches. Running on a dedicated VPS on RepoCloud with guaranteed CPU, RAM, and SSD, full root SSH access, and a browser serial console. AGPL-3.0 licensed.
Rackpad
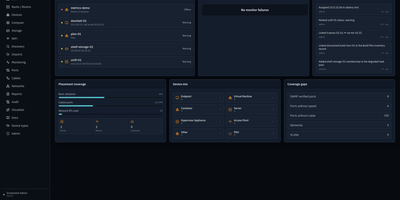
Every cable, switch port, VLAN, and rack unit in a homelab or small server room gets a documented place in Rackpad, a self-hosted inventory and operations workspace. Rack elevations show mounted gear, including paired half-width appliances. Switch-panel port maps and aggregate ports show what is patched where. Cables carry type, length, and color, editable in bulk. VLANs, subnets, DHCP scopes, reservations, and zones sit in one Networks workspace, with gateway and DNS protection and a mismatch review for IP assignments. Storage topology follows drives, bays, and pools that span several devices. Wi-Fi controllers, access points, hypervisor hosts, and virtual machines have pages of their own, and Proxmox and Hyper-V hosts can be imported after review. Discovery scans a subnet or any CIDR and stages every finding in an inbox. Per-device checks over ICMP, TCP, HTTP, HTTPS, and SNMP raise alerts by email, Discord, or Telegram. Everything feeds a movable topology map. Markdown runbooks attach to devices, and an audit log records every change. Admin, editor, and viewer roles control access, and OpenID Connect login is optional. Running on a dedicated VPS on RepoCloud with guaranteed CPU, RAM, and SSD, full root SSH access, and a browser serial console. MIT licensed.
nexdeck
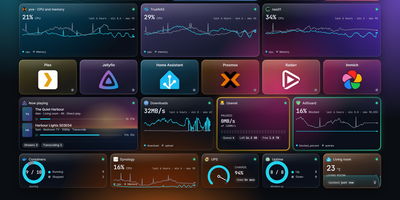
Every homelab ends up with twenty browser tabs, and nexdeck turns them into one board of cards that update on their own. The server asks each service in its own rhythm and pushes changes to every open browser, so ten tabs cost a service only one request. Cards cover Proxmox, Docker, Synology, TrueNAS, Pi-hole, Plex, Radarr, Home Assistant, and over two hundred more. Administrators can act from the cards by restarting a container, starting a VM, or pausing downloads, and every action is logged. Pages arrange freely on a 12, 24, or 36 column grid, with a phone layout that stacks cards in order and a kiosk link for wall displays that needs no sign-in. A network page draws a live UniFi plan with traffic on every link. A chronicle records outages and changes, history charts reach back two years, and alerts go to Telegram, email, Web Push, ntfy, Gotify, Discord, Slack, or Apprise. Boards export as YAML for Git, Docker labels create tiles, and OpenID Connect handles sign-in with roles and board sharing. Thirteen colour themes, light and dark modes, skins, and twelve languages make it yours. A demo board with invented data offers a safe first look. Running on a dedicated VPS on RepoCloud with guaranteed CPU, RAM, and SSD, full root SSH access, and a browser serial console. AGPL-3.0 licensed.
TheOneFile Verse
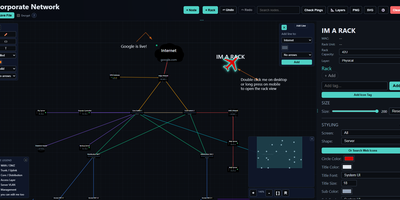
TheOneFile Verse is a self-hosted workspace where teams draw networks, smart homes, and infrastructure together on one live canvas. Each room is a shared map where nodes, racks, wires, zones, and text sync instantly between everyone connected, with live cursors, per-room chat, and an undo that only reverses your own edits. Status probes cover ICMP ping, TCP ports, HTTP, and DNS, and Network Discovery scans a subnet, names hosts through reverse DNS, mDNS, and SNMP, tags more than 70 common services with selfh.st icons, and drops the results onto the map as nodes. An Enter 3D button turns any map into a walkable, multiplayer 3D space with procedural device models, and rack views show equipment mounted by U slot. The admin dashboard manages rooms, users, roles, invite codes, OIDC providers, SMTP delivery, email templates, backups, API keys, and audit logs. Rooms can carry passwords, guest access, or an automatic self-destruct timer. Anyone can export a portable copy as one self-contained HTML file, with optional AES-256 encryption, and import it back later to keep collaborating. Running on a dedicated VPS on RepoCloud with guaranteed CPU, RAM, and SSD, full root SSH access, and a browser serial console. Unlicense licensed.
Topolograph
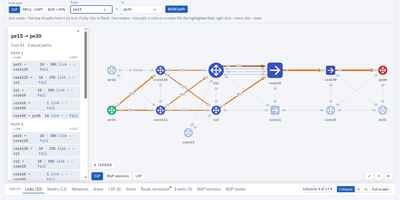
Before the maintenance window, know exactly where the traffic will go: Topolograph rebuilds your network the way its routing protocols see it and lets you break it safely on screen. Upload one router's LSDB output, from Cisco, Juniper, Arista, FRRouting, MikroTik, and a dozen other vendors, and the whole area's topology appears as an interactive graph, because the protocol already flooded it everywhere. Compute the shortest path between any two routers and see every equal-cost alternative with per-link loads, then fail a link or a node and watch SPF recalculate: which pairs moved to backup, which are left with none, and how the load shifted on every surviving link. Search the graph for prefixes, MAC addresses, or any network element, plan an MPLS TE path against real bandwidth attributes, and compare snapshots from different moments to answer what changed before the incident. Collectors can stream live OSPF, IS-IS, and BGP events over GRE, BGP-LS, or BMP so the timeline replays the network at the moment things broke, and a REST API, Python SDK, and MCP server let your own tooling and AI agents ask the same questions. Running on a dedicated VPS on RepoCloud with guaranteed CPU, RAM, and SSD, full root SSH access, and a browser serial console. MIT licensed.
Icinga 2
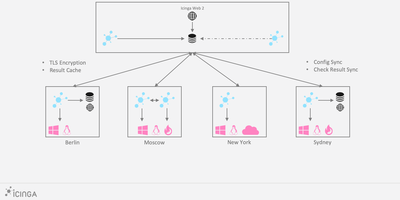
Servers, services, and network gear report their health to Icinga 2, the open-source monitoring core that runs checks, evaluates thresholds, and decides who gets woken up. A distributed hierarchy of master, satellite, and agent zones scales from a single box to global estates: satellites execute checks in remote regions and keep working when the master is unreachable, while agents run local checks under TLS-secured, certificate-based trust. The object-based configuration language defines hosts, services, dependencies, and notification rules as code, with apply rules generating checks across whole groups automatically. Performance data streams into Graphite, InfluxDB, or Elasticsearch writers, and Icinga DB carries runtime state and history into Redis and SQL for the web frontends. The REST API drives acknowledgements, downtimes, and check scheduling from scripts and chat tools, with fine-grained permissions down to diagnostic information. The 2.16 line hardens API security, streams richer runtime updates to Icinga DB for the new Icinga Notifications 1.0 incident workflows, and lets operators set exact acknowledgement times through the API. Running on a dedicated VPS on RepoCloud with guaranteed CPU, RAM, and SSD, full root SSH access, and a browser serial console. GPL-3.0-or-later licensed.
Tunnel Panel
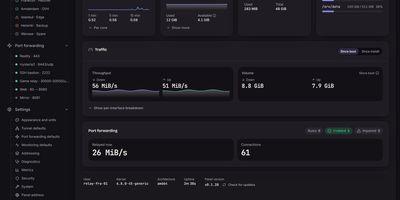
Tunnel Panel manages GRE tunnels and port forwarding on Linux servers from a web panel that previews every change before it runs and verifies the result against the kernel. Create GRE, GRETAP, IP6GRE, and IP6GRETAP tunnels and see the exact commands, unit file, and rollback before anything is applied. The far end configures itself from a pairing code, as text or QR, with the sides flipped automatically so the two ends cannot disagree by a typo. Native ICMP probing with hysteresis keeps a single dropped packet from flapping a tunnel between down and back, and when ICMP is filtered the panel knocks over TCP and says so instead of crying wolf. Forward any TCP or UDP port, or a whole range, with round-robin, source-hash, or weighted balancing across destinations, and a backend that stops answering its health knock leaves the ruleset until it recovers. Watch every connection crossing the relay, who connected, which destination took them, and how much has moved, and set traffic limits per tunnel, rule, or destination. When something breaks, diagnostics reach a verdict with evidence and a suggested fix, backed by a streaming manual probe and a path-MTU search that offers to apply its findings. The panel reads your kernel's relay limits, recommends values from the host's memory and cores, and refuses changes that would lock you out of your own server. Running on a dedicated VPS on RepoCloud with guaranteed CPU, RAM, and SSD, full root SSH access, and a browser serial console. AGPL-3.0 licensed.
Netmon
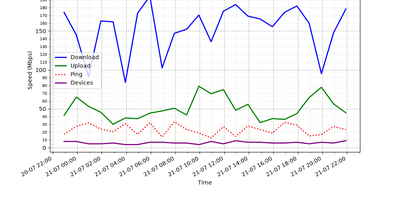
Every half hour, Netmon speed-tests your internet connection, counts the devices on your local network, and reports to your Telegram or Discord with charts and a sarcastic AI-written verdict. Each cycle measures download, upload, ping, ISP, and test server with a single-connection test that mimics one real download, then scans the subnet to tally phones, laptops, and mystery gadgets. Results land in a local SQLite database, building the trend history behind every report. Every four hours you get the full picture: a 24-hour speed graph plus an AI analysis that notices the evening drop, counts the new devices, and names the likely bandwidth hog in plain language. Between reports, short status alerts keep you posted with a simple all-good or line-is-dying. The AI commentary can run on a cloud model or a local one through Ollama or LM Studio, graphs and alerts convert cleanly between Telegram formatting and Discord embeds, and the whole bot runs unattended as a background service. Running on a dedicated VPS on RepoCloud with guaranteed CPU, RAM, and SSD, full root SSH access, and a browser serial console. MIT licensed.
Netra
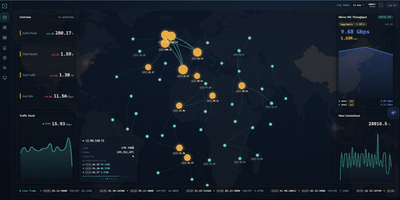
Netra watches your network from the side, plugged into a switch mirror port, and turns everything it sees into a live picture of your traffic without ever sitting in the forwarding path. A single binary loads its eBPF collectors in the kernel, so aggregation happens before packets reach user space and multi-gigabit mirror feeds stay observable instead of dropping samples. The dashboard opens on totals, protocol share, and traffic trends, then lets you drill into flows by address, port, domain, or service, check which countries your traffic talks to on a world map, and read the internal topology as a live graph. Domains surface passively from TLS handshakes, public addresses are enriched with country and organization data, and heuristic detectors flag scanning, flooding, and single-host surges, pushing alerts to your team chat with an optional AI-written explanation. You can ask the built-in assistant questions about real recorded history, connect external MCP servers so it can call your own tools while it answers, and stream flows onward to Kafka for other consumers. History rolls into compressed columnar files on a schedule and stays queryable for a month by default. Running on a dedicated VPS on RepoCloud with guaranteed CPU, RAM, and SSD, full root SSH access, and a browser serial console. GPL-3.0 licensed.
PRISM
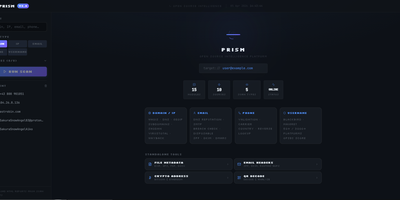
PRISM consolidates passive reconnaissance, credential leak detection, and network asset mapping into a unified operational dashboard to replace fragmented command-line security tools. Analysts can launch simultaneous multi-source investigations against domains, internet protocol addresses, email mailboxes, phone numbers, and online handles to uncover domain registrations, open network ports, cryptographic certificates, and historical web archives. The platform interrogates threat feeds and leak repositories to expose credential leaks, dark web mirrors, and email routing anomalies with automated SMTP mailbox verification. Cross-platform identity engines crawl thousands of social networks and public registries to correlate aliases, discover leaked commit identities, and trace digital footprints across the web. Discovered assets render into interactive entity relationship graphs alongside geographic internet protocol maps to help investigators visualize infrastructure clusters and ownership links. An automated operational security calculator evaluates exposure vulnerabilities across identity, web, and infrastructure vectors, producing an aggregated risk score with granular hardening recommendations. Scheduled watchlists continually monitor target infrastructure, dispatching webhook notifications to chat channels whenever new subdomains, ports, or credential leaks appear. Investigators can export comprehensive audit dossiers as self-contained HTML files, styled PDF documents, or structured spreadsheets. Running on a dedicated VPS on RepoCloud with guaranteed CPU, RAM, and SSD, full root SSH access, and a browser serial console. MIT licensed.