Neko Master
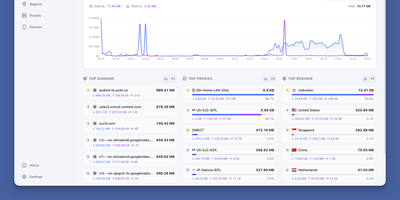
Neko Master watches every connection flowing through your Clash, Mihomo, or Surge gateway and turns the stream into a live map of devices, domains, countries, and proxy nodes, so questions that once needed packet captures get answered at a glance. The dashboard refreshes over WebSocket as traffic moves, charting upload and download trends across thirty minutes, one hour, or a full day. Domain views rank every host your network contacts by traffic and connection count, and IP views add ASN and geographic detail, so an unfamiliar endpoint explains itself instead of raising an alarm. Proxy statistics break traffic down per node and per rule, which makes a saturated exit, a misrouted application, or an underused subscription obvious in seconds. One panel watches several gateways at once: add OpenClash backends directly, or install the one-command agent on OpenWrt, Linux, or macOS machines beside remote gateways and let each agent report home. Because agents open the connection outward, gateways behind NAT still report in, and the panel never reaches into your network uninvited. History persists in SQLite by default, and busy networks can dual-write traffic statistics to ClickHouse for larger histories while configuration stays in SQLite. Token-based access control protects the dashboard, dark mode and an installable PWA keep it comfortable on a phone, and the interface switches between English and Chinese. Running on a dedicated VPS on RepoCloud with guaranteed CPU, RAM, and SSD, full root SSH access, and a browser serial console. MIT licensed.
Deploy