3X-UI
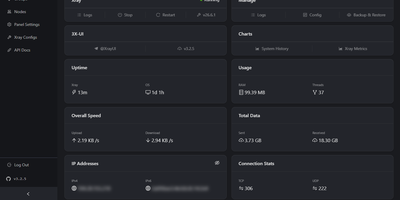
3X-UI is the most popular open-source Xray management panel, providing a full-featured web interface for deploying and monitoring proxy and VPN protocols on Linux servers. The Go backend manages Xray-core instances supporting VLESS, VMess, Trojan, Shadowsocks, WireGuard, Hysteria2, HTTP, SOCKS, Dokodemo-door, and TUN inbounds across TCP, mKCP, WebSocket, gRPC, HTTPUpgrade, and XHTTP transports secured with TLS, XTLS Vision, and REALITY. The Clients page tracks each user with individual traffic quotas, expiration dates, concurrent connection limits, and live online status indicators, while one-click share links, QR codes, and a built-in subscription server distribute configurations in multiple output formats. The multi-node architecture manages and scales deployments across multiple servers from a single panel instance. The Panel Settings page configures listen address, port, URI path, session duration, trusted proxy CIDRs, authentication, and Telegram bot integration for remote monitoring and management alerts. Outbound routing supports WARP, NordVPN, custom rules, load balancers, and proxy chaining. Xray Configs provides template-level control over the core configuration, while the API Docs page exposes a complete RESTful API with in-panel Swagger documentation. Data persists in SQLite by default or PostgreSQL for larger deployments, with database export and import from the panel. Fail2ban integration enforces per-client IP limits. On RepoCloud, deploy 3X-UI on a dedicated VPS with Docker, root SSH access, and complete control over your proxy infrastructure, all under the GPL-3.0 license.
Zabbix
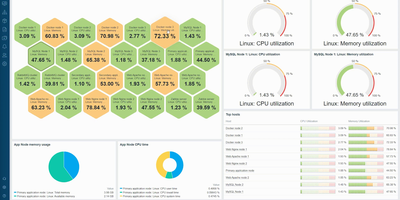
Monitoring everything from network switches to Kubernetes clusters since 2001 with over 6,200 GitHub stars and deployments exceeding 100,000 devices per installation, Zabbix has established itself as one of the most mature and feature-rich open-source monitoring platforms available, trusted by organizations including Dell, Salesforce, ICANN, and T-Mobile. The platform collects metrics from virtually any source using Zabbix Agent written in C, Zabbix Agent 2 written in Go with native plugin support, SNMP v1/v2c/v3 polling and trapping, IPMI for hardware health, JMX for Java applications, SSH and Telnet checks, HTTP/HTTPS polling, and ODBC database queries. Version 7.0 LTS introduced synthetic browser monitoring that executes user-defined JavaScript via WebDriver to simulate multi-step user interactions on websites, proxy load balancing with automatic host redistribution across proxy groups for high availability, in-memory proxy data buffering delivering up to 100x performance improvement, native multi-factor authentication with TOTP and Duo support, and just-in-time user provisioning from SAML and LDAP. Low-level discovery automatically detects file systems, network interfaces, SNMP OIDs, VMware resources, and Kubernetes pods, creating monitoring items and triggers dynamically. The alerting engine correlates events with configurable escalation chains, sending notifications through Slack, Microsoft Teams, PagerDuty, Jira, email, and SMS with customizable message templates. Over 1,000 official templates provide instant monitoring for Linux, Windows, VMware, AWS, Azure, Docker, PostgreSQL, MySQL, Apache, Nginx, and hundreds more. Running on a dedicated VPS on RepoCloud with guaranteed CPU, RAM, and SSD, full root SSH access, and a browser serial console. AGPL-3.0 licensed.
Polaris Control Plane
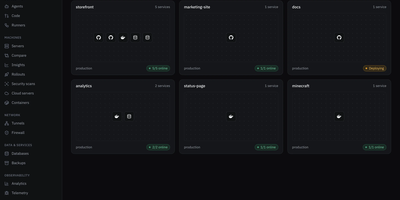
Polaris puts app deploys, file storage, team chat, tasks, and a password vault behind one login on a server you control. Deploy from a Git repository or an image with databases, volumes, environment variables, logs, a terminal, and a domain, published through your own domain, a Cloudflare tunnel, or DuckDNS. Enroll more machines over SSH with one generated command, then watch their containers and metrics and schedule backups with restore. Drive spans local disks, SFTP, S3-compatible storage, SMB, NFS, Google Drive, OneDrive, and Dropbox, with password-protected public links, expiry, and drop points for people without an account. Vault works with the Bitwarden apps and extensions and encrypts in the browser, so the server never sees your master password. Chat brings channels, threads, direct messages, voice and video calls, screen sharing, and a soundboard, while Tasks adds lists, boards, sprints, goals, and time tracking, and can hand work to coding agents over MCP. Calendar syncs both ways with Google, Microsoft 365, and CalDAV and offers booking pages. Game servers run Minecraft, ARK, and FiveM, a firewall blocks countries, networks, and bots, and one-click Marketplace installs add more apps. The interface comes in English and Spanish. Running on a dedicated VPS on RepoCloud with guaranteed CPU, RAM, and SSD, full root SSH access, and a browser serial console. AGPL-3.0 licensed.
Sencho
With over 430 GitHub stars and designed for DevOps engineers, platform teams, and homelab operators, Sencho is the self-hosted Docker Compose control plane that gives you a real operational cockpit without abandoning file-on-disk compose workflows. The web dashboard provides live CPU, memory, and disk sparklines per container, one-click start/stop/restart controls, and a Monaco-powered YAML editor with syntax highlighting, inline diff, and one-click rollback. Compose files remain the source of truth on the host filesystem. Multi-node management connects remote Sencho instances via authenticated HTTP and WebSocket proxy using long-lived API tokens, with no SSH access or exposed Docker sockets required. The Pilot Agent establishes an outbound-only WebSocket tunnel for nodes behind NAT, CGNAT, or strict firewalls. Blueprints define compose intent once and deploy it across label-targeted nodes, with drift detection keeping the fleet aligned. Fleet Federation provides cordon and pin controls for maintenance windows, while Fleet Actions execute bulk deploy, stop, and restart operations by stack label across the entire infrastructure. The security suite includes Trivy vulnerability scanning, deploy enforcement policies, SARIF and SBOM export, and Fleet Sync to replicate scan policies across replicas. Additional capabilities include 199+ one-click app templates, Git source integration, atomic deploys with auto-rollback, auto-heal, scheduled operations, webhooks, and custom S3 off-site backups to MinIO, R2, B2, or AWS. Running on a dedicated VPS on RepoCloud with guaranteed CPU, RAM, and SSD, full root SSH access, and a browser serial console. AGPL-3.0 licensed.
ContainerFlow
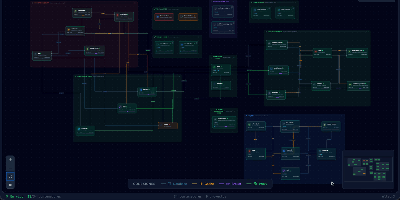
Your database container is probably not at 98 percent memory, whatever docker stats claims, because most of that figure is reclaimable page cache; ContainerFlow subtracts the full cache and shows the memory your containers actually hold. Point it at a Docker socket and it draws the whole estate as a living map: every Compose project discovered automatically, services grouped and colour coded, and the connections between them inferred, app to database, proxy to app, worker to broker. CPU and memory refresh every three seconds, the graph flashes when a container starts, stops, or restarts, and seven days of metric history wait in a local store when you need to know what happened overnight. Click any node and a detail panel opens with live logs you can filter by stream, an inline terminal that runs commands inside the container, and buttons to start, stop, restart, rebuild, recreate, or remove it. The same panel teaches as it works, flagging containers that run with no memory limit, no CPU limit, or no restart policy, while Discord webhooks fire when a container you care about crosses a threshold you set. Running on a dedicated VPS on RepoCloud with guaranteed CPU, RAM, and SSD, full root SSH access, and a browser serial console. AGPL-3.0 licensed.
Lab Dash
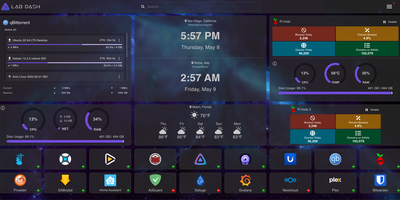
Every homelab deserves a control center that looks as good as the services it manages. Lab Dash gives you a customizable, drag-and-drop dashboard where every tile earns its spot. Add shortcut widgets linking to your Plex, Grafana, Nextcloud, or any service with automatic health check indicators showing green or red status at a glance. The system monitoring widget displays real-time CPU usage, memory consumption, network throughput, disk utilization, and temperature readings by mounting the host /sys directory as a read-only volume. Integrate Pi-hole stats, qBittorrent download progress, and media server widgets for Jellyfin, Plex, or Emby directly on your grid. Multiple pages let you organize services by category, and the search bar finds any tile instantly. Customize the background image from a local upload or URL, set a custom title and tab name, and choose your preferred search provider including self-hosted options like SearXNG. All sensitive configuration data is encrypted locally with AES-256-CBC, and only administrator accounts can modify the layout. Install Lab Dash as a Progressive Web App on desktop, phone, or tablet for a native app experience with offline capability. Configurations export as backup files for easy migration between instances. On RepoCloud, deploy Lab Dash on a dedicated VPS with root SSH access and Docker socket connectivity under the GPL-3.0 license.
WGDashboard
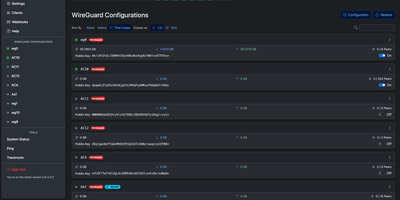
Managing WireGuard and AmneziaWG servers no longer means SSH sessions and typing wg show, because one browser dashboard covers every configuration and peer. WGDashboard finds existing configurations under /etc/wireguard and /etc/amnezia/amneziawg, so a running server appears right after installation. The home screen shows CPU, storage, memory, and swap meters above each configuration with its usage totals, peer count, and an on and off switch. Open a configuration for live data usage charts and a peer grid with search, sorting, tags, and bulk selection. Peers can be added one at a time or in bulk with generated keys and the next free addresses, then edited, restricted, deleted, or shared as a QR code, link, or email. Scheduled jobs restrict or delete peers when set conditions are met. Built-in ping and traceroute tools plot their results on a map. Settings add optional TOTP multi-factor sign-in, API keys, webhooks, light and dark themes, and a language selector. A remote server list connects one dashboard to others. Installation works on bare-metal Linux or in Docker. Running on a dedicated VPS on RepoCloud with guaranteed CPU, RAM, and SSD, full root SSH access, and a browser serial console. Apache-2.0 licensed.
DockNest
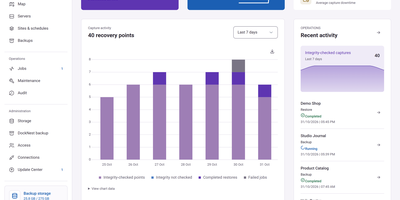
A backup nobody has restored is only a hope, so DockNest backs up your Docker sites to storage you own and proves each one by restoring it to a private copy. It connects to your Linux servers over SSH and finds the Docker projects and static nginx sites on them. Schedules, retention, and pinned backups are set per site. A Map page draws your servers, sites, and backup storage as connected nodes, and dragging a site to another server moves it, with a backup first and the old copy kept stopped for seven days. Jobs show live progress, a step timeline, and plain-language reasons when something fails. Automatic restore tests bring the latest backup up on a test server and check it. Hardening scores grade each site from A to F with a fix for every finding, and server cleanup previews reclaimable space before anything is removed. Alerts reach Telegram, Slack, Discord, email, ntfy, and many more channels. Backups are encrypted with AES-256-GCM, sign-in needs an authenticator app, and the interface offers light and dark themes plus a phone layout. Running on a dedicated VPS on RepoCloud with guaranteed CPU, RAM, and SSD, full root SSH access, and a browser serial console. AGPL-3.0 licensed.
CELERITY Panel
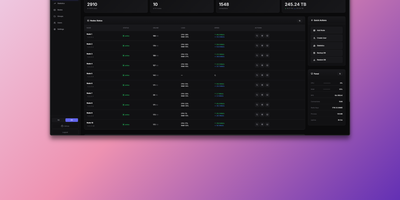
CELERITY Panel puts every Hysteria 2 and Xray VLESS node you run behind one clean web panel, so a fleet of proxy servers behaves like a single service. Add a node and the panel connects over SSH to install the software, certificates, and port hopping for you. Server groups map users to the nodes they may use, and load balancing spreads them by real server load. Cascade topology chains servers together, so clients connect to one node while traffic exits through another, drawn on a visual network map. Traffic rules block advertising domains and unwanted destinations or route selected traffic through custom proxies. Each user receives a subscription link that formats itself for Clash, Sing-box, Shadowrocket, and Hiddify. The dashboard watches online users, traffic volume, and node health in real time, and an in-browser SSH terminal reaches any node without leaving the panel. Programmatic control comes through scoped API keys with IP allowlists and rate limits, signed webhooks announce events as they happen, automatic backups land on S3-compatible storage, and AI assistants can operate the panel through its MCP interface. Two-factor authentication protects the admin login. Running on a dedicated VPS on RepoCloud with guaranteed CPU, RAM, and SSD, full root SSH access, and a browser serial console. MIT licensed.
LabTether
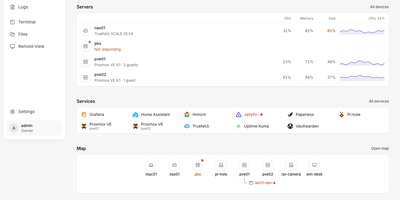
LabTether is a self-hosted control hub that puts every machine, VM, and container in your homelab on one screen. The dashboard surfaces what needs attention first, then lists servers with CPU, memory, disk, and 24-hour charts beside the services you run. Connect Proxmox VE, Proxmox Backup Server, TrueNAS, Portainer, and Home Assistant with an API key, and add agents on Linux, macOS, or Windows machines for live metrics. Open a terminal, a file browser, or a VNC, RDP, SPICE, or WebRTC remote desktop on any node from the browser. Alert rules, notification routes, and maintenance silences group related problems into incidents you can track to the fix, and a dependency map shows what else goes down before you reboot something. Saved actions run on a group or a schedule, webhooks forward hub events, and package updates start with a dry run. A built-in MCP server hands Claude, Cursor, or any MCP client 32 tools, each API key limited to the scopes you allow. Two-factor login, OIDC single sign-on, owner, admin, operator, and viewer roles, and an audit log keep access tidy. Running on a dedicated VPS on RepoCloud with guaranteed CPU, RAM, and SSD, full root SSH access, and a browser serial console. Apache-2.0 licensed.
Statainer
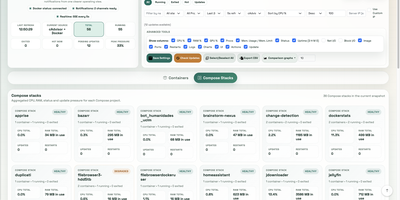
Monitoring and safeguarding Docker infrastructure without heavy enterprise software overhead is the primary mission of Statainer, an open-source management control center for container hosts. System operators inspect live CPU loads, memory consumption, network throughput, and disk I/O metrics across individual containers or comparative top-ranking charts. The interface groups containers by Compose projects, enabling administrators to start, stop, or restart entire application stacks and inspect real-time log streams without opening SSH sessions. The built-in Update Manager detects available image tags, executes single-click container updates, and maintains persistent deployment history with automated rollback capabilities for failed recreations. Custom alert configurations trigger instant notifications to Telegram, Discord, Slack, Pushover, or generic webhook endpoints whenever resource thresholds are breached or container health states change. Developers can provision scoped API keys with token authentication to automate container state transitions and export performance telemetry into custom monitoring workflows. Running on a dedicated VPS on RepoCloud with guaranteed CPU, RAM, and SSD, full root SSH access, and a browser serial console. MIT licensed.
Skiff
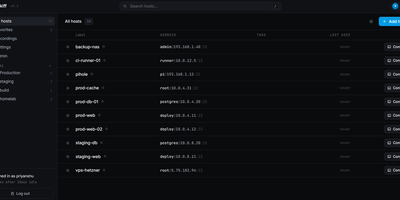
Skiff is a self-hosted SSH manager that remembers every command you ran on your servers and exactly what it printed, so the fix you found at 2 a.m. last March takes seconds to find again. Open a host's history beside its terminal, or search commands and captured output across every host, filter to just the failed attempts, and expand an entry to see its full output. When you edit a small text file, Skiff reads it over SFTP and keeps the before-and-after diff and both versions, so you can see what changed instead of guessing. Useful entries pin to a host's notes, save as reusable snippets, or go back into the terminal with Run again, where you review and press Enter yourself. The browser is only a viewer: sessions live in the Skiff server process, so closing a tab or losing Wi-Fi does not kill your work, and you reattach with recent scrollback intact. Hosts organize into nested folders with favorites and full-text search, existing SSH configs import in one paste, and host keys pin on first connect with a loud warning if one ever changes. Credentials sit in an encrypted vault that locks itself after an idle timeout, team mode shares one vault with per-user logins, and there is no cloud account, telemetry, or agent to install on any target server. Running on a dedicated VPS on RepoCloud with guaranteed CPU, RAM, and SSD, full root SSH access, and a browser serial console. AGPL-3.0 licensed.
BackupX
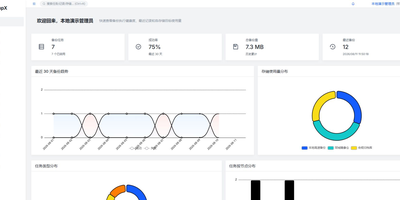
BackupX puts every server backup you are responsible for into one web console, so cron lines scattered across machines become scheduled, visible, and verifiable tasks. Files and directories from multiple sources, MySQL, PostgreSQL, SQLite, SQL Server, and SAP HANA databases all back up on cron schedules you can also build in a visual editor, with automatic retention by days or count cleaning up what expires. More than seventy destinations are reachable through rclone, from S3 and other object stores to Google Drive, WebDAV, FTP, SFTP, Azure Blob, Dropbox, and OneDrive, and storage targets show connection health and live capacity before a job ever fails against a full disk. A master and agent design lets remote servers poll outward only, even through proxies, private certificate authorities, or SSH bastions, so agents run tasks locally with no inbound connectivity to defend. Per-node bandwidth caps and concurrency limits keep a small node polite and a big node busy, each at its own pace. Success and failure notifications arrive by email, webhook, or Telegram, while Prometheus metrics, health probes, an SLA breach gauge, and a full audit log keep the platform observable, and signed audit webhooks forward events to SIEM or WORM storage for compliance records. Running on a dedicated VPS on RepoCloud with guaranteed CPU, RAM, and SSD, full root SSH access, and a browser serial console. Apache-2.0 licensed.
OmniSight
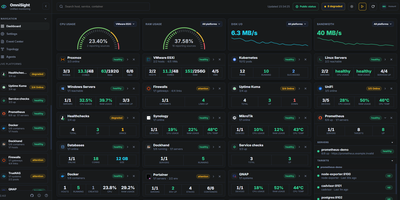
OmniSight ends the homelab ritual of a dozen admin panels open in a dozen tabs, each with its own login and its own idea of what healthy looks like. It folds all of them into one page that answers the only question you actually have: is everything fine? Watch Proxmox nodes with their VMs, containers, backup status, and Ceph health next to VMware hosts and datastores, Linux and Windows servers, and Kubernetes pods with live log viewing. Add Docker hosts and see container status, ports, resource use, and image updates, check OPNsense firewalls, TrueNAS and QNAP storage, and PostgreSQL, MySQL, and MongoDB databases without leaving the dashboard. A small push agent installs with one copied command and self-registers within seconds, needing no inbound firewall rules, so machines behind NAT report in on their own. Follow relationships on the topology map, restart a service from the detail view, export a full backup, and publish a read-only public status page for anyone who asks how things are running. Running on a dedicated VPS on RepoCloud with guaranteed CPU, RAM, and SSD, full root SSH access, and a browser serial console. GPL-2.0 licensed.
Saki Panel
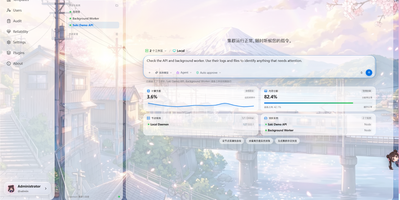
Saki Panel is a self-hosted operations console that manages your game servers, containers, and background processes across multiple Linux machines, with an AI assistant sitting inside the workspace when something breaks. Start, stop, restart, and monitor nine kinds of instances, from Minecraft and Steam game servers to Docker containers, Compose stacks, Node and Python apps, and plain shell commands. Remote nodes connect over SSH and report CPU, memory, and disk metrics to a cluster dashboard, so every machine is visible in one place. When an instance crashes, Saki Watch records the exit and its error fingerprint, then helps diagnose the cause from live logs, files, and metrics instead of making you copy text between a terminal and a chat window. Proposed fixes appear as diffs that need your approval, are graded by risk level, and can roll back automatically if verification fails after a patch. Day to day work happens in the same console: a web terminal, a file manager with an editor and archive support, database tools for SQLite, MySQL, PostgreSQL, and Redis, and cron-scheduled tasks with full run history. Role-based access with dozens of permission codes, audit logs, and incident notifications through webhooks or Telegram keep a small team in control. Running on a dedicated VPS on RepoCloud with guaranteed CPU, RAM, and SSD, full root SSH access, and a browser serial console. Apache-2.0 licensed.