Apache SkyWalking
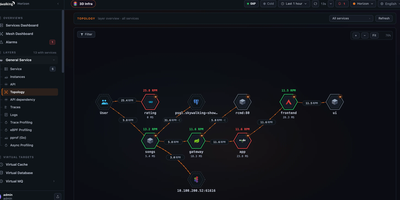
An open-source application performance monitoring platform for microservices, Kubernetes, and service meshes, Apache SkyWalking draws the live service map and ties slow requests to their traces, logs, and metrics. Agents cover Java, .NET Core, PHP, Node.js, Go, Lua, Rust, C++, browser JavaScript, and Python, and OpenTelemetry, Zipkin, Prometheus, Zabbix, and Telegraf data can be ingested too. Start at the service topology map, follow a request through the trace waterfall, then drill into the instance and its API dependencies. When the cause is inside the code, trace profiling, async-profiler, Go pprof, eBPF, and network profiling render flame graphs and process graphs in the same console. The Rover eBPF agent profiles Kubernetes workloads for CPU and network problems, and Istio and Envoy service meshes, including Istio Ambient, report into the same dashboards. Alarm rules target a service, deployment, or API, and alarms and telemetry can be forwarded to third-party systems. Metric and log analysis rules hot-update at runtime without a restart, and a live debugger shows what each rule stage receives and produces. An AI assistant answers plain-language questions with charts, topology, and traces from live data, using an OpenAI-compatible or Amazon Bedrock model you configure, and an MCP connection serves your own AI client. Running on a dedicated VPS on RepoCloud with guaranteed CPU, RAM, and SSD, full root SSH access, and a browser serial console. Apache-2.0 licensed.
Parseable
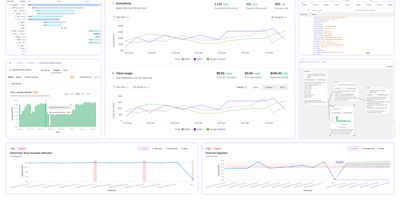
Parseable replaces expensive Elasticsearch clusters and fragmented monitoring stacks with a single Rust binary that ingests, queries, and stores logs, metrics, and traces on commodity object storage at a fraction of the cost. The data lake architecture decouples stateless compute from S3-compatible storage, enabling independent scaling of ingestion throughput and query capacity while cutting storage costs by up to 90% compared to indexed alternatives. OpenTelemetry-native OTLP ingestion accepts telemetry from existing OTel collector pipelines, Prometheus Remote Write endpoints, Kafka consumers, eBPF probes, and popular logging agents including Fluentd, Fluent Bit, and Vector without proprietary format conversions. The SQL-first query interface enables cross-signal analysis across all telemetry types, while native PromQL support with 50+ functions and 12 aggregation operators provides Prometheus-compatible metrics querying that works directly with Grafana dashboards. Built-in features include customizable dashboards, real-time alerting with Webhook, Slack, and Alertmanager targets, role-based access control, OpenID single sign-on integration, LogIQ automatic unstructured-to-structured log transformation, smart caching for frequently accessed data, and retention policies for lifecycle management. AI-powered Keystone Q&A provides natural language to SQL conversion and dataset summarization. All data stored as standard Apache Parquet on object storage remains accessible to any Parquet-compatible engine (DuckDB, Spark, Trino), ensuring zero vendor lock-in. Deploys on AWS S3, Azure Blob, Google Cloud Storage, MinIO, Wasabi, and DigitalOcean Spaces. Running on a dedicated VPS on RepoCloud with guaranteed CPU, RAM, and SSD, full root SSH access, and a browser serial console. Apache 2.0 licensed.
TraceRoot
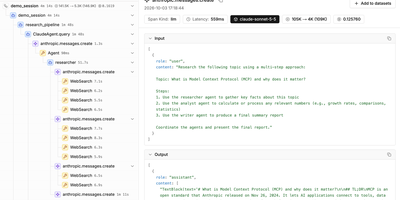
An agent run can finish without errors and still give the wrong answer, so TraceRoot traces every model and tool call, flags the production runs that missed the mark, and helps your coding agent ship verified fixes. Each run becomes a browsable call tree with inputs, outputs, latency, and cost, searchable by session or filter. Instrument with the Python or TypeScript SDK, the agent-native CLI, or any OpenTelemetry exporter, with ready integrations for LangChain, LangGraph, OpenAI Agents SDK, CrewAI, Vercel AI SDK, Mastra, and Pydantic AI. Detectors use LLM judges to score live traffic against the behavior you define and can post alerts to Slack. Judge outputs cluster into signals, then a background coding agent reads the traces and your connected GitHub code in a sandbox and recommends changes down to the commit, file, and line. Datasets, test cases, and scored eval runs compare versions so regressions surface before a release, and dashboards of widgets chart your trace data. The CLI hands your coding agent, such as Claude Code or Codex, the traces, signals, detectors, and evals to work from. Self-hosting keeps all of that trace data on infrastructure you control. Running on a dedicated VPS on RepoCloud with guaranteed CPU, RAM, and SSD, full root SSH access, and a browser serial console. Apache-2.0 licensed (core edition).
TeslaMate
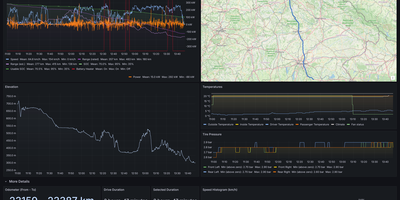
Logging every drive, charge, and idle stretch of a Tesla to a database you own, TeslaMate shows where the battery went, including degradation, vampire drain, and charging cost. Battery health comes first: the dashboard estimates usable capacity, range lost, and degradation against mileage. Idle losses come next, with Vampire Drain listing how much charge disappears during every idle period and a States view recording every online, asleep, and offline stretch. The car is left alone to fall asleep, so logging adds no extra vampire drain. Charging sessions show curves, energy added and used, efficiency, and cost, using per-location prices attached to geo-fences drawn on a map. Each drive records second-by-second speed, power, elevation, and temperature, plotted on a route map beside tire pressure and consumption charts. Trip, Drives, Efficiency, Drive Stats, Mileage, Updates, Statistics, and a lifetime driving map fill in the rest. Live vehicle data goes out over MQTT to Home Assistant, Node-RED, and Telegram, and old history imports from TeslaFi or tesla-apiscraper. Several vehicles on one Tesla account work together, addresses are looked up automatically, and the web interface offers light, dark, or system themes in 19 languages. Sign-in uses Tesla access and refresh tokens that TeslaMate encrypts with a key you set. It works best on an always-on server. Running on a dedicated VPS on RepoCloud with guaranteed CPU, RAM, and SSD, full root SSH access, and a browser serial console. AGPL-3.0 licensed.
Magistrala
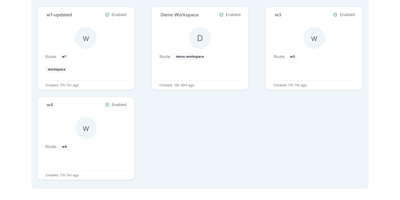
Thousands of devices speaking four different protocols is where IoT projects usually dissolve into glue code; Magistrala replaces that tangle with one platform where MQTT, HTTP, WebSocket, and CoAP clients share a single identity, provisioning, and messaging model. You organise work into domains, register clients for devices and applications, and connect them to channels that control who publishes and who subscribes, with fine-grained policies deciding which client may touch which channel. Protocol adapters bridge the transports, so a sensor publishing over MQTT and a dashboard reading over WebSocket meet in the same channel without translators in between. Telemetry lands in TimescaleDB through dedicated writer services and comes back out through reader APIs, while the bundled three-node FluxMQ cluster carries the messaging load with mutual TLS on device connections. The rules engine reacts to incoming messages with conditions and actions, alarms flag the readings that breach them, and reports package fleet data for the people who never open a terminal. A Community web UI covers domains, clients, channels, messages, and rules for day-to-day operation, and everything deploys as one Docker Compose stack with Prometheus metrics and Jaeger tracing already wired in. Running on a dedicated VPS on RepoCloud with guaranteed CPU, RAM, and SSD, full root SSH access, and a browser serial console. Apache-2.0 licensed.
SigNoz
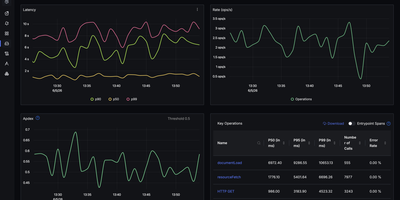
With over 31,000 GitHub stars and native OpenTelemetry support that eliminates vendor lock-in from day one, SigNoz delivers full-stack observability covering metrics, traces, and logs in a single pane of glass without the per-host pricing model of commercial APM platforms. The platform ingests telemetry data through the OpenTelemetry Collector, supporting auto-instrumentation for Java, Python, Node.js, Go, Ruby, PHP, and .NET applications with zero code changes required for basic tracing. ClickHouse serves as the columnar storage backend, providing fast aggregation queries over billions of spans and log lines with configurable retention policies and tiered storage. The distributed tracing view renders flame graphs and Gantt charts showing request flow across microservices with latency breakdowns, error rates, and p99 percentile calculations. Custom dashboards support PromQL and ClickHouse SQL queries with time-series charts, bar graphs, tables, and value widgets. The log management pipeline supports structured and unstructured logs with full-text search, log pipelines for parsing and enrichment, and correlation with traces via trace IDs. Alert rules can be configured on any metric or log query with notification channels including Slack, PagerDuty, OpsGenie, webhooks, and email. The exceptions monitoring module automatically groups and tracks application errors with stack traces, occurrence counts, and first-seen timestamps. Service maps visualize inter-service dependencies with real-time latency and error rate overlays. Running on a dedicated VPS on RepoCloud with guaranteed CPU, RAM, and SSD, full root SSH access, and a browser serial console. MIT licensed with an enterprise edition available.
Monoscope
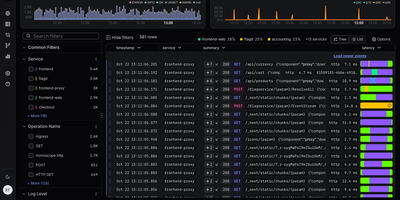
Across logs, traces, and metrics, Monoscope gives engineering teams one self-hosted workspace for finding what broke, asking questions in plain English, and hearing about problems before users do. Start in the Explorer: search events with KQL or an Ask AI prompt, flip between log rows, bar and line charts, log patterns, and sessions, and narrow results with facets for service, level, and HTTP status. Open any span to read its attributes, then follow the full trace across services in a waterfall, timeline, or map view. Live Tail streams new events as they arrive, and the Service Map draws every dependency with its error rate, latency, and requests per second. Build dashboards from widgets with copyable KQL and SQL, then set scheduled monitors with warn and alert thresholds, cron monitors, and uptime checks. An Issues inbox gathers API changes, errors, and log patterns so each one can be acknowledged, archived, or marked as spam, while Reports send scheduled summaries by email. Telemetry arrives over OTLP gRPC on port 4317 from OpenTelemetry SDKs and collectors. The monoscope CLI emits JSON for scripts, and an MCP server at /api/v1/mcp lets Claude, Cursor, and Cline search events and triage issues. Natural-language search uses the OpenAI-compatible model you configure. Running on a dedicated VPS on RepoCloud with guaranteed CPU, RAM, and SSD, full root SSH access, and a browser serial console. AGPL-3.0 licensed.
LangWatch
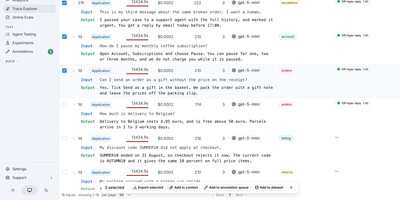
Every call your AI agents make becomes a searchable trace in LangWatch, and the same platform tests and scores those agents before a new prompt or model reaches users. The Trace Explorer filters by origin, user, model, cost, and evaluator, reads each run as a waterfall, flame graph, topology, or sequence diagram, and takes traces from the Python, TypeScript, and Go SDKs or any OpenTelemetry source. Agent Testing sends simulated users, in text or beta voice calls, through your agent while a judge passes or fails every criterion with its reasoning, adds multi-turn red teaming, and compares two agents side by side. The Experiments workbench scores prompts and agents on datasets with LLM judges, exact match, and RAG checks, then compares runs on cost, latency, and pass rate, while online evaluations monitor live traffic and guardrails block unsafe replies. Prompts keep version history and staging or production tags, Workflows wire prompts, Python code, and HTTP calls on a visual canvas, and annotation queues route traces to human reviewers. Alerts fire when a graph crosses a threshold, automations post to Slack, email, or webhooks, and scheduled reports go out by email or Slack. Claude Code, Codex, Copilot, Gemini CLI, and opencode report session cost, pull request cost, and terminal replays, and an MCP server exposes trace search and prompt management to coding assistants. Running on a dedicated VPS on RepoCloud with guaranteed CPU, RAM, and SSD, full root SSH access, and a browser serial console. Apache-2.0 licensed.
Rootprint
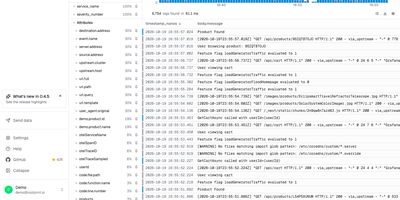
A year of searchable logs and traces no longer needs a metered logging service, because Rootprint keeps the whole index in a storage bucket you already own. A search matches any word on any line, since every log is indexed in full and no service name, stream, or label is needed first. A frequency histogram, one-click field filters, and saved views narrow the results, a fold mode collapses repeated lines, and exports arrive as NDJSON, CSV, or plain text, or as a share link. Open a trace from the log that emitted it, or paste a trace ID, and a waterfall shows per-span timing, attributes, events, and database calls grouped by query, with each span linking back to its logs. The trace explorer charts span volume, error rate, and p50, p95, and p99 latency, ranks the busiest operations, and filters spans by service, duration, and status. Every service gets its own page with request rate, error rate, operations, dependencies, and errors. Data arrives over OpenTelemetry from the Collector, Vector, or Fluent Bit, through a plain HTTP gateway, or by pulling from Kafka, Kinesis, or SQS, with guided setup for nine integrations. Indexes can live in S3, Google Cloud Storage, R2, MinIO, or Azure Blob. Teammates sign in with Google, GitHub, or any OpenID Connect provider, and scoped API keys serve scripts. Running on a dedicated VPS on RepoCloud with guaranteed CPU, RAM, and SSD, full root SSH access, and a browser serial console. Apache-2.0 licensed.
Eclipse Hono
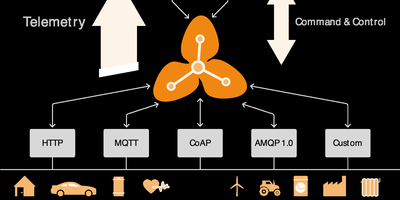
Eclipse Hono is an IoT connectivity platform that sits between device fleets and business applications, accepting connections over MQTT, HTTP, AMQP 1.0, and CoAP adapters and normalizing everything into uniform telemetry and event streams. Devices authenticate against a central registry of tenants and credentials, with X.509 client certificates, pre-shared keys, or automatic provisioning for zero-touch onboarding. Applications consume normalized data from Apache Kafka or an AMQP 1.0 messaging network, choosing per tenant which backbone carries its traffic, and send commands back down to devices through the same platform with delivery feedback. Resource limits cap how much data each tenant's devices may move, keeping one noisy fleet from crowding out the rest, while metrics and tracing follow every message hop. The 2.7 release adds preliminary MQTT 5 support with corrected connect reason codes, message tracing logs, and a hardened JDBC device registry backed by PostgreSQL for production tenant and credential management. Protocol adapters scale horizontally as stateless services, so capacity grows by adding instances behind a load balancer. Running on a dedicated VPS on RepoCloud with guaranteed CPU, RAM, and SSD, full root SSH access, and a browser serial console. EPL-2.0 licensed.