Traefik Manager
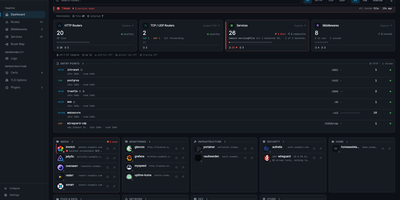
Where Traefik's built-in dashboard only shows what is running, Traefik Manager lets you change it: add routes, middlewares, and services from forms and wizards instead of editing YAML by hand. A first-run wizard connects to the Traefik API, creates a route for the manager itself, and sets the admin password. After that, the dashboard turns every route into a launchable app card with live health, and the Route Map draws each request from entry point through middlewares to backend. New routes use a slide-in form for HTTP, TCP, or UDP with several domains and backends, sticky sessions, and health checks. 30 middleware wizards handle authentication, rate limiting, headers, CORS, and redirects, and weighted, mirroring, or failover services can be built on their own. For day-to-day monitoring, the Certificates tab tracks expiry from acme.json, the Logs tab turns the access log into clickable analytics, the CrowdSec tab lists attacks and bans, and alerts reach Discord, Slack, ntfy, Telegram, and more. Changes to traefik.yml apply with a one-click restart, every edit is backed up locally and can be pushed to a git repository, and a lightweight agent brings remote Traefik servers into the same interface. Sign in with TOTP two-factor or OIDC single sign-on, in any of 14 languages. Running on a dedicated VPS on RepoCloud with guaranteed CPU, RAM, and SSD, full root SSH access, and a browser serial console. GPL-3.0 licensed.
Dockpeek
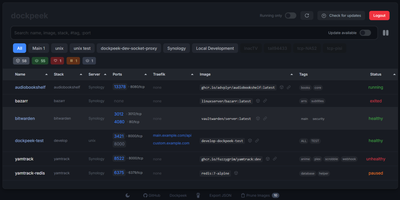
Fleet-wide container discovery, live log streaming, and Traefik reverse-proxy routing converge into Dockpeek, a lightweight Docker dashboard built for multi-host server environments. System administrators can launch web applications with one click through automatic port binding detection and integrated Traefik label parsing that extracts public routing hostnames directly from container configurations. The platform monitors multi-host environments through encrypted Docker socket proxies, letting operators inspect running containers, query published network ports, and trigger image updates from a unified control panel. Native Docker Swarm integration auto-detects active cluster managers, mapping swarm services and replicated tasks alongside standalone workloads while flagging degraded service replicas. Built-in log inspectors stream stdout and stderr outputs in real time with line-filtering controls to diagnose crashed services without opening remote SSH terminals. Operators can track image registries for newer digest tags, review pending updates across container fleets, and trigger graceful rolling container recreations directly from the dashboard. Running on a dedicated VPS on RepoCloud with guaranteed CPU, RAM, and SSD, full root SSH access, and a browser serial console. MIT licensed.