Neko Master
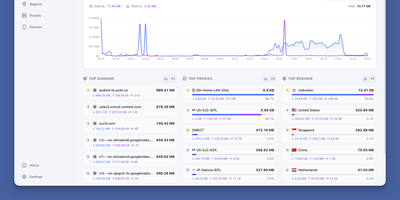
Neko Master watches every connection flowing through your Clash, Mihomo, or Surge gateway and turns the stream into a live map of devices, domains, countries, and proxy nodes, so questions that once needed packet captures get answered at a glance. The dashboard refreshes over WebSocket as traffic moves, charting upload and download trends across thirty minutes, one hour, or a full day. Domain views rank every host your network contacts by traffic and connection count, and IP views add ASN and geographic detail, so an unfamiliar endpoint explains itself instead of raising an alarm. Proxy statistics break traffic down per node and per rule, which makes a saturated exit, a misrouted application, or an underused subscription obvious in seconds. One panel watches several gateways at once: add OpenClash backends directly, or install the one-command agent on OpenWrt, Linux, or macOS machines beside remote gateways and let each agent report home. Because agents open the connection outward, gateways behind NAT still report in, and the panel never reaches into your network uninvited. History persists in SQLite by default, and busy networks can dual-write traffic statistics to ClickHouse for larger histories while configuration stays in SQLite. Token-based access control protects the dashboard, dark mode and an installable PWA keep it comfortable on a phone, and the interface switches between English and Chinese. Running on a dedicated VPS on RepoCloud with guaranteed CPU, RAM, and SSD, full root SSH access, and a browser serial console. MIT licensed.
ntopng
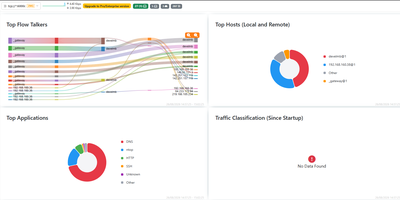
Network traffic stops being a mystery once ntopng names the hosts, applications, and protocols behind every flow, live in your browser. To find the host saturating an uplink, open the dashboard, which ranks top talkers, countries, autonomous systems, and protocols beside historical charts. To see what a suspicious host is contacting, open its page for traffic, ports, DNS queries, TLS details, and visited sites, plus a map of its conversations. Deep packet inspection recognizes applications such as Facebook, YouTube, and BitTorrent, so charts name the app behind the bytes instead of relying on port numbers alone. The console reads packets from a SPAN port or TAP and NetFlow, sFlow, or IPFIX records from routers and switches through nProbe, so it can cover a single switch or many remote sites. Behavioural checks raise alerts for flows, hosts, and interfaces and send them to email, Discord, Telegram, or webhooks. Active monitoring probes remote hosts over ICMP and HTTP/S, and network discovery lists the devices on your local network. A REST API and Lua scripting pull statistics into your own tools and add custom checks. Running on a dedicated VPS on RepoCloud with guaranteed CPU, RAM, and SSD, full root SSH access, and a browser serial console. GPL-3.0 licensed.
Watchtower
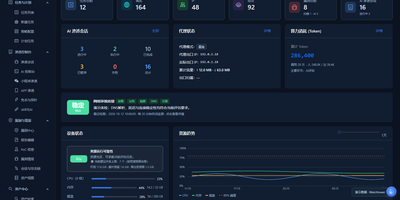
Watchtower puts AI-driven security assessments into one web console, where sessions probe your attack surface while every request, finding, and piece of evidence is captured as it happens. The AI session console follows the attack surface, session progress, tool calls, and findings as an assessment runs, so you can watch an engagement unfold instead of reading a log afterwards. A built-in proxy workflow records HTTP and HTTPS traffic history with highlighted patterns, and any captured request can be sent to the Repeater for editing, replay, and response comparison. Mobile work is covered too: connect phones over USB or wireless, capture app traffic separately from accessibility control, and import WeChat mini-program packages to configure an assessment session. A public vulnerability intelligence library can be searched by component, severity, and source and kept synchronized locally, giving assessments current context without sending your targets anywhere. Findings are managed by source, severity, and status, each linked back to its supporting evidence, and the report editor assembles them with a live preview, impact notes, and remediation guidance. The dashboard tracks assets, tasks, AI sessions, token usage, and runtime resources, and task admission is budgeted against physical memory so heavy scans do not starve the host. Running on a dedicated VPS on RepoCloud with guaranteed CPU, RAM, and SSD, full root SSH access, and a browser serial console. GPL-3.0 licensed.