Coroot
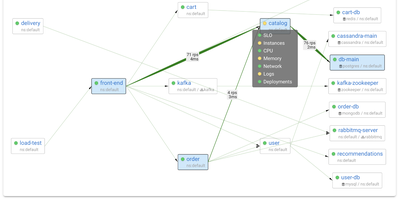
Coroot uses eBPF to capture metrics, distributed traces, logs, and continuous CPU profiles directly from the Linux kernel, delivering full observability without any application code changes, SDKs, or sidecars. From the first minute of deployment, an automatically generated service map covers every microservice, database, message queue, and external dependency with request rate, error rate, and latency measurements. When a service breaches its SLO, AI-powered inspections analyze telemetry across all dimensions to pinpoint the root cause and send a single consolidated alert with findings, replacing the flood of fragmented notifications typical of traditional monitoring. Deployment tracking automatically discovers Kubernetes rollouts and compares each release against the previous one to detect performance regressions, resource spikes, and cost impacts without CI/CD pipeline integration. Continuous profiling captures CPU flame graphs down to the line of code with negligible overhead. Integrated cost monitoring tracks cloud spending across AWS, GCP, and Azure, attributing expenses to individual services and deployments. Coroot supports Prometheus, OpenTelemetry, and ClickHouse as data sources and works identically on Kubernetes clusters, virtual machines, and bare-metal hosts. 7,700+ GitHub stars. Apache-2.0 licensed.

RocketplaneIO
RocketplaneIO is a self-hosted AI SRE platform that gives Kubernetes clusters zero-instrumentation eBPF observability plus a copilot capable of safely diagnosing and fixing issues without your telemetry ever leaving your infrastructure. Point it at any cluster, and an eBPF DaemonSet starts capturing HTTP, gRPC, SQL, Redis, and Kafka spans across every service, including compiled binaries, with cross-service context propagation and no code changes required. The live service map draws itself from actual network traffic, matching technology logos from container images and coloring each node's health from RED metrics. Every log line sits two clicks from its parent distributed trace, and a PromQL query engine, embedded from the real Prometheus evaluator, runs over ClickHouse for long-term metric retention. The complete Kubernetes inventory (Services, Ingress, ConfigMaps, network policies, persistent volumes, CRDs) syncs continuously and is searchable alongside traces and logs. When the copilot identifies a problem, it picks from a catalog of roughly 30 risk-classified safe actions; each action verifies its preconditions, captures a before-state snapshot, executes, checks the result, and rolls back automatically on failure. Disruptive operations pause for explicit human approval before proceeding. An MCP endpoint exposes the identical guardrailed toolbox to external AI agents, so Claude Code or Cursor can operate the cluster through the same safety boundary the browser copilot uses. Complex remediations compose as searchable, forkable Starlark workflows that compile deterministically at save. Running on a dedicated VPS on RepoCloud with guaranteed CPU, RAM, and SSD, full root SSH access, and a browser serial console. Apache-2.0 licensed.