Gladys Assistant
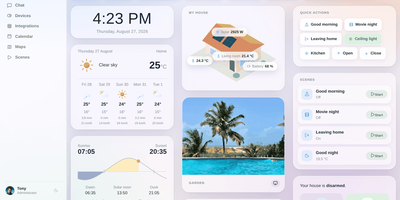
If cloud-dependent smart home hubs and YAML-heavy configuration files leave your household at the mercy of vendor outages and broken scripts, Gladys Assistant puts your entire home under clean, point-and-click local control. Zero YAML required. Pair thousands of lights, thermostats, smart plugs, locks, and sensors directly through native Zigbee2MQTT, Matter, Z-Wave, and MQTT support, or install hundreds of sandboxed community integrations for Philips Hue, Shelly, Sonos, TP-Link Tapo, Netatmo, and Reolink cameras in a single click. Visual scenes make automation effortless. Trigger multi-step routines from motion sensors, sunrise schedules, house presence, calendar events, or electricity tariff changes, and chain conditional actions with delays, HTTP webhooks, and Telegram alerts. Customizable room dashboards display live RTSP camera streams, climate charts, weather forecasts, and interactive dimmer controls. Built-in energy monitoring tracks real-time wattage, historical kWh consumption, and utility contract costs across every circuit. Running on a dedicated VPS on RepoCloud with guaranteed CPU, RAM, and SSD, full root SSH access, and a browser serial console. Apache-2.0 licensed.
Traceway
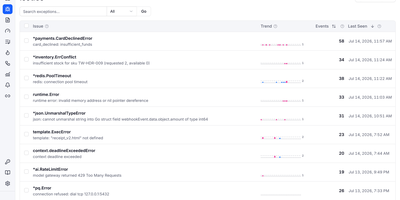
Production debugging slows to a crawl when logs, distributed traces, metrics, and session replays live in four disconnected dashboards, which is why Traceway consolidates every OpenTelemetry signal into a single self-hosted observability platform. Point any standard OTLP exporter directly at the ingestion endpoints without maintaining an intermediary collector or installing proprietary vendor SDKs. When an unhandled exception fires in production, automatic SHA-256 stack trace fingerprinting groups duplicates into prioritized issues complete with source-mapped frames and attached browser or Flutter session replays showing exact user clicks before the crash. Clicking any structured log entry jumps straight to its corresponding distributed span waterfall so engineers can trace slow database queries or failing downstream HTTP calls across microservices. Route performance bottlenecks surface immediately through per-endpoint P50, P95, and P99 latency percentiles ranked by Apdex and a five-factor impact score. Teams shipping AI features can also inspect LLM token consumption, model costs, tool calls, and multi-turn conversations grouped by customer identifier. Built-in on-call rotation schedules, escalation policies, and multi-channel alerts via Slack, Telegram, Pushover, email, and webhooks ensure incidents reach the right responder with one-click acknowledgment links. Running on a dedicated VPS on RepoCloud with guaranteed CPU, RAM, and SSD, full root SSH access, and a browser serial console. MIT licensed.
Circuit Breaker
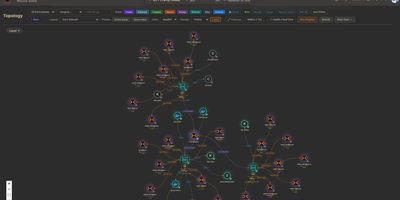
Mapping every physical server, virtual machine, container, and network link across a sprawling homelab into a live interactive canvas, Circuit Breaker gives infrastructure operators real-time topology visualization, IP address management, and rack elevation modeling on a single screen. Operators can switch between hierarchical, concentric, cortex ring, radial, and force-directed graph layouts where animated edges reflect link speeds and color-coded status rings display live hardware health. Automated discovery scans local subnets using nmap, SNMP, and ARP while querying Proxmox VE clusters, TrueNAS storage pools, and UniFi controllers, staging newly detected nodes in a review queue before adding them to the map. For multi-site labs or isolated VLANs, lightweight remote agents connect outbound over Noise-encrypted links after fingerprint approval to report host telemetry and run scoped network scans without opening inbound firewall ports. Rack diagrams let administrators drag servers into U slots with cabling overlays using a built-in catalog covering Dell, HPE, Supermicro, Ubiquiti, MikroTik, Synology, and APC gear alongside live iDRAC, iLO, and UPS metrics. Role-based access control, OIDC single sign-on, TOTP multi-factor authentication, encrypted full-state snapshots, and a SHA-256 hash-chained audit log keep multi-user operations accountable. Running on a dedicated VPS on RepoCloud with guaranteed CPU, RAM, and SSD, full root SSH access, and a browser serial console. MIT licensed.
PeaNUT
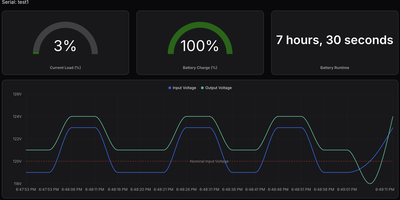
When a power outage hits your server rack, deciphering raw command-line output from Network UPS Tools should not stand between you and a safe shutdown; PeaNUT wraps your NUT servers in a real-time web dashboard that monitors battery charge, load capacity, and voltage telemetry across every uninterruptible power supply on your network. Operators can connect multiple local or remote NUT servers into a single interface and switch between devices with one click. Live gauges track battery percentage, estimated runtime, real power draw in watts, and apparent power in volt-amperes. Interactive line charts plot input and output voltage alongside load fluctuations over time. Need to test a battery or silence an alarm? You can execute instant UPS hardware commands, edit writable device variables, or open a browser-based terminal directly to the underlying NUT daemon without leaving the web interface. Configuration works either through the visual settings panel or a declarative YAML file, protected by built-in account authentication. For broader infrastructure observability, you can stream time-series power data to InfluxDB v2, scrape the native Prometheus metrics endpoint into Grafana, query the REST and WebSocket APIs, or embed live UPS status cards inside Homepage and Glance dashboards. Running on a dedicated VPS on RepoCloud with guaranteed CPU, RAM, and SSD, full root SSH access, and a browser serial console. Apache-2.0 licensed.
Karma
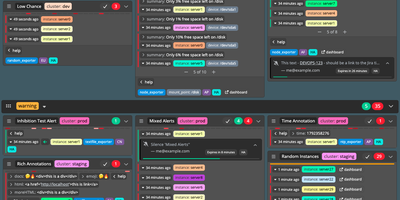
When an alert fires on any of your Prometheus Alertmanagers, Karma shows it once, on one filterable dashboard, and lets you acknowledge or silence it from there. Identical alerts from different servers merge into one entry tagged with every server that saw it, HA pairs included. Groups follow the group_by settings of your Alertmanager routes, and shared labels and annotations collapse into a footer. Multi-grid mode gives each value of a label, or each Alertmanager, cluster, or receiver, its own grid, keeping production and staging apart. Configurable label colors make hosts and severities easy to spot. Optional history draws 24 hourly blocks per group from the Prometheus servers that fired it, and an inhibited alert's muted button lists whatever is suppressing it. One click acknowledges an alert with a short-lived silence, and the separate kthxbye daemon can keep extending it until the alert resolves. The silence modal creates, edits, and expires silences, and ticket IDs in comments can become links. A Dead Man's Switch check raises a visible error when the alerting pipeline goes quiet. Basic auth or a proxy's header identifies each user, silence ACLs stop one team from silencing another's alerts, and read-only mode disables silence management. Default filters open the view your team triages first, and light and dark themes follow the browser. Running on a dedicated VPS on RepoCloud with guaranteed CPU, RAM, and SSD, full root SSH access, and a browser serial console. Apache-2.0 licensed.
Uptrace
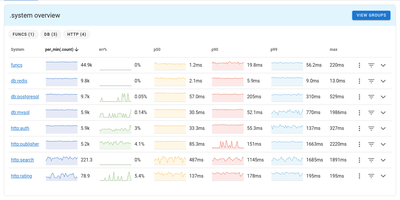
Pinpoint distributed system bottlenecks across polyglot microservices using Uptrace, an open telemetry monitoring platform that correlates traces, metrics, and logs inside a unified diagnostic dashboard. Engineers can track end-to-end request flows across polyglot microservices, inspecting database queries, third-party API calls, and internal function calls with sub-millisecond precision. The platform automatically aggregates spans into high-level latency percentiles, highlighting p50, p90, and p99 bottlenecks while calculating baseline error rates across production deployments. Integrated log correlation links log entries directly to parent trace spans, eliminating the friction of manual search across separate monitoring tools during active outages. You can construct custom dashboard views using a visual query builder, monitor cluster nodes, and map out upstream and downstream service dependencies with interactive topological graphs. Automated alerting channels notify on-call teams via Slack, Telegram, webhooks, or email whenever error budgets or metric thresholds trigger an incident. Running on a dedicated VPS on RepoCloud with guaranteed CPU, RAM, and SSD, full root SSH access, and a browser serial console. AGPL-3.0 licensed.