Opengeni
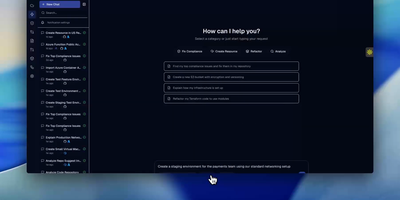
Enterprises requiring production-grade governance for long-running autonomous AI operations can rely on OpenGeni, a self-hosted orchestration platform with human-in-the-loop approvals, Connected Machine execution, and comprehensive audit replays. Operators can configure durable multi-turn workflows that execute continuously toward specified goals without premature termination, automatically pausing when human verification, structured multiple-choice decisions, or critical credential approvals are required. Teams can assign execution workloads across ephemeral cloud sandboxes or route them straight to enrolled Connected Machines to run commands directly against local code repositories without exposing inbound network ports. The integrated web console lets developers inspect live Server-Sent Event activity streams, replay complete turn histories from audit logs, inspect generated artifacts, and cancel or steer in-flight agent tasks on demand. Platform administrators can enforce fine-grained access policies through GitHub App repository bindings, broker temporary role-scoped secrets, and maintain a shared organizational knowledge base where agents propose findings for human review before vector indexing. Running on a dedicated VPS on RepoCloud with guaranteed CPU, RAM, and SSD, full root SSH access, and a browser serial console. Apache-2.0 licensed.
AgentsView
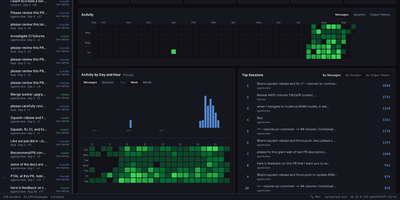
Software developers running Claude Code, Cursor, Codex, and Aider use AgentsView to trace token expenditures, search full session transcripts, and analyze multi-agent concurrency timelines. Engineers can search through historical developer sessions to locate specific code modifications, prompt chains, or debugging rationales across extensive programming workflows. The real-time activity timeline visualizes concurrent agent operations, revealing peak execution windows, task run durations, and automated tool invocations. The usage analytics engine calculates financial costs and token volumes per model by applying live pricing tables while accounting for prompt caching read discounts. Developers inspect granular turn-by-turn session transcripts complete with raw model payloads, file difference diffs, executed shell commands, and syntax errors. The recall browser extracts key technical context from past programming sessions, organizing facts into an indexed reference knowledge corpus for reuse across future project tasks. Administrators can replicate SQLite session tables into DuckDB analytics files or PostgreSQL warehouses to query longitudinal metrics using SQL analytical tools or custom reporting scripts. Running on a dedicated VPS on RepoCloud with guaranteed CPU, RAM, and SSD, full root SSH access, and a browser serial console. MIT licensed.
OpenLIT
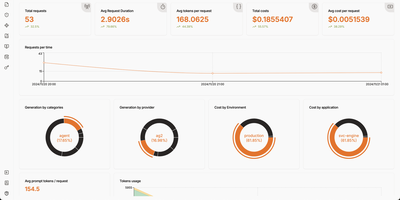
Your AI application is burning through API tokens faster than you can refresh the billing page, and you have no idea which prompt template is responsible. OpenLIT plugs that visibility gap with a self-hosted observability platform built specifically for LLM workloads. Add one line of code to instrument 90+ LLM providers, agent frameworks, and vector databases, then watch every request flow through a tracing dashboard that shows tokens consumed, latency measured, and dollars spent per call, per model, per environment. The requests view lists every LLM interaction with provider, model, cost, and token breakdown in a filterable table, while the trace detail panel lets you drill into individual spans to read the exact prompt sent and response received. Prompt Hub turns prompts into versioned artifacts you deploy, rollback, and A/B test without touching application code. OpenGround compares models side by side on the same input, so you can evaluate cost-versus-quality tradeoffs before committing to a provider. Automated evaluations run LLM-as-a-judge scoring on live production traces, flagging hallucinations, bias, and toxicity in real time. The Vault stores and rotates API keys centrally so secrets stay out of your codebase. Custom dashboards let you build drag-and-drop monitoring views with charts, stat cards, and tables backed by SQL queries against ClickHouse. GPU utilization, memory, temperature, and power metrics feed into the same platform for end-to-end infrastructure visibility. Running on a dedicated VPS on RepoCloud with guaranteed CPU, RAM, and SSD, full root SSH access, and a browser serial console. Apache 2.0 licensed.