Akvorado
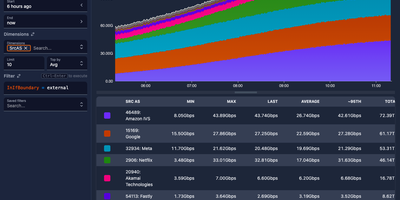
Point your routers at Akvorado and every NetFlow, IPFIX, and sFlow record crossing your network becomes a chart you can interrogate. The web console opens on a live summary of flows per second, exporter count, and traffic split by autonomous system, port, protocol, country, and address family. From there, the visualize page turns stored flows into stacked, line, grid, and heatmap time series, plus Sankey diagrams that show how traffic moves between networks, interfaces, and countries. Filters use a simple SQL-like syntax, so a question like which customers pulled traffic over a transit link last night becomes a query, not a support ticket to your future self. Because the outlet polls each exporter with SNMP or gNMI, flows arrive wearing real interface names, descriptions, and speeds instead of raw ifIndex numbers nobody can read. GeoIP lookups attach country and city to addresses, classification rules tag providers, peers, and connectivity types, and optional BMP sessions add AS paths and BGP communities to every flow. Retention is tiered: raw flows keep full detail for recent days while one-minute, five-minute, and hourly rollups stretch summaries across a year of history. A Grafana plugin is available too, so the same flow data can sit on the dashboards your team already watches. Running on a dedicated VPS on RepoCloud with guaranteed CPU, RAM, and SSD, full root SSH access, and a browser serial console. AGPL-3.0 licensed.
Deploy