Graylog
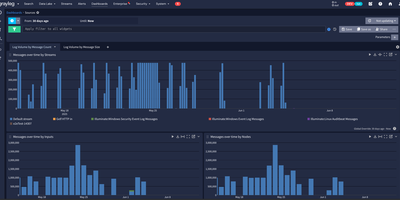
Trusted by over 60,000 organizations worldwide with more than 8,100 GitHub stars since 2010, Graylog has established itself as one of the fastest paths from raw log data to operational visibility, delivering centralized log management, security analytics, and compliance auditing through a purpose-built web interface with sub-second search at scale. The platform ingests logs from virtually any source via syslog, GELF, Beats, raw TCP/UDP, HTTP, CEF, IPFIX, and Netflow protocols, processing each message through configurable pipelines that parse fields, apply transformations, enrich events with GeoIP data from MaxMind or IPinfo lookup tables, and route messages to appropriate streams based on content rules. OpenSearch handles full-text indexing and storage with dynamic shard sizing that automatically calculates appropriate sizes from available node memory, while MongoDB stores configuration metadata including user accounts, roles, dashboards, alert rules, and pipeline definitions. The alerting system integrates with Slack, PagerDuty, and email with customizable notification templates and Replay Search links for immediate investigation context. Version 7.0 introduced MCP server integration for connecting preferred LLMs to perform AI-assisted log analysis and automation, while version 7.1 added Sigma detection rule import from private GitHub, GitLab, and Bitbucket repositories for detection-as-code workflows. The Sidecar agent management system centrally configures and deploys Filebeat, Winlogbeat, and nxlog collectors across infrastructure from the Graylog web interface. Running on a dedicated VPS on RepoCloud with guaranteed CPU, RAM, and SSD, full root SSH access, and a browser serial console. SSPL licensed.
CyberChef
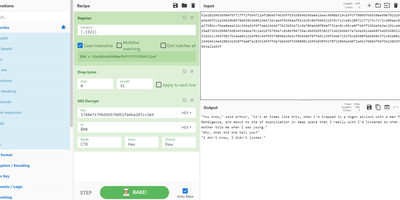
GCHQ open-sourced its "Cyber Swiss Army Knife", and CyberChef became the web app security analysts, incident responders, and CTF players reach for when data needs decoding, decrypting, or dissecting. Its interface is four panes: paste or drag input (files up to 2GB), search a categorized library of hundreds of operations, drag them into a recipe with arguments, and read the output. Operations span Base64, hex, and XOR encoding; AES, DES, and Blowfish encryption; classical ciphers from Caesar to Railfence; hashes and checksums; compression; regex and string extraction of IPs, domains, and URLs; timestamp conversion; and parsers for IPv6, X.509 certificates, and more. Recipes chain arbitrarily - convert from a hexdump then decompress, decrypt AES pulling the IV from the cipher stream, or let the Magic operation auto-detect several layers of nested encoding. Auto Bake re-runs the recipe live as input or arguments change, Step executes one operation at a time for debugging, and flow control (forks, subsections, registers) applies different operations to different parts of the data. Recipes save to files or share as URLs encoding the full pipeline. Crucially, CyberChef is entirely client-side JavaScript - nothing uploads anywhere - and self-hosting guarantees an unmodified copy inside your own network, where malware artifacts belong.
Elmo
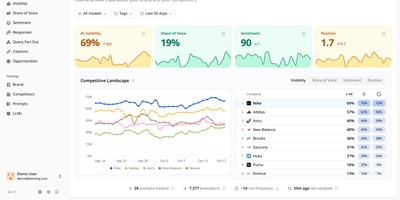
Tracking how ChatGPT, Claude, Gemini, Perplexity, and Google's AI answers talk about your brand, Elmo gives you a self-hosted dashboard for measuring and improving your AI search visibility. A setup wizard reads your website and suggests keywords, competitors, buyer personas, and tracking prompts. Behind the scenes, a worker reruns every tracked prompt on a schedule against the engines you connect, using scraping providers such as BrightData, Oxylabs, or SearchApi for real consumer experiences, or direct OpenAI, Anthropic, Mistral, and OpenRouter APIs. Each run feeds visibility scores per prompt and per model, mention tracking across names, aliases, and domains, sentiment from positive to negative, and each company's position in the answer. The Responses page filters answers by model, tag, prompt, or sentiment and highlights the passage behind each judgment. Citation analysis sorts cited URLs into your domains, competitors, social media, Google properties, and institutional sources. A share-of-voice leaderboard ranks competitors against you over time. Query fan-out shows the web searches engines ran before answering. Opportunities turns the numbers into a prioritized list of content to create, pitch, and seed. Shareable reports reach stakeholders without an account, and a REST API with TypeScript and Python SDKs plus an MCP server lets coding agents query the data. Raw engine output stays in your own database for later audit. Running on a dedicated VPS on RepoCloud with guaranteed CPU, RAM, and SSD, full root SSH access, and a browser serial console. MIT licensed.
MISP
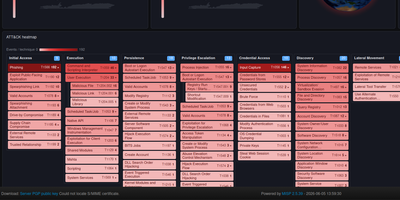
MISP is an open source threat intelligence platform where analysts log indicators and incidents, see how they connect, and share them with trusted organizations. Each case is an event holding attributes and structured objects such as files, network connections, and email messages, with Markdown reports beside the machine-readable data. A correlation engine links events that share values, including fuzzy-hash and CIDR matches, and warning lists flag benign values before they cause false positives. Taxonomies and galaxies tag events with TLP levels, threat actors, malware families, and MITRE ATT&CK techniques. Analysts explore relationships in an event graph and a correlation graph with a timeline, and build drag-and-drop dashboards with maps and ATT&CK heatmaps. Sharing groups control who sees which event, and instances synchronize with partner organizations with distribution settings down to a single attribute. Free-text, URL, bulk, and STIX imports fill the database, and exports reach Suricata, Snort, Zeek, OpenIOC, CSV, STIX 1 and 2, and RPZ zones. A REST API, the PyMISP library, expansion modules, and workflows enrich data and automate publishing. ZeroMQ and Kafka streams announce every change to connected tools. Running on a dedicated VPS on RepoCloud with guaranteed CPU, RAM, and SSD, full root SSH access, and a browser serial console. AGPL-3.0 licensed.
SQL Chat
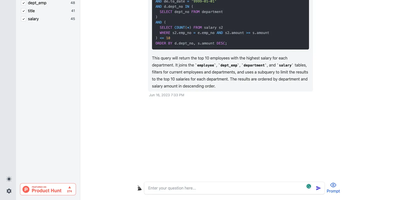
Describe what you want in plain language and get real SQL against your real schema: SQL Chat is an open-source, chat-based SQL client from the Bytebase team. Instead of writing queries in a traditional editor, you connect a database and describe what you want in plain language; the AI reads your schema automatically, generates SQL that references real table and column names, executes it, and returns tabular results in the conversation. Follow-up messages refine the query, so exploration becomes a dialogue - narrow a result set, add a join, change an aggregation - without retyping statements. It supports MySQL, PostgreSQL, SQL Server, TiDB Cloud, and OceanBase from one interface, and covers modification as well as reads: insert, update, and delete operations phrased conversationally. Built with Next.js and TypeScript, it deploys as a single stateless Docker container in single-user mode - connection profiles live in the browser, so there is nothing server-side to maintain. A custom AI endpoint setting routes inference through any OpenAI-compatible API, including self-hosted models, and an optional database-backed mode adds accounts and quotas for offering the tool to a team. MIT-licensed.
Akvorado
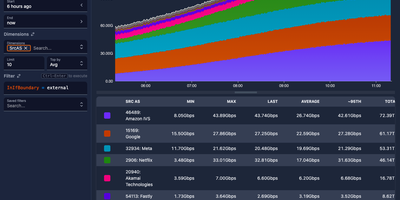
Point your routers at Akvorado and every NetFlow, IPFIX, and sFlow record crossing your network becomes a chart you can interrogate. The web console opens on a live summary of flows per second, exporter count, and traffic split by autonomous system, port, protocol, country, and address family. From there, the visualize page turns stored flows into stacked, line, grid, and heatmap time series, plus Sankey diagrams that show how traffic moves between networks, interfaces, and countries. Filters use a simple SQL-like syntax, so a question like which customers pulled traffic over a transit link last night becomes a query, not a support ticket to your future self. Because the outlet polls each exporter with SNMP or gNMI, flows arrive wearing real interface names, descriptions, and speeds instead of raw ifIndex numbers nobody can read. GeoIP lookups attach country and city to addresses, classification rules tag providers, peers, and connectivity types, and optional BMP sessions add AS paths and BGP communities to every flow. Retention is tiered: raw flows keep full detail for recent days while one-minute, five-minute, and hourly rollups stretch summaries across a year of history. A Grafana plugin is available too, so the same flow data can sit on the dashboards your team already watches. Running on a dedicated VPS on RepoCloud with guaranteed CPU, RAM, and SSD, full root SSH access, and a browser serial console. AGPL-3.0 licensed.
Neko Master
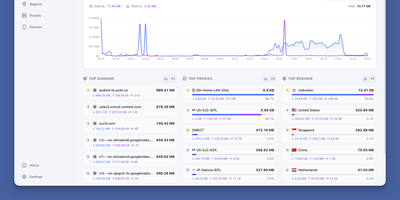
Neko Master watches every connection flowing through your Clash, Mihomo, or Surge gateway and turns the stream into a live map of devices, domains, countries, and proxy nodes, so questions that once needed packet captures get answered at a glance. The dashboard refreshes over WebSocket as traffic moves, charting upload and download trends across thirty minutes, one hour, or a full day. Domain views rank every host your network contacts by traffic and connection count, and IP views add ASN and geographic detail, so an unfamiliar endpoint explains itself instead of raising an alarm. Proxy statistics break traffic down per node and per rule, which makes a saturated exit, a misrouted application, or an underused subscription obvious in seconds. One panel watches several gateways at once: add OpenClash backends directly, or install the one-command agent on OpenWrt, Linux, or macOS machines beside remote gateways and let each agent report home. Because agents open the connection outward, gateways behind NAT still report in, and the panel never reaches into your network uninvited. History persists in SQLite by default, and busy networks can dual-write traffic statistics to ClickHouse for larger histories while configuration stays in SQLite. Token-based access control protects the dashboard, dark mode and an installable PWA keep it comfortable on a phone, and the interface switches between English and Chinese. Running on a dedicated VPS on RepoCloud with guaranteed CPU, RAM, and SSD, full root SSH access, and a browser serial console. MIT licensed.
MiroFish
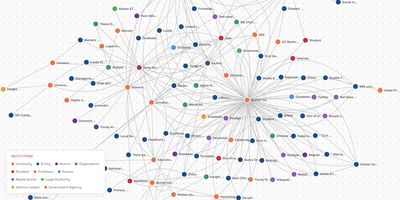
Upload a report, ask a "what if" question in plain language, and MiroFish builds a small simulated society that plays out the answer before you commit to a decision. It reads your seed documents, whether news, policy drafts, financial signals, or a novel, and extracts entities and relationships into a GraphRAG knowledge graph. Entities from the graph become agents with a profession, a biography, and interest tags, and the app estimates simulation rounds from the simulated time span, with a custom mode for shorter runs. Agents post and react on two simulated platforms at once, a feed-style plaza and a topic community, while a live monitor tracks rounds, elapsed simulated time, and actions. A ReportAgent then plans an outline and writes the prediction report section by section with the InsightForge, PanoramaSearch, QuickSearch, and InterviewSubAgent tools. Afterward you can keep questioning the ReportAgent, chat with any individual agent, or send a survey question to a selected group and read their answers. Typical uses include rehearsing public relations responses, testing policy drafts against likely reactions, and exploring alternate endings for a story. The interface switches between English and Chinese, and you bring your own model: any OpenAI SDK compatible LLM endpoint works, Zep Cloud stores agent memory, and the project suggests starting under 40 rounds because runs consume many tokens. Running on a dedicated VPS on RepoCloud with guaranteed CPU, RAM, and SSD, full root SSH access, and a browser serial console. AGPL-3.0 licensed.
DeepWiki
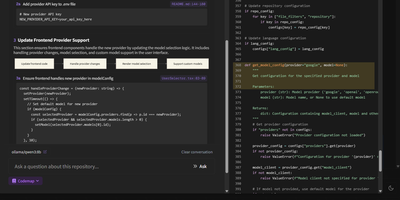
Transform complex code repositories into searchable, interactive wikis with DeepWiki, an automated documentation platform that maps architectural relationships and provides instant answers to technical questions about any codebase. Software engineers can submit public or private repositories from GitHub, GitLab, or Bitbucket to generate comprehensive project overviews, component breakdowns, and interactive Mermaid diagrams illustrating data pipelines and class hierarchies. The built-in Ask interface allows developers to query system logic using retrieval-augmented answers grounded directly in repository source files. Teams can trigger iterative deep research sessions that perform multi-step codebase investigations to explain intricate execution paths, uncover hidden dependencies, and summarize complex algorithms across hundreds of files. Interactive Codemap tours provide guided walkthroughs of critical entry points, letting reviewers inspect synchronized code viewer panels with exact line references while onboarding to unfamiliar services. Developers can export complete wiki structures for offline sharing, customize documentation depth from high-level summaries to granular module analyses, and connect local or cloud model endpoints to process sensitive internal code securely. Running on a dedicated VPS on RepoCloud with guaranteed CPU, RAM, and SSD, full root SSH access, and a browser serial console. MIT licensed.
Rybbit
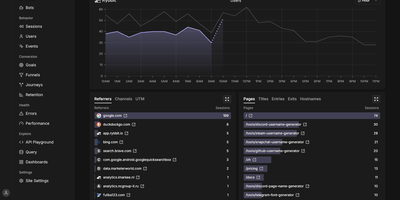
Google Analytics without the cookie banner or the maze of menus: Rybbit puts web and product analytics for every site you run on one readable dashboard, hosted on your own server. Pageviews, sessions, unique users, bounce rate, session duration, traffic sources, campaigns, devices, and countries update in real time beside a live visitor count. Session replay lets you watch the visits behind the numbers, and user profiles tie identified visitors to their sessions and events. Funnels pinpoint where conversions leak, journeys chart the paths people take through a site, retention reports show who comes back, and goals track conversions from page visits, custom events, and autocaptured clicks. Custom events carry JSON properties, filters slice every report across more than 15 dimensions, saved segments reapply them in one click, and location tracking drills from country to region to city on interactive maps, with optional 3D globe views through a Mapbox token. Error tracking connects JavaScript failures to the affected sessions, so a spike in errors leads straight to the visits that explain it. One install serves unlimited sites and organizations with role-based access, public dashboards share a site's stats through a link, and a tracking script of about 11 KB compressed collects data with no cookies and no consent banner. Running on a dedicated VPS on RepoCloud with guaranteed CPU, RAM, and SSD, full root SSH access, and a browser serial console. AGPL-3.0 licensed.
Pug
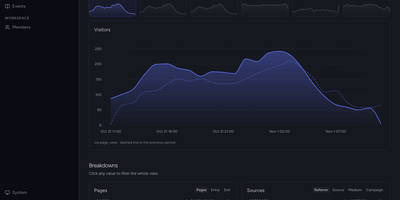
Pageviews tell you someone arrived; Pug is an open-source product analytics platform that shows what people actually did next, across events, funnels, retention, and user flows. Capture events from browser, Android, Flutter, Node, Go, or Ruby SDKs into an ingestion pipeline that enriches each hit with geography, user agent, bot detection, and web attribution automatically. Identify and alias the users behind events, then open a profile to see traits, sessions, and the full activity history of a person. Build insights as trends, funnels, retention cohorts, segmentation, Sankey user flows, and top-K breakdowns, with filters and period-over-period comparison on every chart. A web analytics overview is generated from your events with visitors, sessions, pageviews, bounce rate, and traffic sources, requiring no tile wiring. The live view plots every current visitor on a real-time world map, down to the person and the event they just fired. Compose dashboards from insight and markdown tiles on a time-windowed grid that analysts rearrange without touching ingestion. Erase a person's events and profile on request to satisfy GDPR and DPDP data-subject obligations. Running on a dedicated VPS on RepoCloud with guaranteed CPU, RAM, and SSD, full root SSH access, and a browser serial console. AGPL-3.0 licensed.
SonarQube Community
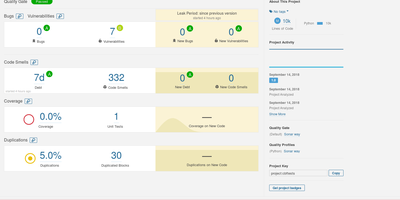
Trusted by over seven million developers worldwide with 310+ contributors and more than 10,600 GitHub stars since 2011, SonarQube has become the industry standard for automated code review and continuous code quality inspection. The platform performs deep static analysis across Java, JavaScript, TypeScript, Python, C#, C++, PHP, Kotlin, Go, Ruby, Swift, and 30+ additional languages, detecting bugs that cause runtime failures, security vulnerabilities exploitable by attackers, security hotspots requiring manual review, code smells degrading maintainability, and code duplications increasing technical debt. Quality Gates define pass-fail thresholds on metrics like coverage, duplications, reliability rating, and security rating, failing CI/CD pipelines when new code introduces issues below organizational standards. Pull request analysis decorates GitHub, GitLab, Bitbucket, and Azure DevOps merge requests with inline issue annotations and overall quality summaries before merging. Built-in quality profiles provide curated rule sets per language following the Sonar Way methodology, with dedicated profiles for AI-generated code that target patterns commonly introduced by agentic coding workflows. Infrastructure-as-Code analysis covers Terraform, Kubernetes, Docker, Ansible, CloudFormation, and Helm charts with supply-chain security rules for CI/CD pipelines. The companion IDE plugin delivers real-time analysis with quick-fix guidance directly in VS Code, IntelliJ, and Eclipse. Running on a dedicated VPS on RepoCloud with guaranteed CPU, RAM, and SSD, full root SSH access, and a browser serial console. LGPL-3.0 licensed.
CaseCite
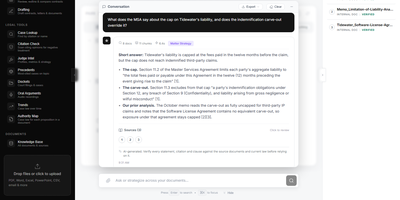
CaseCite puts a law firm's own files under questioning, returning cited answers, contract reviews, and drafted agreements without surrendering a single document to an outside legal platform. Ask a question across the indexed corpus and receive answers tied to the exact source passage, then narrow the search to selected files or a folder when only those should count. For bigger questions, deep research lays out a plan of sub-questions you can edit first, verifies every quote against its source, and keeps a step log of what was searched. Contracts can be analyzed, questioned one at a time, or compared clause by clause across two to four agreements against a baseline, with redlines exported as native Word tracked changes. Tabular review extracts the fields you define from hundreds of contracts at once, shows the supporting passage and estimated cost beside each value, and exports to Excel or CSV. Drafting starts from up to four precedent documents, and long agreements get a section plan for your approval before each section is written and reconciled. Each client engagement lives in its own matter workspace with controlled access and an activity feed, while case lookup, citation checking, judge analytics, dockets, oral arguments, and authority maps cover the caselaw side. Running on a dedicated VPS on RepoCloud with guaranteed CPU, RAM, and SSD, full root SSH access, and a browser serial console. Apache 2.0 licensed.
DB-GPT
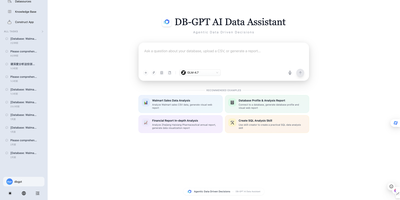
DB-GPT lets a team talk to its data: ask a business question in plain English, and an AI agent plans the work, writes the SQL, runs it, and hands back charts and a written report. Connect MySQL, PostgreSQL, SQL Server, ClickHouse, DuckDB, Doris, StarRocks, or MaxCompute, or drop in CSV and Excel files, including several at once. Every step appears in a live task view with its query, result table, code, and console output, and the agent pauses to ask clarifying questions, with answer options, when the data cannot settle the matter. Reusable skills package proven procedures, including CSV analysis, SQL analysis, and financial report analysis, and a skill creator helps write new ones. Code executes in a sandbox, parallel sub-agents split larger jobs, and an agentic knowledge-base search answers questions over uploaded documents. Scheduled tasks run saved conversations on a cron timetable with on/off switches and execution history, while MCP connectors link tools like Notion, Linear, Tavily, and GitHub. Pick OpenAI, DeepSeek, Qwen, SiliconFlow, Ollama, or vLLM for the model, then use the application and AWEL workflow tools to build data apps of your own. Running on a dedicated VPS on RepoCloud with guaranteed CPU, RAM, and SSD, full root SSH access, and a browser serial console. MIT licensed.
Flowsint
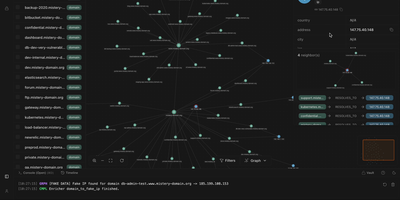
Flowsint turns scattered OSINT leads, like a domain, a username, an email, or a crypto wallet, into one interactive graph that you expand with a right click. Drop an entity on the canvas, run an enricher, and the results appear as new nodes with their relationships already drawn in. Over 30 built-in enrichers cover subdomain discovery, WHOIS and historical records, DNS and ASN lookups, IP geolocation, username searches with Maigret and Sherlock, breach checks for emails and phone numbers, Gravatar profiles, website crawling for contacts and tracking codes, and Ethereum wallet transactions and NFT transfers. Chain enrichers into flows so each output feeds the next step, then replay the same flow on any entity of that type. Missing a source? Write an enricher template in YAML, or describe the API in plain language and let the built-in AI draft it, with API keys kept in an encrypted vault instead of config files. Custom entity types, aliases, tags, JSON import and export, and basic role-based access control make it workable for small teams, and an n8n connector pipes findings into alerts and reports. Double-click the canvas to add items fast, or alt-drag between nodes to link them. Every graph stays on your own server, and no default accounts exist. Running on a dedicated VPS on RepoCloud with guaranteed CPU, RAM, and SSD, full root SSH access, and a browser serial console. Apache-2.0 licensed.
Obsei
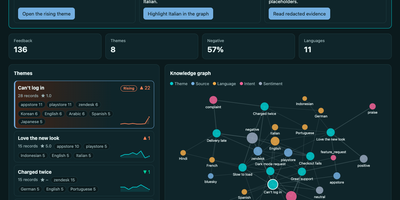
Before any AI model reads a single customer message, Obsei has already stripped out the names, email addresses, card numbers, and ID numbers hiding inside it. Obsei pulls in what customers are saying from App Store and Google Play reviews, Zendesk, Freshdesk, and Intercom tickets, GitHub issues, surveys, YouTube comments, Bluesky, RSS feeds, SQL databases, and even Gong call transcripts. Every record is pseudonymised on the way in and stored in an encrypted database that never phones home. Then the labelling starts: sentiment, intent, language, and your own custom questions, each answered with a confidence score by a zero-shot classifier running locally on your machine, or by an LLM you choose through your own keys. Answers the model is unsure about are escalated to a stronger model or queued for a human instead of being silently wrong. Related complaints roll up into stable themes with week-by-week trends, and anything mentioned by fewer than five people stays hidden, so individuals cannot be picked out of a chart. When a theme spikes, alerts and digests land in Slack, and individual findings can be routed straight into Jira, Linear, or GitHub issues. Your analysts browse it all in the built-in Studio, and your AI agents can ask questions over MCP and get cited, redacted evidence back, with any action they propose waiting for your approval. Running on a dedicated VPS on RepoCloud with guaranteed CPU, RAM, and SSD, full root SSH access, and a browser serial console. Apache-2.0 licensed.
GitNexus
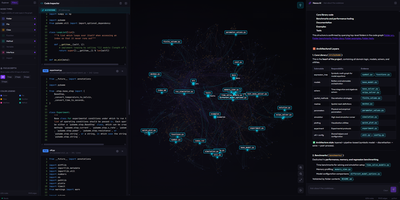
GitNexus turns any codebase into an interactive knowledge graph that maps every dependency, call chain, functional cluster, and execution flow, giving AI coding assistants the deep structural awareness they need to stop breaking things. Drop a repository URL or ZIP file into the browser-based explorer and watch Tree-sitter parsers decompose your code into a navigable property graph you can zoom, click, and query. The MCP server integrates directly with Cursor, Claude Code, Codex, Antigravity, and other editors through 16 specialized tools covering architectural queries, impact analysis, safe multi-file renames, change detection, and cross-repo contract matching. Need to know the blast radius before touching a shared utility? The impact analyzer traces every caller, implementer, and downstream consumer in milliseconds. Teams reviewing pull requests get automated blast-radius annotations powered by the same graph. The registry architecture lets a single MCP server manage multiple indexed repositories simultaneously, so switching between projects requires zero re-indexing. For visual exploration, the web interface renders interactive community-clustered graphs where you can trace execution paths, browse file trees, and chat with an AI agent grounded in the graph's structural data rather than raw file snippets. Everything runs locally; your source code never leaves the machine. Running on a dedicated VPS on RepoCloud with guaranteed CPU, RAM, and SSD, full root SSH access, and a browser serial console. PolyForm Noncommercial 1.0.0 licensed.
Fail2Ban Report
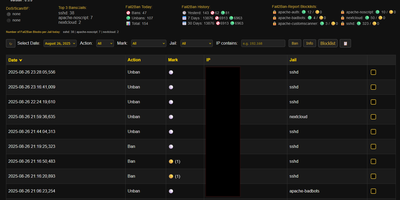
Fail2Ban quietly bans thousands of bots on a typical VPS and just as quietly keeps the whole story buried in a log file nobody reads, and Fail2Ban Report digs that story out into a dashboard you will actually open. Shell scripts convert each day of fail2ban.log into JSON, and the web interface lays every ban and unban on a searchable, filterable timeline you can slice by jail, server, or time window. Aggregated statistics for today, yesterday, seven days, and thirty days show which jails absorb the most attacks, while markers flag repeat offenders and escalating ban counts so persistent scanners stand out from one-time noise. Blocklists live per jail and per server as plain JSON, and ban or unban actions execute through UFW, giving you permanent bans that survive independently of jail restarts. Bulk actions handle whole ranges at once, with a pending state until the next sync applies them. Multiple servers feed one console through a pull-based HTTPS endpoint, so a fleet of small machines reports to a single pane without exposing SSH. Optional AbuseIPDB and IP-Info lookups add reputation and region context to any address. Running on a dedicated VPS on RepoCloud with guaranteed CPU, RAM, and SSD, full root SSH access, and a browser serial console. GPL-3.0 licensed.