
Chatwoot
Unleash the power of Chatwoot, the open-source superhero in the world of customer experience! This platform is perfect for businesses craving to connect with their customers across a multitude of channels without breaking the bank. Wave goodbye to the high-and-mighty likes of Intercom, Zendesk, and Salesforce Service Cloud, and say hello to a wallet-friendly powerhouse. Chatwoot turns your agents into customer service ninjas, armed with the latest in workload management, performance tracking reports that refresh themselves (because who has time for that?), and automations that work smarter, not harder. Zap through conversations with lightning-fast responses and manage your social media and email interactions in a single bound. Plus, with Chatwoot, you get to be the Sherlock of customer satisfaction, deducing your CSAT scores on autopilot. All this hosted on RepoCloud, where the cost is as tiny as the effort you'll need to switch over. Get ready to engage, enlighten, and entertain your customers with Chatwoot!
LightDash
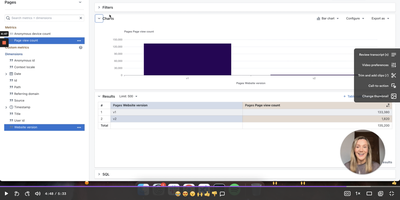
With 5,600+ GitHub stars and deep dbt integration, Lightdash is the open-source Agentic BI platform that treats analytics like software — defining metrics, dimensions, joins, permissions, and caching in a governed context layer that powers dashboards, AI agents, data apps, embedded analytics, and MCP server endpoints simultaneously. The dbt Write-Back feature lets business users create custom metrics and models in the UI, then automatically generates pull requests in GitHub or GitLab so every change flows through code review and CI validation before reaching production. Context-specific AI analysts automatically select relevant models and metrics, build queries, and present insights in plain English, while row-level security, user attributes, and customer-facing permissions ensure data governance at every layer. The platform connects to BigQuery, Snowflake, Redshift, Databricks, PostgreSQL, Trino, and ClickHouse through warehouse adapters, with the TypeScript monorepo built on React, Mantine, Vite, and TanStack Query on the frontend plus Node.js, Express, Knex, and PostgreSQL on the backend. Data teams build analytics with coding agents, preview changes from the CLI, validate in CI pipelines, and review charts and dashboards in pull requests — making the entire analytics lifecycle version-controlled and reproducible. Running on a dedicated VPS on RepoCloud with guaranteed CPU, RAM, and SSD, full root SSH access, and a browser serial console. MIT licensed.

World Monitor
World Monitor replaces twenty or more browser tabs by fusing geopolitical, military, financial, and infrastructure signals onto a single interactive canvas built with TypeScript, Vite, globe.gl with Three.js for the 3D globe, and deck.gl with MapLibre GL for the flat map. World Monitor ingests live data from 530 upstream sources including ACLED and UCDP for conflict events, OpenSky Network for military and civilian aircraft, AISStream for vessel positions, NASA FIRMS for satellite fire detection, USGS for earthquakes, and FRED, IMF, BIS, and Finnhub for macroeconomic and market data. The Country Instability Index v8 computes real-time stress scores across 31 Tier-1 nations, while the finance radar tracks 29 stock exchanges, commodities, and cryptocurrency with a 7-signal market composite. Six specialized dashboard variants — World, Tech, Finance, Commodity, Energy, and Happy — deploy from a single codebase. AI summarization runs locally through Ollama and LM Studio integration or optionally via Groq and OpenRouter cloud providers, with Transformers.js powering browser-side inference. The platform supports 26 languages with native-language feeds and RTL layout, and provides MCP server integration for AI agent connectivity. Running on a dedicated VPS on RepoCloud with guaranteed CPU, RAM, and SSD, full root SSH access, and a browser serial console. AGPL-3.0 licensed.
Elasticsearch
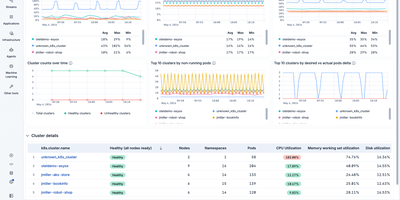
With over 70,000 GitHub stars and billions of documents indexed across enterprises like Uber, Netflix, and Wikipedia, Elasticsearch is the world's most deployed search engine, powering everything from application search to security analytics and AI-driven retrieval. Built on Apache Lucene, its inverted index architecture delivers sub-second full-text search across terabytes of data with BM25 relevance scoring, configurable analyzers for 30+ languages, and fuzzy matching for typo tolerance. The kNN vector search API uses the HNSW algorithm for approximate nearest neighbor queries on dense and sparse embeddings up to 4,096 dimensions, while reciprocal rank fusion enables hybrid search that combines lexical and semantic signals in a single query. Elasticsearch's aggregation framework supports metric, bucket, and pipeline aggregations for real-time analytics directly on indexed data without separate OLAP infrastructure. The cluster distributes data across shards with automatic rebalancing, replica allocation, and cross-cluster search for multi-datacenter deployments. Kibana provides the visualization layer with dashboards, Lens visual editor, Canvas for pixel-perfect reports, and Discover for ad-hoc log exploration. Ingest pipelines with processors like grok, dissect, GeoIP enrichment, and inference handle data transformation at index time, and ES|QL brings pipe-based query syntax with joins and columnar processing. Running on a dedicated VPS on RepoCloud with guaranteed CPU, RAM, and SSD, full root SSH access, and a browser serial console. AGPL v3 licensed.
Swetrix
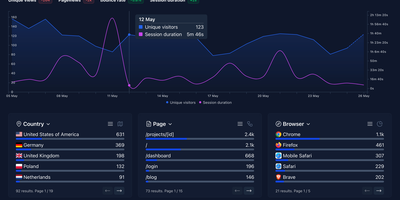
Traffic analytics, real-user performance monitoring, and client-side error tracking - normally three tools - in one cookieless, privacy-first dashboard: Swetrix. The Community Edition ships the same core engine as the cloud product - a NestJS API with ClickHouse for high-volume event storage, MySQL for relational data, and Redis for caching, fronted by a React dashboard and a ~5 KB tracking script with official packages for 20+ frameworks including Next.js, WordPress, and Shopify. Traffic analytics cover pageviews, referrers, UTM campaigns, geolocation, sessions with page flows, funnels, and custom events - all anonymized server-side with no cookies, no cross-device tracking, and no consent banner required for GDPR compliance. Performance monitoring records real-user metrics per pageview: TTFB, DNS and TLS timing, and render times, so regressions surface in the same place as traffic. Error tracking captures unhandled JavaScript exceptions automatically with formatted stack traces, filename/line metadata, affected browsers and pages, first/last-seen timestamps, and a resolve workflow - replacing a separate error monitoring subscription for many teams. Alerts fire to email, Slack, Telegram, Discord, or webhooks on traffic spikes, new errors, and custom events. If Plausible covers your traffic questions but you also want to know why the site broke, Swetrix answers both.
Frappe Insights
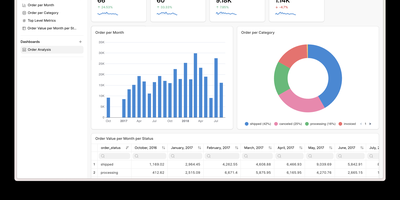
Frappe Insights delivers a self-hosted business intelligence platform where non-technical users build complex analytical queries without writing SQL. The visual query builder uses Ibis under the hood to compose optimized SQL from drag-and-drop column selections, filters, aggregations, and group-by operations — translating point-and-click interactions into performant database queries across MySQL, PostgreSQL, DuckDB, and BigQuery. The join editor provides a graphical interface for defining multi-table relationships, letting analysts connect data across schemas without understanding foreign keys or join types. The chart builder renders interactive visualizations using Apache eCharts with support for bar, line, area, pie, scatter, funnel, and pivot table chart types — each configurable with axes, colors, legends, and formatting options. Dashboards combine multiple charts into shareable views with layout customization, auto-refresh intervals, and filter propagation across widgets. Data source management handles connection pooling across multiple databases simultaneously, enabling cross-database analysis in single queries. Server scripts extend query capabilities with custom Python transformations for complex business logic that visual tools cannot express. Built on the Frappe Framework's full-stack architecture, deployment uses Docker via the official easy-install script that provisions the complete stack including MariaDB, Redis, and Nginx. Running on a dedicated VPS on RepoCloud with guaranteed CPU, RAM, and SSD, full root SSH access, and a browser serial console. AGPL-3.0 licensed.
Netdata
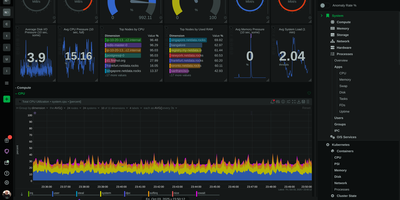
Trusted by millions of engineers and deployed on over 80,000 GitHub stars worth of community confidence, Netdata delivers true real-time monitoring at per-second granularity — 10-60x faster than Prometheus, Datadog, or any conventional monitoring stack that averages away the transient anomalies lasting 2-10 seconds where most production incidents originate. A single installation command deploys the agent with zero configuration, automatically discovering every running process, container, systemd service, network connection, disk, and application on the host within seconds. Unsupervised machine learning trains multiple models per metric directly at the edge, detecting anomalies without thresholds, baselines, or manual tuning. The distributed Parent-Child architecture scales horizontally from a single Raspberry Pi to fleets exceeding 100,000 nodes while maintaining sub-2-second visualization latency and storing metrics at approximately 0.5 bytes per sample through tiered compression. Native network monitoring provides live topology maps, NetFlow and sFlow analytics, SNMP device polling across 200+ profiles, and trap handling — capabilities that typically require a separate NPM product. Hundreds of pre-configured alerts cover systems and applications out of the box, with AI-powered root cause analysis surfacing correlated metrics through natural language via MCP-compatible AI assistants. The agent supports Linux, macOS, FreeBSD, Kubernetes, and Docker with eBPF-based kernel observability requiring no application instrumentation. Running on a dedicated VPS on RepoCloud with guaranteed CPU, RAM, and SSD, full root SSH access, and a browser serial console. GPL v3+ licensed.
PostgreSQL
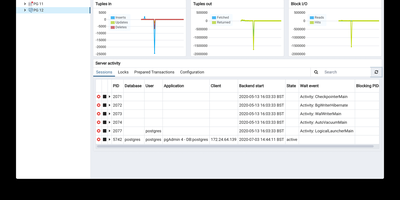
Consistently ranked the most loved and most wanted database in developer surveys, PostgreSQL powers mission-critical workloads at Apple, Instagram, Spotify, and the U.S. Federal Aviation Administration with an architecture refined over nearly four decades since its origins at UC Berkeley. Its native JSONB type stores JSON in an indexed binary format with GIN and GiST index support, enabling document-store capabilities that eliminate the need for a separate NoSQL database in many architectures. The extension ecosystem exceeds 1,000 add-ons: PostGIS provides ISO-compliant geospatial queries, pgvector enables AI embedding similarity search, TimescaleDB adds time-series hypertable compression, and Citus distributes tables across nodes for horizontal scaling. PostgreSQL supports declarative partitioning by range, list, or hash, parallel query execution across multiple CPU cores, and four transaction isolation levels including full Serializable. Streaming replication provides physical standby servers with synchronous or asynchronous modes, while logical replication enables selective table-level change data capture through the Write-Ahead Log. Stored procedures run in PL/pgSQL, PL/Python, PL/Perl, and PL/V8 JavaScript, and advanced indexing includes B-tree, GIN, GiST, SP-GiST, BRIN, and hash types. Full-text search is built in with tsvector and tsquery, and row-level security policies enforce fine-grained access control. Running on a dedicated VPS on RepoCloud with guaranteed CPU, RAM, and SSD, full root SSH access, and a browser serial console. PostgreSQL License (MIT-like permissive) licensed.
Apache Superset
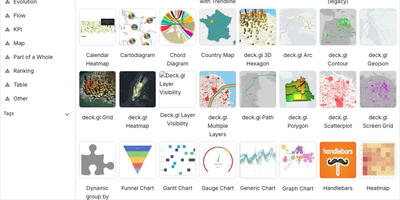
Powering data analytics at companies like Airbnb, Twitter, and Lyft where it originated, Apache Superset has become the leading open-source business intelligence platform with over 65,000 GitHub stars and an Apache Software Foundation top-level project designation. The platform ships with over forty visualization types out of the box including geographic maps, time-series charts, pivot tables, heatmaps, treemaps, and Sankey diagrams, all rendered with Apache ECharts for publication-quality output. Its SQL Lab provides a full-featured IDE experience with syntax highlighting, autocomplete, query history, and result caching for interactive data exploration. Superset connects natively to PostgreSQL, MySQL, ClickHouse, Trino, Presto, BigQuery, Snowflake, Apache Druid, Apache Hive, and dozens more databases through SQLAlchemy connectors, with support for custom database drivers via Python plugins. The semantic layer allows data teams to define calculated columns, metrics, and virtual datasets that business users can query without writing SQL. Role-based access control with row-level security enables fine-grained data governance, while the embedded analytics SDK lets you integrate dashboards directly into external applications via iframes with SSO pass-through. The caching layer supports Redis and Memcached for query result caching, and the asynchronous query execution engine powered by Celery handles long-running queries without blocking the UI. Alerts and reports can be scheduled via email or Slack with PNG or CSV attachments generated from any chart or dashboard. Running on a dedicated VPS on RepoCloud with guaranteed CPU, RAM, and SSD, full root SSH access, and a browser serial console. Apache 2.0 licensed.
InfluxDB
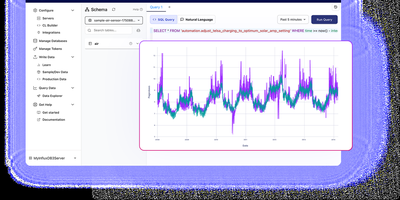
With over 31,600 GitHub stars and thousands of production deployments, InfluxDB 3 Core is the open-source time series database rebuilt in Rust on the FDAP stack — Apache Flight for high-throughput data transfer, DataFusion for vectorized SQL query execution, Arrow for columnar in-memory representation, and Parquet for compressed columnar storage. The engine delivers sub-10ms query response times on recent data and handles millions of writes per second through line protocol ingestion over HTTP, with unlimited tag cardinality eliminating the high-cardinality limitations that plagued earlier InfluxDB versions. The diskless architecture persists data as compressed Parquet files to S3-compatible object storage, Azure Blob, Google Cloud Storage, or local disk with configurable partitioning strategies, while the write-ahead log and in-memory buffer serve real-time queries against recent data before compaction. Native SQL support through DataFusion includes window functions, CTEs, subqueries, and joins, while InfluxQL maintains backward compatibility with existing InfluxDB 1.x and 2.x applications through the same query API. The embedded Python VM enables processing engine plugins and triggers that execute custom logic on write events, perform cross-database queries, and transform data in real time without external tooling. Flight SQL clients provide high-performance query access from Python, Go, Java, and Rust, and the HTTP API supports writes in line protocol format compatible with Telegraf's 300+ input plugins. Running on a dedicated VPS on RepoCloud with guaranteed CPU, RAM, and SSD, full root SSH access, and a browser serial console. MIT/Apache 2.0 dual-licensed.
Mautic
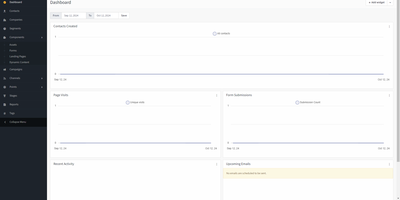
A campaign engine wrapped around a contact database: Mautic, the largest open-source marketing automation platform, replaces HubSpot or Marketo without per-contact pricing. Contacts arrive through forms, landing pages, imports, or the REST API and flow into segments: dynamic filters that update automatically from behavior, custom profile fields, or point scores. Segments decide who qualifies; campaigns decide what happens. The drag-and-drop Campaign Builder composes multi-step workflows from actions, positive/negative decision trees, and conditions (field values, tags, device type, segment membership, point thresholds), with static or relative delays, a Jump-to-Step action for moving contacts between branches, and handoffs that push contacts into CRMs or entirely different campaigns. Messaging covers email, SMS, and web/app push out of the box, with A/B testing and a drag-and-drop email builder; dynamic website content swaps page sections per known contact. Lead scoring assigns points for clicks and visits with decay for inactivity, while stages track funnel position. Native integrations cover Salesforce, HubSpot, Zoho, and Dynamics, plus a full REST API for custom sync. It runs on PHP and MySQL with cron jobs processing campaigns and segment rebuilds - self-hosting keeps your entire contact database and behavioral history under your control.
Ghost
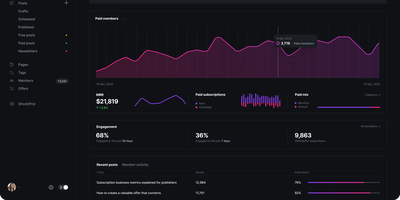
Get ready to transform your audience into a thriving empire with Ghost, the ultimate toolkit for the modern creator on a mission to monetize their mojo. Picture this: a sleek website that screams 'you', bursting with content that captivates, newsletters that fly straight into inboxes, and a subscription service that turns followers into financiers. Wave goodbye to bland and hello to a smorgasbord of stunning, free themes that you can finesse to fit your unique flair. But wait, there's more! Ghost's editor is like the Swiss Army knife for content connoisseurs—slick, sophisticated, and oh-so-simple to use. Unleash your creativity with multimedia storytelling that includes everything but the kitchen sink—galleries, chucklesome gifs, videos, podcasts, you name it. And when it's time to hit 'send', those built-in newsletters make sure your words woo your audience without breaking a sweat. Want to play the mysterious type? Ghost's got you covered with native signup forms that turn casual lurkers into committed members. And because we all love a good sneak peek, Ghost dishes out the deets with analytics that spill the tea on who's loving your work the most. Plus, with tantalizing offers and promotions, you'll have new subscribers flocking like seagulls at a beach picnic. All this, hosted on RepoCloud, where the cost is as tiny as your chances of being bored. So, what are you waiting for? Let's Ghost!
HyperDX
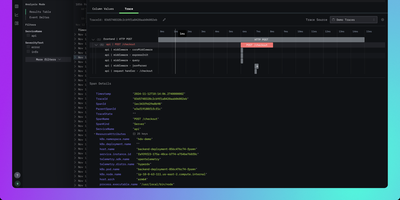
HyperDX correlates logs, metrics, traces, session replays, and errors in a single interface so engineers can resolve production incidents in minutes instead of hours. Nearly 10,000 GitHub stars reflect its role as the integrated UI layer for the ClickStack blueprint endorsed by ClickHouse. The platform connects to any ClickHouse cluster as its storage backend, working with existing table structures without requiring data migration or proprietary ingestion formats. An intuitive Lucene-like search syntax supports full-text queries and property filtering like level:err or service.name:api without needing SQL, while native JSON string querying and event delta analysis surface anomalies in high-cardinality datasets. One-click cross-signal correlation lets you jump from a log line to its distributed trace, from a slow span to associated logs, or from a frontend session replay to the backend errors it triggered. The OpenTelemetry Collector accepts telemetry via OTLP on gRPC port 4317 and HTTP port 4318, supporting automatic instrumentation for Node.js, Python, Java, Go, Ruby, and browser applications. APM tracks HTTP request latency, database query duration, and external service calls with trace waterfall visualizations. Configurable alerts trigger via webhook, Slack, PagerDuty, or email when thresholds are breached. Deploys via Docker Compose with ClickHouse, MongoDB, Redis, and the OpenTelemetry Collector. Running on a dedicated VPS on RepoCloud with guaranteed CPU, RAM, and SSD, full root SSH access, and a browser serial console. MIT licensed.
Papermark
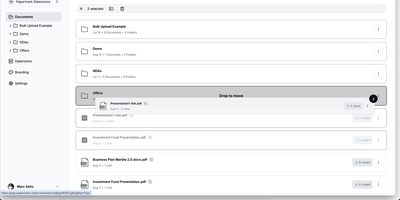
With nearly 9,000 GitHub stars and adoption by over 60,000 companies across 100 countries, Papermark is the open-source DocSend alternative that turns document sharing into a data-rich conversation between you and your viewers. Every shared document generates page-by-page analytics showing exactly which pages capture attention, how long viewers spend on each section, where they drop off, and whether they return for a second look, with real-time notifications the moment a document is opened. Virtual data rooms support unlimited folders with drag-and-drop organization, bulk uploads, granular per-viewer permissions, dynamic watermarking that stamps each page with the viewer's identity, and NDA gating that requires agreement before access. Custom branding applies your logo, colors, and custom domain to every shared link and download page, while email verification and password protection add authentication layers. The AI Data Room Copilot lets viewers chat with uploaded documents, ask questions, and receive contextual summaries directly within the data room interface. The developer platform exposes 43 REST API operations covering data rooms, documents, folders, links, visitors, and analytics, with an MCP server for AI agent integration and a CLI for automation. Built on Next.js with TypeScript, Prisma ORM, PostgreSQL, NextAuth.js authentication, and shadcn/ui components. Running on a dedicated VPS on RepoCloud with guaranteed CPU, RAM, and SSD, full root SSH access, and a browser serial console. AGPLv3 licensed.
Wakapi
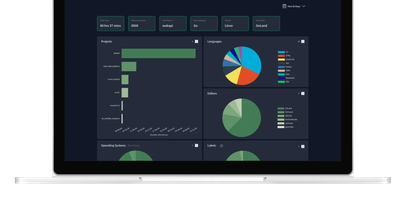
Its author, a student and WakaTime fan, didn't want to pay $9/month for data about his own keystrokes - so Wakapi was born, a self-hosted, WakaTime-compatible backend for coding statistics. The compatibility is the killer design decision: the official WakaTime plugins for VS Code, JetBrains IDEs, Vim, and dozens of other editors work unmodified - just point the plugin's API URL at your Wakapi instance with your personal key, and heartbeats flow to your server instead of a third party's. Duration inference matches WakaTime's own algorithm, with a configurable timeout (10 minutes by default). From that stream Wakapi builds statistics and plots across projects, languages, editors, hosts, and operating systems, plus the fun extras: public leaderboards (optionally login-gated, with configurable aggregation windows), badges for GitHub readmes, and weekly email reports. A REST API serves your data programmatically, Prometheus export feeds your existing Grafana, and a WakaTime relay mode can mirror heartbeats to both services during migration - with one-click import of historical WakaTime data. Written in Go, it is lightning fast and light enough for the smallest instance, storing to SQLite, PostgreSQL, or MySQL, with configurable data retention for GDPR peace of mind. Deliberately smaller than WakaTime, deliberately yours.
DataHub
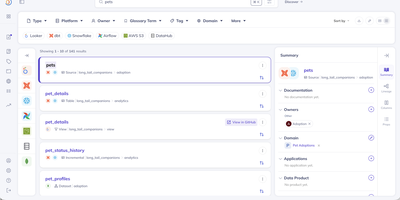
DataHub maps your entire data ecosystem into a searchable, governed catalog where every table, pipeline, dashboard, and metric is discoverable and traceable from source to consumer. Originally built at LinkedIn to manage metadata at hyperscale and proven to handle 10 million+ assets and billions of relationships in production, the platform is now trusted by 3,000+ organizations including Netflix, Visa, Slack, and Pinterest. The Spring Java backend (GMS) exposes both GraphQL and OpenAPI REST endpoints, while the React frontend delivers an intuitive interface for searching, browsing, and governing data assets. The Python-based ingestion framework provides 80+ production-grade connectors extracting deep metadata from Snowflake, BigQuery, Redshift, Databricks, dbt, Airflow, Spark, Kafka, Looker, Tableau, Power BI, Superset, PostgreSQL, MySQL, Hive, Glue, S3, Iceberg, and Unity Catalog through pull-based scheduled crawls and push-based emission via Python and Java SDKs. Automatic table-level and column-level lineage detection uses SQL parsing with 97-99% accuracy, tracing data flows from ingestion pipelines through warehouses to BI dashboards. Real-time metadata streaming via Kafka keeps the catalog continuously synchronized as schemas evolve and pipelines execute. The governance layer provides business glossary management, tag propagation along lineage graphs, domain-based organization, and fine-grained access control policies. DataHub Actions triggers automated responses to metadata changes, enabling notifications, quality checks, and downstream workflows. Elasticsearch powers full-text search with faceted filtering across entities. Running on a dedicated VPS on RepoCloud with guaranteed CPU, RAM, and SSD, full root SSH access, and a browser serial console. Apache 2.0 licensed.
MindsDB
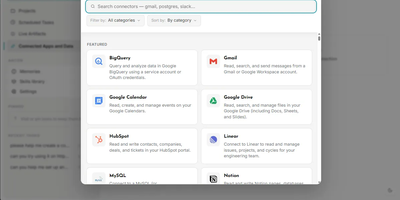
Backed by 39,500+ GitHub stars and over 339 releases, MindsDB delivers the open-source federated query engine that gives AI agents a single SQL interface to read, join, and aggregate across 200+ live data sources without any ETL pipelines or data movement. The Connect-Unify-Respond architecture wires up Postgres, MySQL, MongoDB, Snowflake, BigQuery, ClickHouse, Redshift, Databricks, Salesforce, Shopify, Slack, S3, GCS, Azure Blob, and dozens more through self-contained Python handler packages merged in the open from the community. Knowledge Bases fuse structured tables with vectorized unstructured data from PDFs, emails, support tickets, and documents using hybrid search combining vector similarity with keyword matching for retrieval-augmented generation. Jobs execute queries on configurable schedules refreshing Knowledge Bases nightly or syncing derived tables hourly, while Triggers fire on data changes to automatically vectorize new rows into the appropriate store. The SQL-compatible query language extends standard SQL with constructs for creating models, defining agents, managing workflows, and searching unstructured data. The built-in web editor at port 47334 provides interactive SQL authoring, while the MySQL-compatible API at port 47335 and PostgreSQL API at port 47336 connect any database client directly. An MCP Server integration exposes MindsDB to AI assistants, and the Python SDK enables programmatic access from application code. Docker deployment runs with a single command exposing all APIs immediately. Running on a dedicated VPS on RepoCloud with guaranteed CPU, RAM, and SSD, full root SSH access, and a browser serial console. MIT licensed.
PostHog
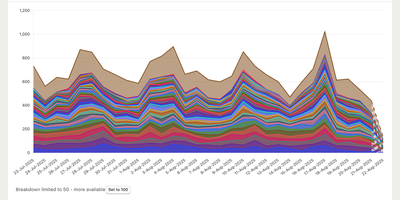
With over 37,000 GitHub stars and used by teams at Y Combinator, Airbus, and Phantom, PostHog replaces an entire stack of paid analytics tools — Mixpanel, Amplitude, Heap, LaunchDarkly, Hotjar, and Google Analytics — with a single open-source platform where every tool shares a common event layer and user context. Product analytics captures events automatically or via manual instrumentation with HogQL (SQL) access for custom queries, while web analytics provides GA-like dashboards for traffic, conversions, and Core Web Vitals. Session replay records user interactions with DOM snapshots and network waterfall analysis, linking directly to errors and feature flag exposures. Feature flags safely roll out changes to specific cohorts with multivariate support and instant rollback, while experiments run A/B tests with automatic Bayesian significance calculations and revenue attribution. Error tracking captures stack traces linked to session replays and user properties for immediate reproduction context. AI observability monitors LLM generations, traces, token usage, latency, and costs across model versions. The managed data warehouse syncs 120+ external sources including Stripe, Postgres, Salesforce, and HubSpot alongside product events, queryable through a unified SQL editor. An MCP server enables AI agents in Cursor, Claude Code, or VS Code to query analytics and execute SQL directly. Running on a dedicated VPS on RepoCloud with guaranteed CPU, RAM, and SSD, full root SSH access, and a browser serial console. MIT licensed.