Grafana
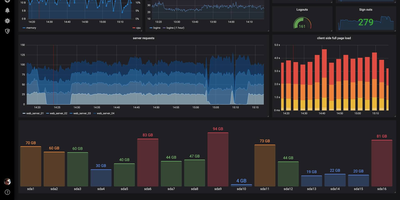
The de facto dashboard of observability: Grafana is the open-source frontend that turns the data stores you already run into interactive graphs. It does not store metrics itself; it connects to the data stores you already run and turns their contents into interactive dashboards. Supported sources number over 150 via plugins: Prometheus, Loki, Tempo, InfluxDB, Elasticsearch, MySQL, PostgreSQL, Microsoft SQL Server, AWS CloudWatch, Azure Monitor, Google Cloud Monitoring, and many more. Dashboards are built from a large library of panel types (time series, heatmaps, tables, gauges, logs) with template variables for reusable, parameterized views. Unified alerting evaluates rules against any connected data source, not just Prometheus, and routes notifications to Slack, PagerDuty, email, and other channels with grouping and silencing - unlike Prometheus Alertmanager, a single rule can combine a Loki log pattern, a PostgreSQL query result, and a CloudWatch metric. Dashboards serialize to JSON and data sources configure via provisioning files, so the entire observability setup can live in Git and deploy repeatably across environments. Explore mode adds ad-hoc querying outside dashboards, with split view for correlating a metric spike against the matching log lines, and access control spans organizations, teams, folder permissions, and OAuth, LDAP, and SAML integration. Written in Go and TypeScript, AGPL-licensed. Self-hosting gives you unlimited users, dashboards, and queries at flat hosting cost, without Grafana Cloud's usage-based pricing.
GoAccess
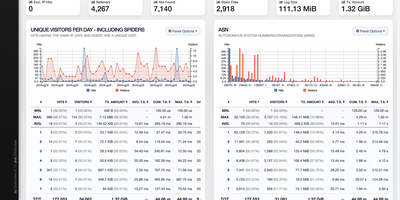
GoAccess processes millions of web log entries in seconds and renders the results as interactive dashboards that update every 200 milliseconds in the terminal or every second via WebSocket-connected HTML reports. Written entirely in C with only ncurses as a dependency, it achieves exceptional performance even on resource-constrained servers, reducing memory usage by approximately 20% and parsing time by 35% in recent releases through optimized in-memory hash tables with on-disk persistence support. The analyzer parses virtually every web log format out of the box (Apache Combined and Common, Nginx, Amazon CloudFront, Amazon S3, AWS Elastic Load Balancing, Google Cloud Storage, Squid, W3C IIS, Caddy JSON, and Traefik) while supporting fully custom log format strings for non-standard configurations. The self-contained HTML dashboard displays 15+ interactive panels covering unique visitors, requested files, static files, 404 errors, referring sites, search keyphrases, geographic location with city-level GeoIP resolution, operating systems, browsers, HTTP status codes, time distribution, and virtual host metrics. WebSocket authentication via JWT provides secure remote access, and incremental log processing ensures data continuity across daemon restarts. Docker deployment requires a single command with volume-mapped access logs. Over 20,800 stars with active development since 2010. Running on a dedicated VPS on RepoCloud with guaranteed CPU, RAM, and SSD, full root SSH access, and a browser serial console. MIT licensed.
Redash
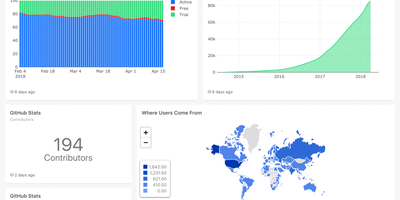
Used by millions of users at thousands of organizations worldwide and holding 29,000+ GitHub stars, Redash is the most established open-source SQL-first business intelligence tool — enabling anyone from analysts to executives to query databases, visualize results, and share dashboards without writing a single line of application code. The browser-based query editor supports SQL and NoSQL with schema browsing, auto-complete, query snippets, and parameterized queries that turn static reports into interactive data applications. Native connectors span 35+ data sources including PostgreSQL, MySQL, Amazon Redshift, Google BigQuery, Snowflake, ClickHouse, MongoDB, Elasticsearch, Databricks, Apache Presto, Microsoft SQL Server, and REST APIs — with an extensible data source API for custom integrations. Visualization types cover line, bar, area, pie, scatter, box plot, funnel, cohort, sankey, sunburst, choropleth map, and pivot tables, all draggable onto shared dashboards with cross-filtering parameters. Scheduled refreshes automatically update query results at configurable intervals, while threshold-based alerts notify teams via email, Slack, or webhook when metrics cross defined boundaries. SAML and Google OAuth SSO integration, role-based access control, API key management, and query-level permissions ensure enterprise-grade security for sensitive datasets. The self-hosted stack deploys via Docker Compose with PostgreSQL for metadata storage, Redis for job queuing, and Celery workers for background task execution. Running on a dedicated VPS on RepoCloud with guaranteed CPU, RAM, and SSD, full root SSH access, and a browser serial console. BSD 2-Clause licensed.
Bloomberg Terminal
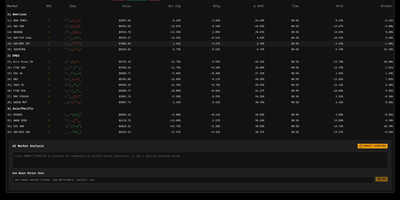
With 1,450+ GitHub stars and a live demo on Vercel, this Bloomberg Terminal clone delivers a professional-grade financial dashboard without the $24,000 annual seat license. The Next.js 15 App Router with React 19 and TypeScript serves a single-page terminal interface optimized for constantly mutating financial data, with partial pre-rendering enabling sub-500ms initial loads even on data-heavy views. Upstash Redis caches AlphaVantage market data to minimize API calls while maintaining sub-second update latency through React Query polling with configurable refresh rates. OpenAI integration provides AI-powered market insights, sentiment analysis, and trend interpretation directly within the terminal interface. Multiple specialized views cover market data tables with bid/ask spreads, financial news aggregation with category filtering, market movers highlighting top gainers and losers, and volatility analysis with historical comparison charts. Jotai atoms manage local state for watchlists, layout preferences, and terminal sessions while React Query handles server-state synchronization with aggressive stale-while-revalidate caching. The shadcn/ui component library with Tailwind CSS delivers accessible, keyboard-navigable interface elements styled after Bloomberg's iconic dark terminal aesthetic. Security features include origin restriction, rate limiting via Redis, and Zod-based input validation on all API routes. Motion (formerly Framer Motion) animates transitions between views and data updates without layout shift. Running on a dedicated VPS on RepoCloud with guaranteed CPU, RAM, and SSD, full root SSH access, and a browser serial console. MIT licensed.
Heimdall
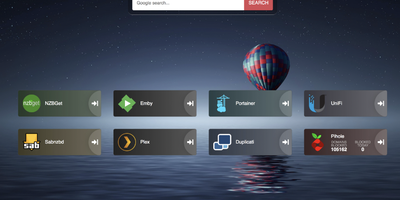
Links stop drowning in browser bookmarks once Heimdall - the application dashboard from the LinuxServer.io team - gives every web app and service you run a single, organized front door. Items come in three tiers. Generic items link to anything on the web with a name, color, and optional icon. Foundation apps are recognized as you type, auto-filling the application's icon and tile color so a full homelab dashboard assembles in minutes. Enhanced apps go further: supply API credentials and the tile shows live data - queue size and download speed for SABnzbd and NZBGet, plus integrations for Sonarr, Radarr, Plex, Jellyfin, Pi-hole, Portainer, Transmission, and many more. There are no iframes and no apps-within-apps; tiles are honest links with real-time stats layered on. Tiles arrange by drag and drop, backgrounds are customizable, an optional search bar (Google, Bing, or DuckDuckGo) makes it work as a browser start page, and optional multi-user authentication keeps dashboards personal. Built on Laravel with SQLite file-based storage - no external database - it stays light, responsive on mobile, and simple to back up. A natural first deployment: the page that ties every other self-hosted service together.
Briefer
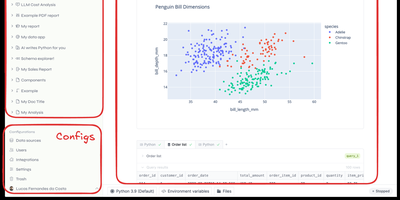
Backed by Y Combinator with 4,300 GitHub stars and growing rapidly since its September 2024 launch, Briefer delivers the first truly unified notebook-and-dashboard platform that eliminates the fragmented workflow of juggling Jupyter for analysis, Tableau for visualization, and Notion for documentation — combining all three in a single Notion-like workspace where SQL query results automatically become Python DataFrames accessible in subsequent code blocks. The built-in AI analyst understands your database schema and notebook context to generate SQL queries, write Python transformations, create visualizations, and fix errors on demand using configurable OpenAI or private LLM backends. Connect directly to PostgreSQL, MySQL, BigQuery, Redshift, Snowflake, and Amazon Athena as data sources, or upload CSV files for immediate analysis. Native point-and-click visualizations produce charts, tables, and dashboards without writing code, while interactive data apps use inputs, dropdowns, and date pickers to create parameterized reports for non-technical stakeholders. Scheduled execution runs notebooks and dashboards periodically with results delivered via Slack integration or public shareable links. Write-back queries modify production data directly from notebooks for ad-hoc pipeline testing. The architecture runs as three Docker containers — web frontend, API server, and optional AI service — backed by PostgreSQL and a Jupyter server for Python execution, deployable via single Docker command, Docker Compose, or Helm charts for Kubernetes. Running on a dedicated VPS on RepoCloud with guaranteed CPU, RAM, and SSD, full root SSH access, and a browser serial console. AGPLv3 licensed.
Flame
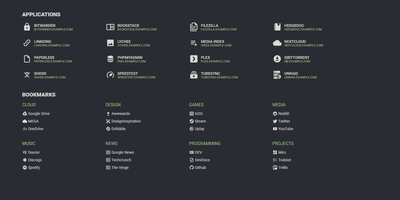
A server full of scattered services becomes one clean application hub under Flame - a self-hosted startpage where every bit of configuration happens in built-in GUI editors, never a config file. Applications and bookmarks are created, edited, and organized into categories directly in the browser, and favorites pin to the homescreen for one-click access. The integrated search bar filters your apps and bookmarks locally as you type, and prefix shortcuts (like /g for Google) route queries to any of 11 web search providers or custom ones you define, making Flame a genuine browser homepage rather than a static link wall. Docker integration is the standout for homelabs: mount the Docker socket, add flame.type, flame.name, and flame.url labels to containers, and new services appear on the dashboard automatically - Kubernetes Ingress annotations work the same way. A weather widget shows temperature, cloud coverage, and animated conditions for your coordinates, and password authentication protects settings and items. Appearance is deeply customizable with 15 built-in color themes, a custom theme builder, and full custom CSS support. The stack is Node.js with SQLite behind a React frontend - light, fast, and inspired by the minimalist SUI design.
Homarr
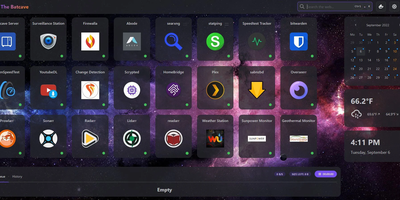
A single pane of glass for every service you run, arranged by drag-and-drop with no YAML or JSON files: Homarr is the modern dashboard for self-hosted infrastructure. Its grid system arranges apps, widgets, and bookmarks on desktop or touch, backed by an icon picker with over 11,000 icons. What separates Homarr from static launchers is 50+ live integrations: Plex, Jellyfin, and Emby media stats, the *arr suite (Sonarr, Radarr) with a unified release calendar, download clients, Pi-hole and AdGuard Home controls, Proxmox, Home Assistant, OPNsense, and Unifi monitoring. Widgets update in real time over WebSockets (tRPC and Redis under the hood), and a built-in search queries thousands of data points across connected services. Custom widgets extend the reach to any HTTP API without code: define endpoint, auth, and refresh interval in the management UI, then render responses as stat grids, tables, progress bars, status indicators, action buttons, or full custom JSX layouts - with an AI-prompt helper for generating templates. Multi-user support is first-class: credentials, OIDC, or LDAP sign-on, groups with granular permissions, and secrets encrypted with AES-256-CBC. A robust background-job system scales it from a Raspberry Pi homelab to deployments serving hundreds of users.
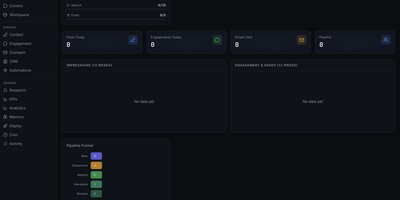
Marketing Dashboard
This is a marketing operations control center that replaces fragmented CRM, outreach, content, and analytics tools with a unified self-hosted interface designed for AI agent-assisted go-to-market teams. The CRM module manages leads through a configurable pipeline funnel with stages from New through Sequenced, Replied, Interested, and Booked, tracking source attribution, industry segments, company size, lead quality scores, and LinkedIn URLs per contact. Outreach sequencing supports email campaigns with pause controls, audit endpoints, suppression workflows, and engagement tracking. The content operations surface provides calendar views, content item management, performance metrics, and approval queues for editorial control. Analytics and KPI dashboards show impressions, engagement, and send volumes over configurable time periods, with optional connectors to Plausible, Google Analytics 4, X, and LinkedIn for cross-platform reporting. The OpenClaw-native agent runtime enables dynamic agent and squad discovery, workspace management, session monitoring, and communications surfaces. Automation scheduling uses cron job templates with OpenClaw-compatible schedule variants including cron expressions, every intervals, and at timestamps. The tech stack combines Next.js 16 App Router with React 19, Tailwind CSS 4, Recharts, and Zustand for state management. Authentication supports session cookies, API keys, and optional Google OAuth with role-based access controls. All state persists locally in SQLite via better-sqlite3 with no required external infrastructure. On RepoCloud, deploy Marketing Dashboard on a dedicated VPS with persistent SQLite storage, root SSH access, and complete control over your marketing operations data, all under the MIT license.
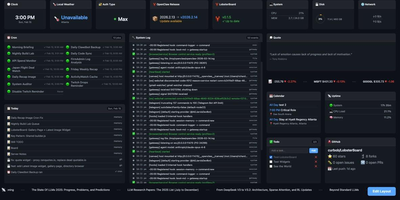
LobsterBoard
LobsterBoard lets you assemble custom monitoring dashboards from 50 pre-built widgets using a visual drag-and-drop editor, covering everything from CPU and memory gauges to AI subscription trackers, stock tickers, and camera feeds on your own server with zero cloud dependencies. The snap-grid editor handles layout composition with resize handles and a property panel, so you drag widgets onto a canvas, configure their data sources, and the dashboard is live. Real-time system statistics flow through Server-Sent Events, updating CPU load, memory pressure, disk usage, network throughput, and Docker container status without page refreshes. Five built-in themes range from a dark default to a retro CRT terminal aesthetic, a warm sepia paper look, and pastel options for different display environments. The template gallery lets you export complete dashboard layouts with auto-captured screenshot previews, share them with other users, and import configurations as a full replacement or selective merge. Custom pages extend beyond dashboards into notes, kanban boards, or any free-form layout you need. Built-in widgets connect to iCal feeds for calendar events, RSS sources for news aggregation, weather APIs for local conditions, and financial data providers for cryptocurrency and stock prices. The whole system runs from a single server.cjs file with zero cloud dependencies or external frameworks. Running on a dedicated VPS on RepoCloud with guaranteed CPU, RAM, and SSD, full root SSH access, and a browser serial console. BSL-1.1 licensed (free for non-commercial use; converts to MIT in 2030).
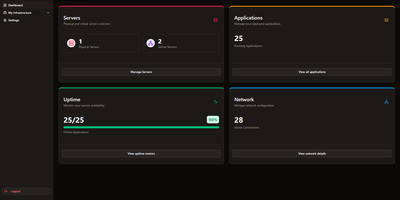
CoreObs
CoreObs delivers a unified self-hosted dashboard that replaces the typical combination of Uptime Kuma, Homer, and separate monitoring tools with a single interface for managing your entire server infrastructure. The Next.js frontend with shadcn components provides a modern dark-themed UI displaying server hardware metrics collected by a lightweight Go agent that leverages Glances for hardware abstraction — streaming real-time per-core CPU load, RAM utilization, NVIDIA GPU statistics, disk usage, system uptime, and load averages via WebSocket connections. The application registry tracks all self-hosted services with configurable uptime monitoring, availability history charts, and instant notifications through Discord, Telegram, Pushover, and email when services go down or recover. Quick-access links provide one-click navigation to each application's management panel directly from the dashboard. The network visualization module built on React Flow enables creating visual topology maps of your infrastructure with drag-and-drop nodes representing servers, switches, and services connected by labeled edges. Server data can be organized with tags, copied between entries, and monitored with configurable pagination and compact view modes. Deploy via Docker Compose with three containers — the Next.js web interface, the Go monitoring agent, and PostgreSQL 17 for persistent storage. Running on a dedicated VPS on RepoCloud with guaranteed CPU, RAM, and SSD, full root SSH access, and a browser serial console. MIT licensed.
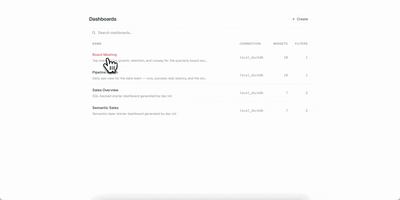
DAC
Your dashboards deserve version control, code review, and reproducible builds, just like the rest of your stack. DAC lets you define interactive data dashboards in YAML or TSX, validate them in CI, and serve them from a single Go binary that embeds a full React frontend. Choose from 21 chart types including line, bar, area, pie, scatter, bubble, funnel, sankey, heatmap, calendar, sparkline, waterfall, gauge, treemap, radar, and candlestick, plus metric cards, data tables, text blocks, and image widgets. The built-in semantic layer lets you define metrics and dimensions once in reusable model files, then reference them from any widget while DAC generates the SQL automatically. Connect to Postgres, MySQL, Snowflake, BigQuery, Redshift, Databricks, and DuckDB through standard Bruin connection configs. Interactive filters with date pickers, dropdowns, multiselects, and search inputs inject values via Jinja templating and re-execute only affected widgets. Live reload via Server-Sent Events refreshes connected browsers instantly when you save a file. Export dashboards as self-contained static HTML with baked-in query results for S3, GitHub Pages, or offline sharing, and render slide decks via the Google Slides export command. On RepoCloud, deploy DAC on a dedicated VPS with root SSH access and persistent storage for your dashboard definitions and database connections under the AGPL-3.0 license.
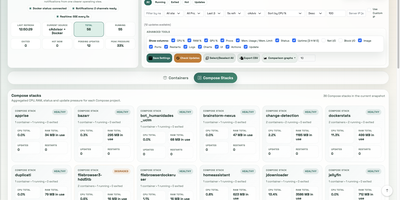
Statainer
Monitoring and safeguarding Docker infrastructure without heavy enterprise software overhead is the primary mission of Statainer, an open-source management control center for container hosts. System operators inspect live CPU loads, memory consumption, network throughput, and disk I/O metrics across individual containers or comparative top-ranking charts. The interface groups containers by Compose projects, enabling administrators to start, stop, or restart entire application stacks and inspect real-time log streams without opening SSH sessions. The built-in Update Manager detects available image tags, executes single-click container updates, and maintains persistent deployment history with automated rollback capabilities for failed recreations. Custom alert configurations trigger instant notifications to Telegram, Discord, Slack, Pushover, or generic webhook endpoints whenever resource thresholds are breached or container health states change. Developers can provision scoped API keys with token authentication to automate container state transitions and export performance telemetry into custom monitoring workflows. Running on a dedicated VPS on RepoCloud with guaranteed CPU, RAM, and SSD, full root SSH access, and a browser serial console. MIT licensed.
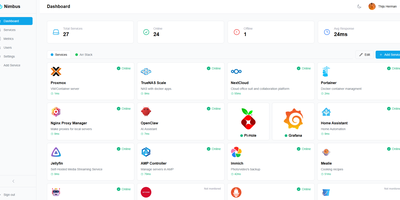
Nimbus
Nimbus is a self-hosted homelab dashboard that turns your scattered pile of services into a polished, organized command center with real-time health monitoring for every endpoint you care about. The dashboard displays live status cards for each registered service, tracking response times down to the millisecond and graphing uptime history so you can spot degradation before it becomes an outage. Health checks run on configurable intervals with smart self-signed certificate handling, meaning your internal services with self-issued TLS do not trigger false alarms. Multi-user support comes standard: local accounts authenticate via JWT, while OAuth2 integration with Google, GitHub, and Discord lets team members sign in with existing credentials. Role-based access control and a built-in admin panel give you granular authority over who sees what. Each user personalizes their view with custom backgrounds, light or dark mode, accent color themes, and drag-and-drop service tile arrangement. Services group into named categories and cards resize to fit your preferred layout, with both grid and list view modes available. Prometheus metrics export feeds your existing Grafana stack, and webhook notifications alert you instantly when a service goes offline. Custom service icons upload directly or auto-fetch from the Dashboard Icons collection. Zero-config Docker deployment gets you running in under 30 seconds with a single docker-compose command. Running on a dedicated VPS on RepoCloud with guaranteed CPU, RAM, and SSD, full root SSH access, and a browser serial console. AGPL-3.0 licensed.
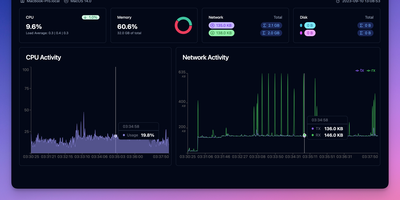
ServerBee
ServerBee delivers complete fleet monitoring from a single Rust binary that embeds both the server and web UI, requiring no external database or heavy runtime. Lightweight agents installed on each node stream CPU, memory, disk, network, load, temperature, GPU, and disk I/O metrics over persistent WebSocket connections to a central server backed by embedded SQLite. The real-time React dashboard presents 17 drag-and-drop widget types across custom layouts, with historical charts spanning one hour to 30 days and monthly traffic statistics with billing-cycle prediction and cost insights including burn rate and per-resource unit cost scoring. Network monitoring covers ICMP, TCP, and HTTP ping probes, service monitors for SSL certificates, DNS records, HTTP keyword matching, TCP ports, and WHOIS expiration, plus network-quality probing across 96 China 3-ISP and international presets with IP-quality and streaming-unlock detection. Remote management features include a web terminal with sandboxed file manager, Docker container stats with logs and events, firewall configuration, and agent auto-update capabilities. Public status pages display 90-day uptime timelines, while alerting supports email and webhook notifications with flexible trigger expressions. A native iOS companion app provides mobile monitoring access. Deploy via Docker or download the single binary for Linux, macOS, or Windows, running on a dedicated VPS on RepoCloud with guaranteed CPU, RAM, and SSD, full root SSH access, and a browser serial console. AGPL-3.0 licensed.
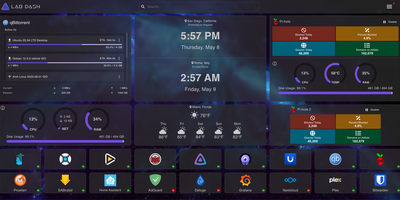
Lab Dash
Every homelab deserves a control center that looks as good as the services it manages. Lab Dash gives you a customizable, drag-and-drop dashboard where every tile earns its spot. Add shortcut widgets linking to your Plex, Grafana, Nextcloud, or any service with automatic health check indicators showing green or red status at a glance. The system monitoring widget displays real-time CPU usage, memory consumption, network throughput, disk utilization, and temperature readings by mounting the host /sys directory as a read-only volume. Integrate Pi-hole stats, qBittorrent download progress, and media server widgets for Jellyfin, Plex, or Emby directly on your grid. Multiple pages let you organize services by category, and the search bar finds any tile instantly. Customize the background image from a local upload or URL, set a custom title and tab name, and choose your preferred search provider including self-hosted options like SearXNG. All sensitive configuration data is encrypted locally with AES-256-CBC, and only administrator accounts can modify the layout. Install Lab Dash as a Progressive Web App on desktop, phone, or tablet for a native app experience with offline capability. Configurations export as backup files for easy migration between instances. On RepoCloud, deploy Lab Dash on a dedicated VPS with root SSH access and Docker socket connectivity under the GPL-3.0 license.
PayMe
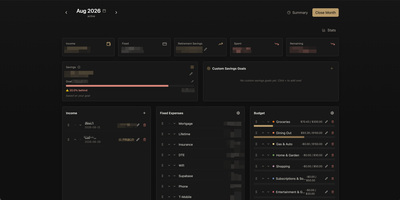
PayMe is a privacy-first personal finance dashboard that runs entirely on your own hardware with zero third-party service dependencies. The Rust backend compiled to a single binary serves a React 19 frontend built with Vite, TypeScript, and Tailwind CSS 4, storing all financial data in a local SQLite database that auto-migrates on startup. Monthly dashboards track income entries, fixed expenses like mortgage and utilities, and budget categories with real-time progress bars showing spending against configurable limits. The savings module includes goal tracking with percentage-based progress indicators, custom savings goals for targeted objectives, retirement savings projections with breakdown analysis, and projected savings calculations. Variance analysis compares actual spending against budgets across categories. Drag-and-drop reordering powered by dnd-kit lets you arrange income sources, expenses, and budget items to match your workflow. The interactive charts rendered by Recharts visualize spending trends, income patterns, and savings trajectories. Month-by-month navigation tracks financial history over time, while the Summary and Stats views aggregate data across periods. JWT-based authentication secures access, and the full OpenAPI Swagger documentation at the /swagger-ui endpoint exposes every API route for automation and integration. Docker Compose deployment creates a minimal image with the compiled Rust binary and static frontend assets, running on port 3001 behind nginx, Caddy, or Traefik reverse proxy with HTTPS. On RepoCloud, deploy PayMe on a dedicated VPS with persistent SQLite storage, root SSH access, and complete privacy over your household financial data, all under the MIT license.
Hiccup
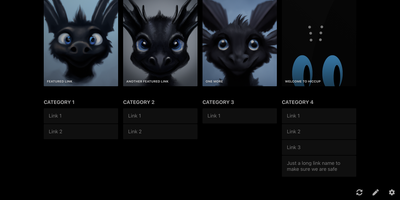
"Get to your most important links, FAST" - Hiccup's README states its whole mission in that one line, and the static start page delivers it. It is a client-side React single-page app - no backend, no database, no accounts - driven entirely by a config.json that defines featured link cards, categorized sections, and search providers. The search bar is the power feature: it queries your own links by name, URL, and tag while simultaneously offering external providers like Google, DuckDuckGo, and Amazon (plus custom URL-template providers you define), with arrow-key navigation and Enter to launch, so muscle memory replaces mousing. Editing happens in the browser - drag and drop links and background images, tweak cards in edit mode - with changes persisting to localStorage; a built-in config manager exports the JSON for hosting, and remote profile loading pulls a shared config across every browser and device you use. Multiple profiles keep home-server, work, and dev-tool link sets separate. PWA support installs it on a phone home screen, caching strategies keep it fast offline, read-only mode suits kiosk displays, and Cmd/Ctrl+/ reveals the full hotkey reference. Serve it from any static host and point your new tab at it.