InfraCanvas
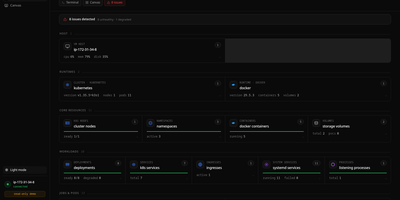
InfraCanvas draws the picture ten terminal commands cannot: a live map in your browser of every container, pod, service, volume and network on a machine, showing what runs where, what talks to what, and what is broken in one glance. Nodes turn green, amber or red from real state, including container health, pod phases, ready replicas, zombie processes and host thresholds, and real connection edges appear between processes, like your app server talking to Postgres on port 5432, read straight from the machine. It works where workloads already live: Docker and Podman containers, full Kubernetes object graphs from nodes to ingresses, LXD and Incus containers, and plain systemd or PM2 services on VMs with no container runtime. From any node you can shell into the container, pod or host, tail logs, restart or stop a service, scale a deployment, run a rolling restart, change an image or kill a process, with secrets masked before anything reaches the screen. A second machine joins through an outbound-only agent, and clusters connect by dropping in a kubeconfig with nothing installed inside them. The self-hosted binary needs no account, sends no telemetry and opens no inbound port: it binds localhost on port 7777 behind a random per-install token, with an optional read-only mode, and every action is audit-logged. Running on a dedicated VPS on RepoCloud with guaranteed CPU, RAM, and SSD, full root SSH access, and a browser serial console. AGPL-3.0 licensed.

Nanocl
One server, treated properly: Nanocl runs your containers and full virtual machines from a single declarative Statefile, reconciling what is running against what the file says, so a lone host gets cluster discipline without cluster ceremony. Containers group into Cargoes with replica counts, ordered init containers, and health-aware restarts; finite jobs run to completion and stop. When a workload needs a real kernel or a custom disk image, it boots as a QEMU virtual machine beside the containers instead of forcing a second platform. Publishing is built in: the proxy controller terminates TLS and routes HTTP and TCP traffic, and the DNS controller keeps service names resolving while workloads come and go. Secrets for registries, certificates, and environment variables attach where they are used, never inside the file itself. The daily loop is a CLI and an API: list processes, follow logs, exec into a container, watch events, and back up the entire deployment state before you change it. Namespaces keep projects apart on the same host, and Statefile arguments, templates, and sub-states carry one definition from staging to production. Running on a dedicated VPS on RepoCloud with guaranteed CPU, RAM, and SSD, full root SSH access, and a browser serial console. MIT or Apache-2.0 licensed.
AutoXpose
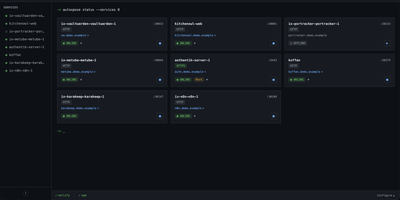
Tag a Docker container with two labels, and AutoXpose turns it into a published service with a DNS record, a reverse proxy route, and HTTPS, without you opening a single provider dashboard. From the web dashboard you connect one of six DNS providers, Cloudflare, Netlify, DigitalOcean, Porkbun, Aliyun, or Tencent DNSPod, and point it at the Nginx Proxy Manager or Caddy instance you already run. It watches your containers continuously after that: a new label creates the record, propagation is verified before the service shows as live, and removing the container removes its public entries too. Auto-expose mode publishes containers the moment they appear, while manual mode stages them in the dashboard for approval first. Color-coded service tags sort what you run into web, database, and media groups at a glance, and dashboard warnings flag misconfigurations before they become broken links. Nginx Proxy Manager access lists attach by label, so an admin panel stays reachable only from the networks you trust. When containers vanish, orphaned cleanup hunts down the stale DNS records and proxy hosts they left behind. Settings and state live inside the same single container, so the publishing pipeline for a homelab or a small fleet stays one compose service you can back up as a unit. Running on a dedicated VPS on RepoCloud with guaranteed CPU, RAM, and SSD, full root SSH access, and a browser serial console. MIT licensed.
Tunnel Panel
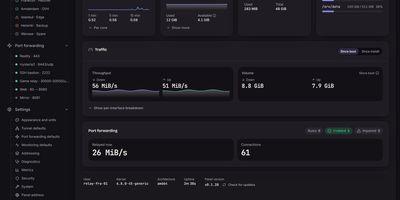
Tunnel Panel manages GRE tunnels and port forwarding on Linux servers from a web panel that previews every change before it runs and verifies the result against the kernel. Create GRE, GRETAP, IP6GRE, and IP6GRETAP tunnels and see the exact commands, unit file, and rollback before anything is applied. The far end configures itself from a pairing code, as text or QR, with the sides flipped automatically so the two ends cannot disagree by a typo. Native ICMP probing with hysteresis keeps a single dropped packet from flapping a tunnel between down and back, and when ICMP is filtered the panel knocks over TCP and says so instead of crying wolf. Forward any TCP or UDP port, or a whole range, with round-robin, source-hash, or weighted balancing across destinations, and a backend that stops answering its health knock leaves the ruleset until it recovers. Watch every connection crossing the relay, who connected, which destination took them, and how much has moved, and set traffic limits per tunnel, rule, or destination. When something breaks, diagnostics reach a verdict with evidence and a suggested fix, backed by a streaming manual probe and a path-MTU search that offers to apply its findings. The panel reads your kernel's relay limits, recommends values from the host's memory and cores, and refuses changes that would lock you out of your own server. Running on a dedicated VPS on RepoCloud with guaranteed CPU, RAM, and SSD, full root SSH access, and a browser serial console. AGPL-3.0 licensed.
Nixopus
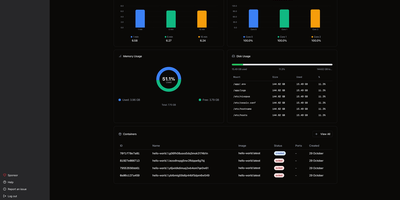
Tell an AI agent to deploy your app and watch it actually happen. Nixopus connects to your GitHub repo, analyzes the codebase to detect your framework, generates the right Docker configuration, resolves dependency conflicts, and ships the whole thing to your server with HTTPS enabled. When something breaks, the agent reads the logs, creates a pull request with a fix, and redeploys without waking you up. The chat interface lets you deploy, add custom domains, check logs, roll back, and troubleshoot in plain English from the web dashboard or directly from your VS Code or Cursor editor. Extensions bring one-click installs for 100+ self-hostable apps like Appwrite, Excalidraw, and Ollama, each showing you exactly what it runs on your server before installation. Connect multiple servers and monitor CPU, memory, disk, and running containers across your entire fleet from a single dashboard with draggable widget layouts. The built-in terminal opens SSH sessions right in the browser with split-pane support, so you can watch logs in one pane while running commands in another. Framework detection covers Next.js, Django, Rails, Go, FastAPI, and anything else that fits a container image. Every deployment gets automatic TLS via Caddy with Let's Encrypt certificates provisioned and renewed silently. Previous container images are retained so rollbacks skip the rebuild step entirely. Deploy on a dedicated VPS on RepoCloud with guaranteed CPU, RAM, and SSD, full root SSH access, and a browser serial console. AGPL-3.0 licensed.
GoCron
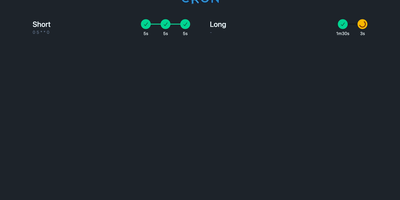
Configuring recurring cron jobs via version-controlled YAML manifests becomes seamless with GoCron, giving systems engineers and DevOps administrators a responsive web console to orchestrate scheduled commands with hot-reloading and sandboxed execution. Administrators can declare schedules using standard five-field cron syntax, establish global default configurations, and inherit execution timeouts, retry policies, and environment variable expansions across individual tasks. The interactive web interface provides immediate visibility into upcoming runs, past execution durations, status badges, and expandable terminal output logs stored in local SQLite databases. Operators can trigger ad-hoc job runs on demand, cancel stalled processes, and utilize a built-in sandboxed terminal utility governed by strict command whitelists. Automated health check webhooks dispatch HTTP notifications to external monitoring services upon job initiation, successful completion, or unexpected execution failure. The container environment bundles common server utilities including Restic, BorgBackup, and Rclone, streamlining automated offsite database backups and cloud storage synchronization routines without additional dependencies. Dynamic configuration reloading automatically detects filesystem modifications to YAML manifests without restarting the daemon, ensuring zero-downtime schedule updates. Running on a dedicated VPS on RepoCloud with guaranteed CPU, RAM, and SSD, full root SSH access, and a browser serial console. MIT licensed.
Nimbus
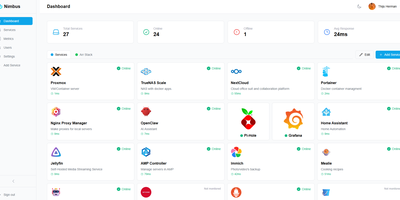
Nimbus is a self-hosted homelab dashboard that turns your scattered pile of services into a polished, organized command center with real-time health monitoring for every endpoint you care about. The dashboard displays live status cards for each registered service, tracking response times down to the millisecond and graphing uptime history so you can spot degradation before it becomes an outage. Health checks run on configurable intervals with smart self-signed certificate handling, meaning your internal services with self-issued TLS do not trigger false alarms. Multi-user support comes standard: local accounts authenticate via JWT, while OAuth2 integration with Google, GitHub, and Discord lets team members sign in with existing credentials. Role-based access control and a built-in admin panel give you granular authority over who sees what. Each user personalizes their view with custom backgrounds, light or dark mode, accent color themes, and drag-and-drop service tile arrangement. Services group into named categories and cards resize to fit your preferred layout, with both grid and list view modes available. Prometheus metrics export feeds your existing Grafana stack, and webhook notifications alert you instantly when a service goes offline. Custom service icons upload directly or auto-fetch from the Dashboard Icons collection. Zero-config Docker deployment gets you running in under 30 seconds with a single docker-compose command. Running on a dedicated VPS on RepoCloud with guaranteed CPU, RAM, and SSD, full root SSH access, and a browser serial console. AGPL-3.0 licensed.
Usulnet
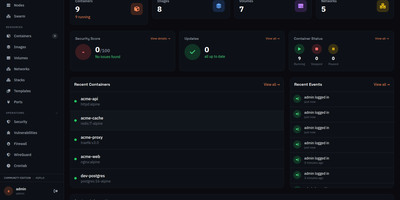
Usulnet packs container management, Trivy security scanning, Nginx reverse proxy, scheduled backups, WireGuard VPN, firewall rules, and multi-node orchestration into a single 70MB Go binary with zero external runtime dependencies. Every module ships in one download with no paid tiers, no telemetry, and no edition gating. Container lifecycle management covers creation, start, stop, restart, pause, kill, and removal with bulk operations, real-time resource statistics, filesystem browsing, and settings editing. Trivy integration scans images and running containers for CVEs with severity scoring, generates SBOMs, and validates CIS benchmarks. The multi-node architecture supports standalone, master, or agent modes where agents connect over NATS JetStream with mTLS encryption, enabling remote Docker host management from a central dashboard. Reverse proxy configuration handles Nginx with automatic Let's Encrypt certificates, TCP/UDP stream proxying, access lists, and dead host detection. Backup operations capture container volumes and Compose stacks on configurable schedules with retention policies and full restore capabilities. A built-in application catalog provides 60+ one-click templates for common services. JWT license validation uses an RSA-4096 public key embedded in the binary, requiring no call-home and working entirely offline. For teams tired of maintaining separate tools for each infrastructure concern, Usulnet collapses the entire stack into a single point of management with Docker Compose deployment alongside PostgreSQL, Redis, and NATS.
Simon
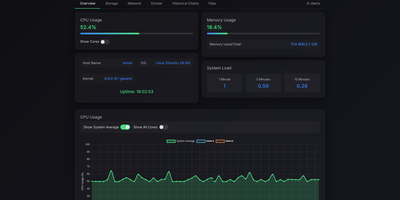
Simon is a lightweight self-hosted system monitor that shows live CPU, memory, disk, and network metrics for your server and its Docker containers in one web dashboard, with threshold alerts and a built-in file browser. Open the dashboard to watch real-time gauges alongside historical charts, so a slow memory leak becomes visible hours before it takes a service down. Every running container appears with its own CPU and memory stats, and its logs open in a searchable viewer, so routine diagnosis never needs a terminal session on the host. The file browser lets you navigate the directories you choose to expose, preview file contents, upload with drag and drop, create folders, and move or delete items. Downloads support range requests, which means large files resume cleanly after a dropped connection and media files stream instead of failing halfway. Alert rules fire when CPU, memory, disk, or network activity crosses thresholds you set, and notifications arrive through Telegram, ntfy, Gotify, Pushover, Pushbullet, Matrix, or any custom webhook. Prebuilt notification templates get common setups running in minutes, and password authentication keeps the dashboard private on a public server. Resource-constrained machines benefit most: the monitor runs comfortably on single-board computers and small instances where heavier monitoring stacks would consume the very memory they exist to watch. Running on a dedicated VPS on RepoCloud with guaranteed CPU, RAM, and SSD, full root SSH access, and a browser serial console. MIT licensed.
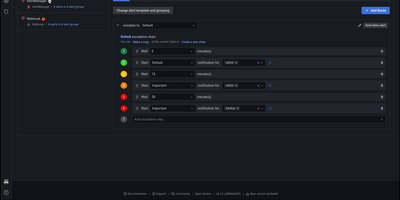
Grafana OnCall
With 3,900 GitHub stars, 140 contributors, and 380 releases since its 2022 launch, Grafana OnCall delivers developer-friendly incident response that routes alerts from any monitoring system to the right engineer at the right time through the right channel. The platform accepts alerts via unique API URLs from Alertmanager, Grafana Alerting, Zabbix, Datadog, Pagerduty-compatible sources, Jira, inbound email, and generic HTTP webhooks, then applies routing templates to direct each alert to the appropriate escalation chain. Escalation chains define notification sequences — notify the primary on-call via Slack, wait 5 minutes, escalate to SMS and phone, wait 10 minutes, page the secondary on-call and notify the engineering manager — continuing until acknowledgment or resolution. On-call schedules support multi-layer rotations with overrides, shift swaps, and timezone-aware handoffs rendered directly inside Grafana dashboards. ChatOps integration publishes alert groups to Slack channels and Telegram groups with interactive buttons for acknowledge, resolve, and silence actions. Template engines based on Jinja2 control alert grouping, appearance rendering, and behavioral automation. The REST API enables programmatic management of integrations, schedules, and escalation policies. Deploy via Docker Compose with PostgreSQL, Redis, and Celery workers alongside your existing Grafana instance. Running on a dedicated VPS on RepoCloud with guaranteed CPU, RAM, and SSD, full root SSH access, and a browser serial console. GNU AGPL v3 licensed.
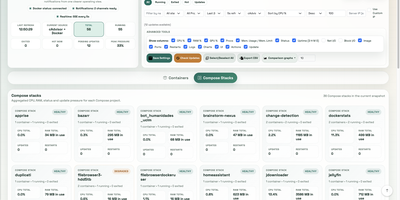
Statainer
Monitoring and safeguarding Docker infrastructure without heavy enterprise software overhead is the primary mission of Statainer, an open-source management control center for container hosts. System operators inspect live CPU loads, memory consumption, network throughput, and disk I/O metrics across individual containers or comparative top-ranking charts. The interface groups containers by Compose projects, enabling administrators to start, stop, or restart entire application stacks and inspect real-time log streams without opening SSH sessions. The built-in Update Manager detects available image tags, executes single-click container updates, and maintains persistent deployment history with automated rollback capabilities for failed recreations. Custom alert configurations trigger instant notifications to Telegram, Discord, Slack, Pushover, or generic webhook endpoints whenever resource thresholds are breached or container health states change. Developers can provision scoped API keys with token authentication to automate container state transitions and export performance telemetry into custom monitoring workflows. Running on a dedicated VPS on RepoCloud with guaranteed CPU, RAM, and SSD, full root SSH access, and a browser serial console. MIT licensed.
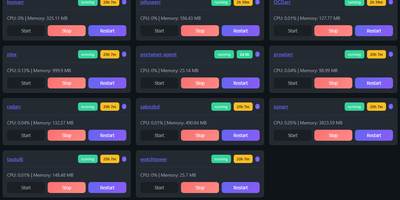
Composr
Managing multi-server container fleets often deteriorates into fragmented SSH sessions, mismatched compose files, and conflicting port allocations. Composr consolidates multiple Docker host daemons into a unified web dashboard that controls running containers, stack definitions, and system metrics from a single interface. Operators can connect remote Docker daemons through encrypted TCP sockets, inspect container health, and stream live execution logs with sub-second responsiveness. A built-in project creation wizard guides administrators through drafting new Compose topologies across local directories or remote server nodes. In-browser CodeMirror editors deliver live syntax highlighting for YAML files, configuration dotfiles, and reverse proxy definitions without detaching containers from disk. The platform tracks service properties directly, letting you toggle Compose profiles, relocate services between YAML manifests with pre-flight risk checks, and detect target port collisions before redeployment. Integrated backup managers bundle container metadata, compose files, and environment definitions into downloadable archive packages for automated disaster recovery. System operators can open interactive browser terminals into any active container, execute batch maintenance tasks, and configure scheduled image update checks. Running on a dedicated VPS on RepoCloud with guaranteed CPU, RAM, and SSD, full root SSH access, and a browser serial console. MIT licensed.
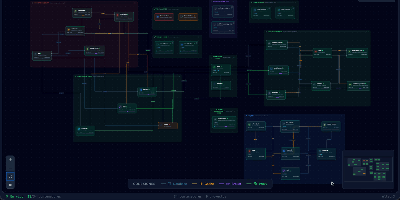
ContainerFlow
Your database container is probably not at 98 percent memory, whatever docker stats claims, because most of that figure is reclaimable page cache; ContainerFlow subtracts the full cache and shows the memory your containers actually hold. Point it at a Docker socket and it draws the whole estate as a living map: every Compose project discovered automatically, services grouped and colour coded, and the connections between them inferred, app to database, proxy to app, worker to broker. CPU and memory refresh every three seconds, the graph flashes when a container starts, stops, or restarts, and seven days of metric history wait in a local store when you need to know what happened overnight. Click any node and a detail panel opens with live logs you can filter by stream, an inline terminal that runs commands inside the container, and buttons to start, stop, restart, rebuild, recreate, or remove it. The same panel teaches as it works, flagging containers that run with no memory limit, no CPU limit, or no restart policy, while Discord webhooks fire when a container you care about crosses a threshold you set. Running on a dedicated VPS on RepoCloud with guaranteed CPU, RAM, and SSD, full root SSH access, and a browser serial console. AGPL-3.0 licensed.
Moneat
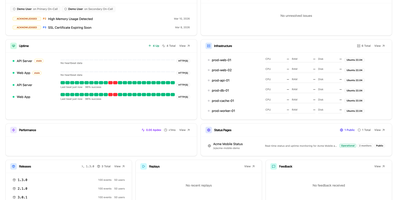
Moneat is the open-source observability platform that unifies error tracking, session replay, performance monitoring, logging, uptime checks, synthetics, product analytics, and AI observability into a single self-hosted application — replacing Sentry, Datadog, and Statuspage with one deployment. The Sentry SDK compatibility layer accepts data from @sentry/browser, @sentry/node, @sentry/react, @sentry/nextjs, sentry-sdk for Python, sentry-kotlin, sentry-java, sentry-android, sentry-cocoa, sentry-go, sentry-ruby, and Sentry.NET by updating one DSN endpoint. Datadog Agent compatibility redirects existing fleets by setting dd_url, and native OpenTelemetry OTLP ingestion accepts logs, traces, and metrics from any exporter or Collector. Error monitoring groups exceptions with smart deduplication, session replay records DOM-based user interactions linked to errors, distributed tracing visualizes transaction and span breakdowns with live service maps, and continuous profiling renders flamegraphs in pprof, JFR, and Sentry formats. Uptime monitoring runs HTTP, TCP, and ping checks with public status pages, while synthetics executes API tests, multi-step workflows, SSL checks, and DNS probes. Custom dashboards support drag-and-drop widgets with Grafana import, product analytics provides funnels and retention cohorts, release tracking surfaces crash-free rates with source map upload, and AI observability traces LLM calls end to end. Built on Kotlin and Java with ClickHouse for analytical storage, PostgreSQL for relational data, and Redis for caching, deployment uses Docker Compose with an interactive installer automating secrets and service orchestration. Running on a dedicated VPS on RepoCloud with guaranteed CPU, RAM, and SSD, full root SSH access, and a browser serial console. AGPL-3.0 licensed.
Forgejo
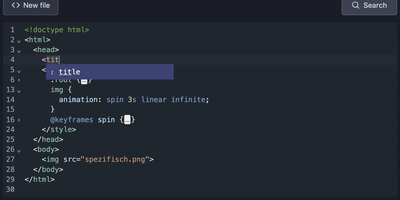
Governed by the non-profit Codeberg e.V. with over 150 contributors and quarterly major releases reaching v16.0 in July 2026, Forgejo delivers a complete code collaboration platform in a single Go binary that runs comfortably on 512 MB of RAM — providing full Git hosting with SSH and HTTPS, pull requests with inline code review, issue tracking with labels and milestones, kanban project boards, wikis, and an integrated package registry supporting Docker, npm, PyPI, Maven, NuGet, and Cargo. Forgejo Actions provides GitHub Actions-compatible CI/CD with reusable workflows, OpenID Connect for secure third-party access, ephemeral runners for autoscaling, and dynamic matrix support for complex build pipelines. The platform implements ActivityPub-based forge federation allowing issues, pull requests, and stars to work across independent instances — enabling a decentralized development ecosystem similar to how Mastodon federates social networks. Organizations and team permissions provide fine-grained access control, while LDAP, OAuth2, and OpenID authentication integrate with existing identity infrastructure. Code search indexes repositories for fast discovery, LFS handles large files efficiently, and mirror synchronization imports repositories from GitHub, GitLab, and other forges. Deploy via a single static binary, Docker container, or official Helm charts with SQLite for small instances or PostgreSQL and MySQL for production workloads. Running on a dedicated VPS on RepoCloud with guaranteed CPU, RAM, and SSD, full root SSH access, and a browser serial console. GPLv3+ licensed.

Ntfy
ntfy sends push notifications to your phone or desktop with a single curl command: publish a message to any topic and every subscriber receives it instantly, no signup or API key required. Over 31,000 GitHub stars and 106 releases since 2021 back a server supporting five priority levels mapped to distinct notification sounds and vibration patterns, emoji tags for visual classification, click actions that open URLs when tapped, and up to three action buttons per notification for view, HTTP callback, broadcast, or clipboard copy operations. File attachments push images from surveillance cameras, documents, or any binary payload directly to mobile devices. Subscriptions work through JSON streams, Server-Sent Events, WebSockets, or raw text, with server-side filtering by priority, tags, and message ID. Authentication enforces topic-level access control through Basic Auth, Bearer tokens, or query parameters, with a built-in user and ACL management system. UnifiedPush compatibility lets ntfy serve as a push distributor for Mastodon, Matrix, and other federated services. Web Push via VAPID keys delivers browser notifications without the mobile app. The server ships as a single statically linked Go binary or Docker image supporting amd64, armv7, and arm64 architectures, consuming 30-50 MB RAM at idle with SQLite-backed message caching. Integrations include Grafana, Prometheus Alertmanager, Uptime Kuma, Home Assistant, and Ansible Semaphore. Running on a dedicated VPS on RepoCloud with guaranteed CPU, RAM, and SSD, full root SSH access, and a browser serial console. Apache 2.0 / GPLv2 dual-licensed.

Ubuntu VPS
A minimal Ubuntu 24.04 LTS virtual private server — no pre-installed applications, no opinionated configuration, just the operating system and root access. Start from a clean slate and install exactly what you need: web servers, databases, development toolchains, CI runners, monitoring stacks, VPN endpoints, game servers, or anything else that runs on Linux. The server ships with apt package management, systemd service supervision, and standard networking configured out of the box, giving you access to over 36,000 packages in the Universe repository alone. Connect via SSH with the key you select during deployment; a dedicated IPv4 address is included with every server at no extra charge. A browser-based serial console in the RepoCloud dashboard provides emergency access without an SSH client. Snapshots let you capture the server state before risky changes and roll back with one click. Resize CPU and RAM on demand without reinstalling. Canonical's standard security maintenance covers this LTS release through May 2029 — five years of patches for the Main repository. Ubuntu Pro extends that to ten years with additional Universe coverage, kernel livepatching, and compliance tooling, available free for up to five machines.
GlitchTip
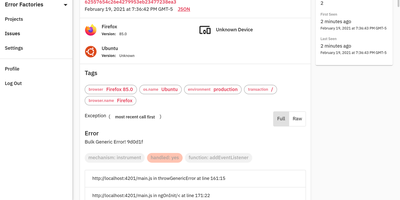
GlitchTip speaks Sentry's protocol without Sentry's operational weight - open-source error tracking that your existing SDKs already understand. The pitch is pragmatic: instrument your application with the official Sentry SDKs you already know - any language they cover - and point the DSN at your own GlitchTip instance instead. Errors, exceptions, log messages, and Content Security Policy violations flow into one place for triage, grouped into issues with stack traces, with alerts delivered by email or webhook the moment things break. Where self-hosted Sentry has ballooned into a docker-compose stack of twenty-plus containers, GlitchTip is a deliberately lean Django and PostgreSQL application a small team can actually run. Beyond errors, it bundles three more monitoring concerns: performance monitoring takes a works-out-of-the-box approach - no dashboard building, just your slowest web requests, database queries, and transactions surfaced automatically; uptime monitoring pings your sites and alerts on failures, or runs in reverse as a dead-man's-switch heartbeat for cron jobs that must check in on schedule; and log search puts application logs alongside errors for faster debugging. Unlimited projects and team members, MIT-licensed, built by Burke Software - your event volume is limited only by your own hardware.