NetMap
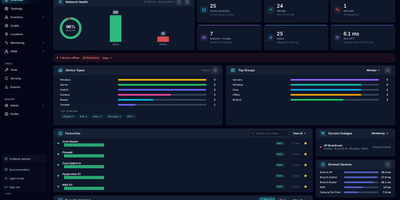
NetMap answers the four questions every homelab owner asks in four different tools: what is on my network, what address did it get, is it still up, and why is the firewall shouting about it. Devices you add appear automatically on a visual canvas where you can drag them into place, draw the links between them, and group them into VLANs or separate sites, and the layout is still there when you come back. Behind the map, every device is watched continuously: ping times graphed over history, service checks on the ports you care about, a heartbeat strip that betrays intermittent dropouts, and an uptime percentage that settles arguments. Address management stops being a spreadsheet: define subnets, import the leases your router already handed out, see used and free addresses as a grid, and get warned before a duplicate assignment causes a mysterious outage. Firewall logs stream in live and each entry links to the device it concerns, ready to search by address, port, or protocol. When something new appears, a network scan discovers hosts with their names, hardware addresses, and open ports for review before they join the inventory. Running on a dedicated VPS on RepoCloud with guaranteed CPU, RAM, and SSD, full root SSH access, and a browser serial console. GPL-3.0 licensed.
InfraCanvas
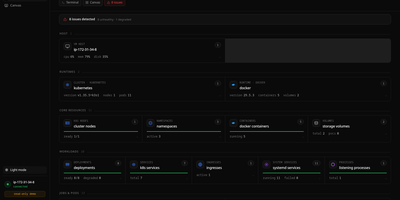
InfraCanvas draws the picture ten terminal commands cannot: a live map in your browser of every container, pod, service, volume and network on a machine, showing what runs where, what talks to what, and what is broken in one glance. Nodes turn green, amber or red from real state, including container health, pod phases, ready replicas, zombie processes and host thresholds, and real connection edges appear between processes, like your app server talking to Postgres on port 5432, read straight from the machine. It works where workloads already live: Docker and Podman containers, full Kubernetes object graphs from nodes to ingresses, LXD and Incus containers, and plain systemd or PM2 services on VMs with no container runtime. From any node you can shell into the container, pod or host, tail logs, restart or stop a service, scale a deployment, run a rolling restart, change an image or kill a process, with secrets masked before anything reaches the screen. A second machine joins through an outbound-only agent, and clusters connect by dropping in a kubeconfig with nothing installed inside them. The self-hosted binary needs no account, sends no telemetry and opens no inbound port: it binds localhost on port 7777 behind a random per-install token, with an optional read-only mode, and every action is audit-logged. Running on a dedicated VPS on RepoCloud with guaranteed CPU, RAM, and SSD, full root SSH access, and a browser serial console. AGPL-3.0 licensed.
HomeLabInfo
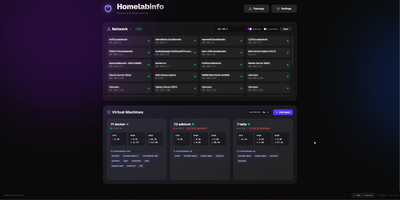
HomeLabInfo gives your homelab one dashboard where the network itself and everything running on it finally appear together, instead of scattered across router pages and terminal sessions. It watches for new devices the instant they ask the network for an address, identifies who made them, and can fire a webhook so you hear about a stranger joining your LAN before you notice it yourself. Scans keep track of which devices are online and which have gone quiet, and the interactive topology view lets you arrange the map of switches, access points, NAS boxes, and servers the way your rack actually looks. Lightweight agents installed on each machine report their containers back to the hub, so running and stopped containers, uptime, health, and host CPU, memory, and disk all show in one place without opening a separate tool per server. When an agent falls behind, its card tells you a newer version exists instead of leaving you guessing. You can add a username and password login before putting the dashboard anywhere beyond your desk, and arrange container layouts that stay put between visits. Running on a dedicated VPS on RepoCloud with guaranteed CPU, RAM, and SSD, full root SSH access, and a browser serial console. GPL-3.0 licensed.