Metabase
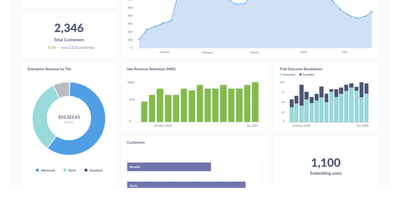
The most widely deployed open-source BI tool, Metabase is a visualization and query layer that sits on top of your existing databases without ingesting or copying data. Non-technical users ask questions through a visual query builder with drill-through menus that answer follow-ups like "broken down by month" without writing a new query, while analysts use the native SQL editor with variables and templates for complex work. Questions assemble into interactive dashboards with filters, auto-refresh, fullscreen mode, and custom click behavior, and dashboard subscriptions email or Slack scheduled reports to stakeholders. It connects to 20+ data sources including PostgreSQL, MySQL, MongoDB, SQL Server, BigQuery, Snowflake, Redshift, and ClickHouse - always querying in place, so there is no second data store to secure, sync, or pay for, and results are always current. Models and metrics let a data team define official, reusable starting points so self-service stays consistent, collections with permissions organize content, and alerts fire when a metric crosses a threshold. The practical effect is cutting the ad-hoc query queue that lands on the data team, since non-technical staff can answer their own questions. Written in Clojure, licensed AGPL, and shipped as a single JAR or Docker image with an embedded application database - a working BI instance runs before most tools finish their installer - the open-source edition has no limits on users, dashboards, or connected databases, where commercial BI platforms price per viewer as well as per creator.
ChartDB
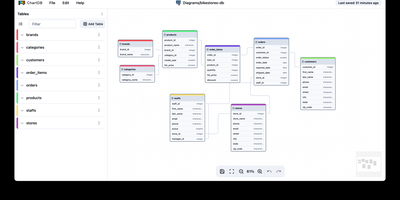
Paste one SQL query result into a browser and get an interactive entity-relationship diagram instantly, with no installations, no credentials, and no account required. ChartDB's "Smart Query" runs a single statement in your existing database client that exports table definitions, relationships, indexes, and column types as JSON metadata, meaning the application never touches your database passwords. The canvas renders draggable entities with cardinality markers, collapsible grouping areas, and sticky notes for documentation. AI-powered DDL export generates migration scripts between dialect pairs like PostgreSQL to MySQL or SQLite to CockroachDB, analyzing your schema to produce target-specific DDL with correct type mappings and constraint translations. Import paths cover Smart Query JSON, raw DDL scripts, and DBML files from tools like dbdiagram.io. The AI layer connects to OpenAI or any compatible inference server including local vLLM instances running models like Qwen2.5-32B. Database coverage includes PostgreSQL (with Supabase and Timescale extensions), MySQL, SQL Server, MariaDB, SQLite (with Cloudflare D1), CockroachDB, ClickHouse, and Oracle. Exports to SVG with inline styles or SQL DDL in any target dialect. Ships as a React/Vite frontend behind Nginx in Docker, deployable on RepoCloud with dedicated VPS resources under the AGPL-3.0 license.
Grafana
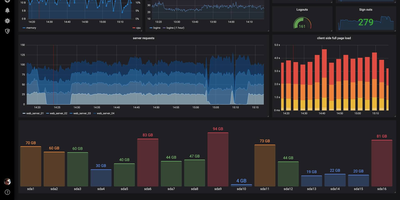
The de facto dashboard of observability: Grafana is the open-source frontend that turns the data stores you already run into interactive graphs. It does not store metrics itself; it connects to the data stores you already run and turns their contents into interactive dashboards. Supported sources number over 150 via plugins: Prometheus, Loki, Tempo, InfluxDB, Elasticsearch, MySQL, PostgreSQL, Microsoft SQL Server, AWS CloudWatch, Azure Monitor, Google Cloud Monitoring, and many more. Dashboards are built from a large library of panel types (time series, heatmaps, tables, gauges, logs) with template variables for reusable, parameterized views. Unified alerting evaluates rules against any connected data source, not just Prometheus, and routes notifications to Slack, PagerDuty, email, and other channels with grouping and silencing - unlike Prometheus Alertmanager, a single rule can combine a Loki log pattern, a PostgreSQL query result, and a CloudWatch metric. Dashboards serialize to JSON and data sources configure via provisioning files, so the entire observability setup can live in Git and deploy repeatably across environments. Explore mode adds ad-hoc querying outside dashboards, with split view for correlating a metric spike against the matching log lines, and access control spans organizations, teams, folder permissions, and OAuth, LDAP, and SAML integration. Written in Go and TypeScript, AGPL-licensed. Self-hosting gives you unlimited users, dashboards, and queries at flat hosting cost, without Grafana Cloud's usage-based pricing.
D-Tale
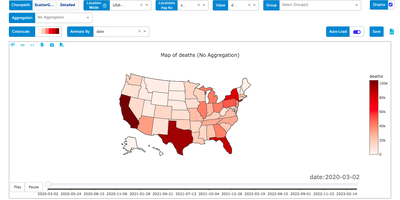
If your data lives in a pandas DataFrame, D-Tale gives it a spreadsheet-style grid, a column profiler, and a chart builder in the browser, started with one call from a notebook or script. In the grid you sort, filter, and edit cells inline, lock, hide, reorder, rename, or reformat columns from their menus, and open a Describe view with each column's distribution, summary statistics, outliers, and missing values, while highlight modes color dtypes, outliers, and numeric ranges across the whole table. Correlation matrices, a predictive power score, and duplicate reports sit beside dataframe functions that add numeric, binned, date, random, and type-converted columns, and Merge & Stack combines dataframes, including ones uploaded from Excel files. The chart builder draws line, bar, stacked, pie, wordcloud, heatmap, 3D scatter, surface, and map charts with grouping and aggregation, exports them as standalone HTML, and a network viewer graphs relationships between nodes. Whatever you build in the interface can be exported as reproducible Python code, and data can be saved as CSV or TSV. Launch it from Jupyter, Google Colab, Kaggle, a terminal, or the command line with a CSV path, protect it with optional authentication, and choose light or dark themes and English or Chinese. Running on a dedicated VPS on RepoCloud with guaranteed CPU, RAM, and SSD, full root SSH access, and a browser serial console. LGPL-2.1 licensed.
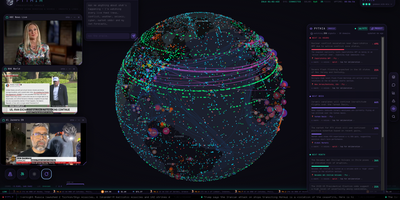
Pythia
With over 400 GitHub stars and growing, Pythia transforms a local LLM into a self-calibrating geopolitical oracle that watches the entire planet and predicts what happens next — no API keys, no cloud, no cost. The Osiris-based Three.js globe frontend streams 30+ concurrent live feeds including GDELT geopolitics, armed conflict events, USGS earthquakes, NWS storm polygons, EONET disasters, FIRMS wildfires, Polymarket crowd odds, cryptocurrency and commodity prices, UNHCR displacement data, WHO disease outbreaks, and WFP food insecurity indicators. The FastAPI backend fuses these heterogeneous sources into a unified world brief, pipes it through Ollama, and generates located predictions across 24-hour, weekly, monthly, and yearly horizons — each carrying a probability, reasoning, and geocoordinates that fly the globe to the event. A council of four specialist swarm agents — Strategist, Economist, Naturalist, and Skeptic — re-scores every forecast, surfacing consensus, dissent, and splits through Brier-weighted voting where historically accurate personas earn louder votes. The engine maintains a persistent ledger graded by an LLM judge against archived world state, producing running Brier scores and calibration charts. Signal rules fire browser notifications and webhooks when conditions match, a morning brief digest summarizes overnight changes, and the agent API at port 8088 delivers the complete world view in a single JSON call compressed to approximately 50 tokens for AI agent consumption. Running on a dedicated VPS on RepoCloud with guaranteed CPU, RAM, and SSD, full root SSH access, and a browser serial console. MIT licensed.
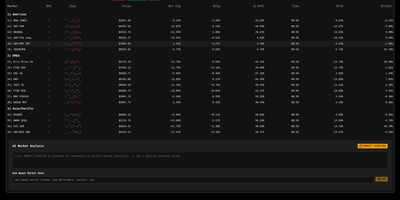
Bloomberg Terminal
With 1,450+ GitHub stars and a live demo on Vercel, this Bloomberg Terminal clone delivers a professional-grade financial dashboard without the $24,000 annual seat license. The Next.js 15 App Router with React 19 and TypeScript serves a single-page terminal interface optimized for constantly mutating financial data, with partial pre-rendering enabling sub-500ms initial loads even on data-heavy views. Upstash Redis caches AlphaVantage market data to minimize API calls while maintaining sub-second update latency through React Query polling with configurable refresh rates. OpenAI integration provides AI-powered market insights, sentiment analysis, and trend interpretation directly within the terminal interface. Multiple specialized views cover market data tables with bid/ask spreads, financial news aggregation with category filtering, market movers highlighting top gainers and losers, and volatility analysis with historical comparison charts. Jotai atoms manage local state for watchlists, layout preferences, and terminal sessions while React Query handles server-state synchronization with aggressive stale-while-revalidate caching. The shadcn/ui component library with Tailwind CSS delivers accessible, keyboard-navigable interface elements styled after Bloomberg's iconic dark terminal aesthetic. Security features include origin restriction, rate limiting via Redis, and Zod-based input validation on all API routes. Motion (formerly Framer Motion) animates transitions between views and data updates without layout shift. Running on a dedicated VPS on RepoCloud with guaranteed CPU, RAM, and SSD, full root SSH access, and a browser serial console. MIT licensed.
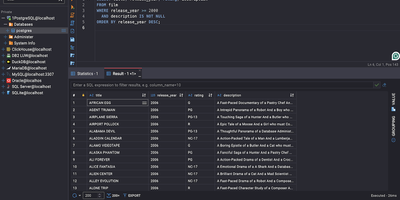
CloudBeaver
CloudBeaver puts a full-featured database management environment in your browser, connecting to PostgreSQL, MySQL, SQL Server, Oracle, ClickHouse, and over 100 additional engines through one unified interface that requires no desktop client installation. The Java server exposes a TypeScript/React frontend through a GraphQL API where teams can browse schemas, edit data, visualize relationships, and execute queries across all connected databases in a single workspace. The SQL Editor provides syntax highlighting, auto-completion with fuzzy search, AI-assisted SQL generation from natural language prompts, script management with save/download/upload capabilities, execution plan visualization, and multi-tab result display. The Data Editor enables direct cell editing, filtering, sorting, and bulk data modification with support for spatial GIS data rendering. Database administrators access a Navigator panel for browsing schemas, tables, views, foreign tables, triggers, dependencies, and stored procedures across all connected databases. ER Diagrams visualize table relationships and schema structure, while the Visual Query Builder constructs queries without hand-writing SQL. Multi-user administration provides role-based access control, connection sharing with configurable permissions, and session management. SSH tunneling secures remote database connections, and data can be exported or imported in multiple formats. Query History tracks all executed statements with timestamps and execution statistics. Running on a dedicated VPS on RepoCloud with guaranteed CPU, RAM, and SSD, full root SSH access, and a browser serial console. Apache 2.0 licensed.
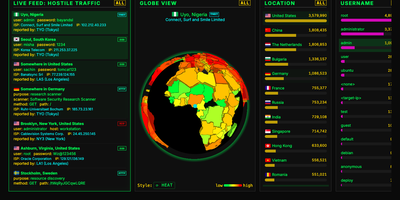
Knock-Knock
Bots that knock on your server's login ports are always turned away by Knock-Knock, a multi-protocol honeypot that shows every attempt on a live dashboard. Honeypots answer on the standard ports for SSH, Telnet, FTP, RDP, SMB, SIP, HTTP, and SMTP, with MQTT, Node-RED, Modbus, S7, and SNMP as optional extras. Authentication is always rejected, so no bot ever gets a shell. Who is knocking? The live feed shows each attempt's country, username, password, ISP, IP, and protocol. From where? A 3D globe marks the origin in one of six styles, including an extruded country heat map. Trying what? Leaderboards rank countries, usernames, passwords, ISPs, and IP addresses, and a trivia panel explains why bots favor certain credentials. A protocol filter re-slices the feed, globe, and leaderboards together; SIP shows dialed numbers and toll-call destinations, and RDP shows hostnames and accounts. Too fast? Press the space bar to pause, right-click any knock for details, or switch on a virtual Geiger counter that clicks as attacks arrive. Want to fight back? Download hourly 30-day and 365-day blocklists with recipes for CSF, CrowdSec, ipset, nftables, and pfSense, or query the optional API for any IP, CIDR range, or ASN. Several honeypot servers can stream into one aggregated dashboard. Running on a dedicated VPS on RepoCloud with guaranteed CPU, RAM, and SSD, full root SSH access, and a browser serial console. MIT licensed.
Maloja
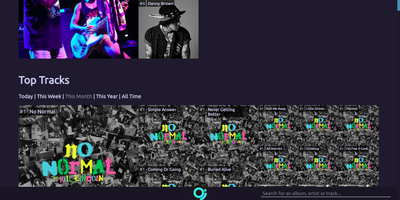
Maloja's one job is to be your own scrobble database, charting what you listen to from a server you control. Players and media servers that speak the native JSON API or a ListenBrainz, GNU FM, or Audioscrobbler 1.2 compatible protocol can scrobble with their own API keys. Vinyl sessions and background music can be logged by hand on a manual scrobble page. Existing history moves in from a Last.fm export, a Spotify data export, a ListenBrainz export, or another Maloja instance, while a proxy option forwards new scrobbles to Last.fm or a second Maloja server. The start page ranks top artists, tracks, and albums for today, this week, this month, this year, or all time, alongside a pulse chart of listening volume and a feed of the latest scrobbles. Artist and album pages add performance charts that follow chart position over time. Collaborations credit every artist on a track, and subunits, solo projects, and main acts can be combined or separated in charts at any time. Gold, Platinum, and Diamond awards mark tracks and albums that pass scrobble thresholds you set. Artwork can come from Last.fm, Spotify, Deezer, TheAudioDB, or MusicBrainz lookups, or from images you upload yourself. Week start, timezone, theme, and tile layout are all settings, and an API explorer lists endpoints for scripts. Running on a dedicated VPS on RepoCloud with guaranteed CPU, RAM, and SSD, full root SSH access, and a browser serial console. GPL-3.0 licensed.
ContainerFlow
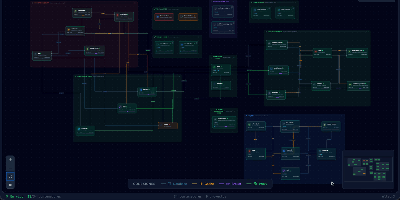
Your database container is probably not at 98 percent memory, whatever docker stats claims, because most of that figure is reclaimable page cache; ContainerFlow subtracts the full cache and shows the memory your containers actually hold. Point it at a Docker socket and it draws the whole estate as a living map: every Compose project discovered automatically, services grouped and colour coded, and the connections between them inferred, app to database, proxy to app, worker to broker. CPU and memory refresh every three seconds, the graph flashes when a container starts, stops, or restarts, and seven days of metric history wait in a local store when you need to know what happened overnight. Click any node and a detail panel opens with live logs you can filter by stream, an inline terminal that runs commands inside the container, and buttons to start, stop, restart, rebuild, recreate, or remove it. The same panel teaches as it works, flagging containers that run with no memory limit, no CPU limit, or no restart policy, while Discord webhooks fire when a container you care about crosses a threshold you set. Running on a dedicated VPS on RepoCloud with guaranteed CPU, RAM, and SSD, full root SSH access, and a browser serial console. AGPL-3.0 licensed.