Traceway
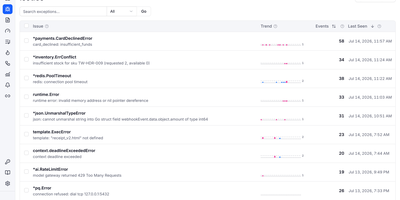
Production debugging slows to a crawl when logs, distributed traces, metrics, and session replays live in four disconnected dashboards, which is why Traceway consolidates every OpenTelemetry signal into a single self-hosted observability platform. Point any standard OTLP exporter directly at the ingestion endpoints without maintaining an intermediary collector or installing proprietary vendor SDKs. When an unhandled exception fires in production, automatic SHA-256 stack trace fingerprinting groups duplicates into prioritized issues complete with source-mapped frames and attached browser or Flutter session replays showing exact user clicks before the crash. Clicking any structured log entry jumps straight to its corresponding distributed span waterfall so engineers can trace slow database queries or failing downstream HTTP calls across microservices. Route performance bottlenecks surface immediately through per-endpoint P50, P95, and P99 latency percentiles ranked by Apdex and a five-factor impact score. Teams shipping AI features can also inspect LLM token consumption, model costs, tool calls, and multi-turn conversations grouped by customer identifier. Built-in on-call rotation schedules, escalation policies, and multi-channel alerts via Slack, Telegram, Pushover, email, and webhooks ensure incidents reach the right responder with one-click acknowledgment links. Running on a dedicated VPS on RepoCloud with guaranteed CPU, RAM, and SSD, full root SSH access, and a browser serial console. MIT licensed.
PG Back Web
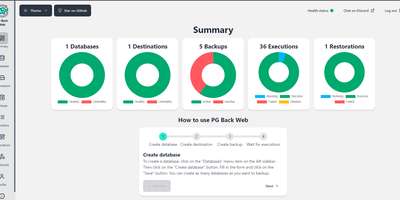
Automating PostgreSQL backup lifecycles across local volumes and S3-compatible object storage, PG Back Web gives database administrators and developers a self-hosted web console to schedule, encrypt, monitor, download, and restore database dumps without writing manual shell scripts. Instead of maintaining fragile crontab entries across individual database servers, you register PostgreSQL 13, 14, 15, 16, 17, or 18 instances in one dashboard and define recurring backup schedules with custom retention policies and timezone-aware timestamps. Each backup execution can target local directories or multiple S3 buckets across providers like AWS S3, MinIO, Backblaze B2, and Cloudflare R2, with built-in connection testing and presigned download links for rapid archive retrieval. To protect sensitive production records at rest and in transit, the platform applies PGP encryption to dump files while encrypting stored database connection strings and bucket credentials. Real-time execution logs record exact archive sizes, durations, and output streams, and the web interface lets operators trigger on-demand dumps, duplicate existing backup jobs, or run direct browser-based restorations when disaster recovery is required. Automated background health checks continuously verify connectivity to every registered PostgreSQL database and storage destination, firing configurable HTTP webhooks to Slack, Discord, or incident pipelines whenever a backup completes, fails, or changes health status. Running on a dedicated VPS on RepoCloud with guaranteed CPU, RAM, and SSD, full root SSH access, and a browser serial console. AGPL-3.0 licensed.
FeatBit
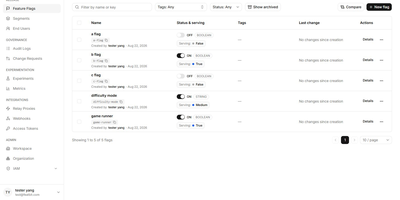
Engineering and product teams ship code to production daily with FeatBit, an enterprise feature flag and experimentation platform that controls exactly which user segments, regions, or percentage rollouts see each new capability. When a regression appears in production, operators toggle an instant kill switch, dial back canary weights from full traffic to one percent, or restrict access to internal QA accounts without redeploying containers. Reusable user segments group customers by subscription tier, device property, or custom attributes for consistent targeting across environments. Server-side and client-side SDKs for .NET, Java, Go, Python, Node.js, React, React Native, JavaScript, and OpenFeature synchronize flag states over WebSockets in under 100 milliseconds and evaluate rules locally in memory. Built-in A/B/n experimentation links flag variations to custom conversion events, click tracking, and pageview metrics so teams can validate product hypotheses with live telemetry. Scheduled rollouts, multi-step approval workflows, flag triggers, and webhook integrations with Slack, Datadog, Grafana, New Relic, and OpenTelemetry keep release operations auditable. Role-based access control and single sign-on govern every flag change. Running on a dedicated VPS on RepoCloud with guaranteed CPU, RAM, and SSD, full root SSH access, and a browser serial console. MIT licensed.
RackPeek
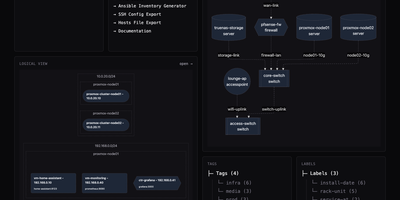
Every server, switch port, virtual machine, and network VLAN in a homelab or small IT environment can be cataloged, visualized, and exported through RackPeek's unified web interface and command-line toolkit. Operators record rack-mounted servers, managed switches, routers, firewalls, wireless access points, and uninterruptible power supplies alongside their CPU, memory, and storage specifications in a clean browser dashboard. Beyond physical gear, the inventory tracks operating systems, containerized or bare-metal services, IP subnets, and port-to-port cable connections while organizing assets with searchable tags and key-value labels. From that structured inventory, the interactive visualization engine renders live physical wiring diagrams and logical subnet-grouped service maps that export directly as high-resolution PNG graphics or Mermaid flowcharts. Because all state lives in a single human-readable configuration file backed by built-in Git repository synchronization, teams can version-control infrastructure changes or push automated updates through the authenticated REST API with dry-run diff previews. Day-to-day administration becomes faster with built-in generators that turn your cataloged hosts into ready-to-use Ansible inventory files, SSH client configurations, and tag-filtered hosts tables. Line-and-column validation feedback in the web editor catches schema mistakes immediately before changes are committed. Running on a dedicated VPS on RepoCloud with guaranteed CPU, RAM, and SSD, full root SSH access, and a browser serial console. AGPL-3.0 licensed.
Circuit Breaker
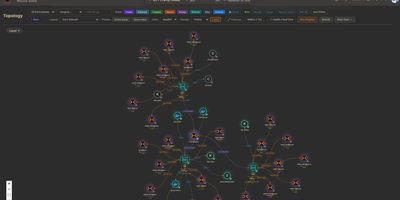
Mapping every physical server, virtual machine, container, and network link across a sprawling homelab into a live interactive canvas, Circuit Breaker gives infrastructure operators real-time topology visualization, IP address management, and rack elevation modeling on a single screen. Operators can switch between hierarchical, concentric, cortex ring, radial, and force-directed graph layouts where animated edges reflect link speeds and color-coded status rings display live hardware health. Automated discovery scans local subnets using nmap, SNMP, and ARP while querying Proxmox VE clusters, TrueNAS storage pools, and UniFi controllers, staging newly detected nodes in a review queue before adding them to the map. For multi-site labs or isolated VLANs, lightweight remote agents connect outbound over Noise-encrypted links after fingerprint approval to report host telemetry and run scoped network scans without opening inbound firewall ports. Rack diagrams let administrators drag servers into U slots with cabling overlays using a built-in catalog covering Dell, HPE, Supermicro, Ubiquiti, MikroTik, Synology, and APC gear alongside live iDRAC, iLO, and UPS metrics. Role-based access control, OIDC single sign-on, TOTP multi-factor authentication, encrypted full-state snapshots, and a SHA-256 hash-chained audit log keep multi-user operations accountable. Running on a dedicated VPS on RepoCloud with guaranteed CPU, RAM, and SSD, full root SSH access, and a browser serial console. MIT licensed.
VictoriaLogs
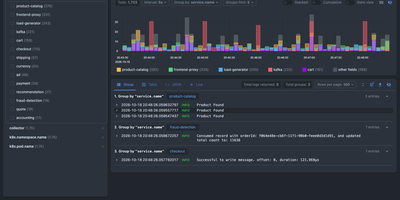
Instead of running an Elasticsearch or Loki cluster, VictoriaLogs stores and searches your logs from a single zero-config server. Ship from Filebeat, Fluent Bit, Fluentd, Logstash, Vector, Promtail, Telegraf, the OpenTelemetry Collector, or the Datadog Agent. Syslog, journald, and Splunk endpoints work too. Query with LogsQL: word, phrase, and prefix filters combine with pipes that extract fields from raw lines and compute stats, top values, and facets. See results as a table, grouped by stream, as raw JSON, or as a live tail. Chart them in Grafana, or work from a terminal with vlogscli and pipe output into grep, less, or jq. Events with hundreds of fields are supported. So are high-cardinality fields like trace_id and user_id. Late, out-of-order backfills are accepted. During an incident, stream_context pulls the lines around any match. Tenants are keyed by AccountID and ProjectID headers. vmalert evaluates LogsQL queries as alerting and recording rules. CEF messages sent over Syslog are parsed automatically for SIEM work. Retention defaults to 7 days and can be capped by disk space. Per-day partitions snapshot and copy out with rsync or rclone. Cluster mode splits ingestion, querying, and storage across nodes for logs that outgrow one server. Running on a dedicated VPS on RepoCloud with guaranteed CPU, RAM, and SSD, full root SSH access, and a browser serial console. Apache 2.0 licensed.
DBackup
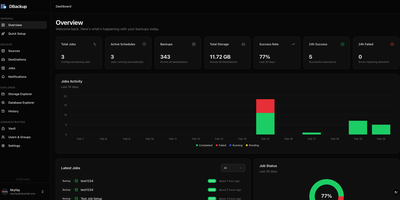
When a bad migration or disk failure strikes at 3 AM, DBackup guarantees that your PostgreSQL, MySQL, MariaDB, MongoDB, SQL Server, Redis, Valkey, SQLite, and Firebird databases, along with the application directories that belong to them, are encrypted, verified, and ready to restore in a few clicks. Connect directly over TCP or tunnel through SSH with zero agents installed on your target servers. Bundle database dumps and Docker volumes or remote SFTP directories into a single atomic job so your schema and uploaded assets always share the exact same recovery point. Every archive is compressed with Brotli or GZIP, sealed with AES-256-GCM encryption before leaving the host, and pushed simultaneously to up to 14 storage backends including Amazon S3, Cloudflare R2, Hetzner, Google Drive, Dropbox, OneDrive, SMB, and WebDAV. Reusable Grandfather-Father-Son retention policies prune daily, weekly, monthly, and yearly snapshots automatically. Need to inspect live tables or recover a single file? Use the built-in Database Explorer, remap a dump into a staging schema, or extract individual files over HTTP byte ranges without downloading the entire archive. Even if your backup server goes offline, the downloadable Recovery Kit decrypts standard SQL dumps and plain TAR archives using a standalone script. Running on a dedicated VPS on RepoCloud with guaranteed CPU, RAM, and SSD, full root SSH access, and a browser serial console. GPL-3.0 licensed.
Karma
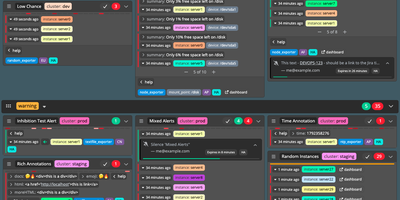
When an alert fires on any of your Prometheus Alertmanagers, Karma shows it once, on one filterable dashboard, and lets you acknowledge or silence it from there. Identical alerts from different servers merge into one entry tagged with every server that saw it, HA pairs included. Groups follow the group_by settings of your Alertmanager routes, and shared labels and annotations collapse into a footer. Multi-grid mode gives each value of a label, or each Alertmanager, cluster, or receiver, its own grid, keeping production and staging apart. Configurable label colors make hosts and severities easy to spot. Optional history draws 24 hourly blocks per group from the Prometheus servers that fired it, and an inhibited alert's muted button lists whatever is suppressing it. One click acknowledges an alert with a short-lived silence, and the separate kthxbye daemon can keep extending it until the alert resolves. The silence modal creates, edits, and expires silences, and ticket IDs in comments can become links. A Dead Man's Switch check raises a visible error when the alerting pipeline goes quiet. Basic auth or a proxy's header identifies each user, silence ACLs stop one team from silencing another's alerts, and read-only mode disables silence management. Default filters open the view your team triages first, and light and dark themes follow the browser. Running on a dedicated VPS on RepoCloud with guaranteed CPU, RAM, and SSD, full root SSH access, and a browser serial console. Apache-2.0 licensed.
ZaneOps
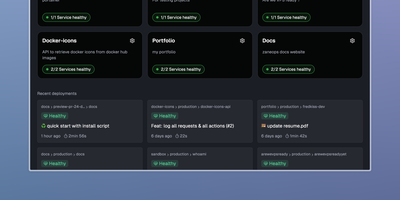
Shipping a Git repository to a live HTTPS URL takes one dashboard and one server with ZaneOps, an open-source alternative to Heroku, Railway, and Render. Linked GitHub or GitLab repositories build with a Dockerfile, Nixpacks, Railpack, or a static directory builder. Deploys start by hand, on git push, or from a CI webhook. Blue/green releases keep the previous version serving traffic while the new one starts. Each pull request or merge request can open its own preview environment, and the API can create one on demand. Configuration edits queue up as changes that you review before a new version deploys. A pasted docker-compose.yml or a ready-made template (Postgres, Redis, WordPress) deploys a whole stack with blue/green rollouts. Every domain gets a free SSL certificate that renews itself. Wildcard hosts, permanent or temporary redirects, and several services under one domain all work. Runtime logs, request logs, metrics, and health checks gather in the dashboard. Services get CPU and memory limits and volumes, and environment variables import or export as .env files. Viewer, Member, Admin, and Owner roles decide who can see and change what; the free tier allows one workspace and three users. A web terminal opens a shell inside any running deployment, and a second one reaches the server itself over SSH. Running on a dedicated VPS on RepoCloud with guaranteed CPU, RAM, and SSD, full root SSH access, and a browser serial console. MIT licensed.
ComposeToolbox
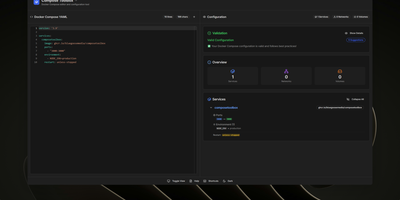
To eliminate YAML indentation errors and cryptic container misconfigurations before running docker compose up, ComposeToolbox pairs a full-featured code editor with a live configuration analyzer in a single self-hostable web workspace. Paste or write any docker-compose.yml file in the left pane to see immediate syntax validation alongside actionable best-practice warnings, such as unpinned latest image tags, missing healthchecks, or deprecated version declarations. On the right side, an interactive Configuration Overview breaks down every defined service, exposed port mapping, persistent volume mount, environment variable, and custom network into structured tabs. Built-in Quick Insert buttons let operators drop new service blocks, volume definitions, or network stanzas into the editor with one click. By mounting the persistent /app/data directory, administrators can define custom quick-insert YAML snippets with selectable hardware and networking icons in custom-templates.yml. Teams can also customize startup-template.yml so the editor opens with their organization's standard homelab or production boilerplate every time the page loads. Keyboard shortcuts, light and dark themes, and one-click YAML formatting or file export streamline daily container authoring. Running on a dedicated VPS on RepoCloud with guaranteed CPU, RAM, and SSD, full root SSH access, and a browser serial console. MIT licensed.
Dock-Dploy
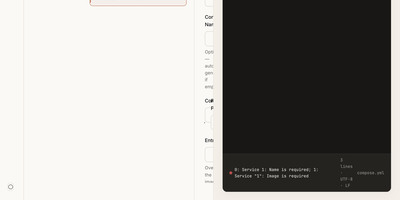
Visual drag-and-drop assembly replaces manual text editing in Dock-Dploy, a Docker Compose builder and configuration management suite that turns complex multi-service container topologies into validated YAML manifests. DevOps engineers and self-hosters can visually assemble application stacks by selecting container base images, defining healthcheck probes, mapping bridge networks, and assigning persistent volume mounts through a reactive web interface. An integrated marketplace catalog allows teams to search, preview, and import battle-tested templates for services like PostgreSQL, Redis, and Nginx with one click. Real-time Zod schema validation inspects every service parameter as you type, flagging port collisions, missing environment variables, and malformed volume syntax before deployment. A split-screen CodeMirror editor provides continuous synchronization between graphic form fields and generated YAML definitions with automatic code sanitization and clipboard exports. Beyond Compose stacks, operators can design blueprint templates, generate reverse proxy routing profiles, and assemble recurring cron schedules for automated backup and maintenance routines. Running on a dedicated VPS on RepoCloud with guaranteed CPU, RAM, and SSD, full root SSH access, and a browser serial console. AGPL-3.0 licensed.
Dockerizalo
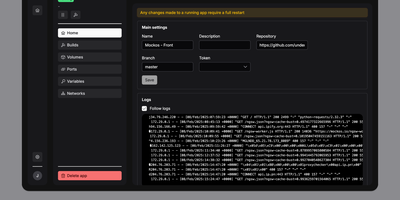
For self-hosters who want Git-driven container deployments without surrendering control of their existing reverse proxy or host networking, Dockerizalo provides a lightweight web platform that clones repositories, builds Docker images, and manages running services from a single dashboard. Point an application entry at any Git-compatible repository or public container registry image, configure custom build paths, and let the platform build and launch the container directly on your host Docker engine. A built-in template library accelerates database provisioning with pre-configured variables, networks, and persistent storage mounts. Through the web interface, operators manage environment secrets, bind-mounted volumes, custom Docker labels, and published TCP or UDP ports while coexisting peacefully alongside Caddy, Nginx, or Traefik setups. Per-application HTTP webhook triggers let teams automate continuous delivery from GitHub, GitLab, Gitea, or custom CI pipelines on every push event. Real-time paginated build and runtime container log streams prevent memory exhaustion on chatty APIs while keeping every deployment event visible. Configurable image retention policies automatically prune older tags and remove dangling images after each rollout so disk space stays clean. Multi-user account management allows homelab administrators to invite collaborators to the dashboard without sharing a single root credential. Running on a dedicated VPS on RepoCloud with guaranteed CPU, RAM, and SSD, full root SSH access, and a browser serial console. AGPL-3.0 licensed.
Velld
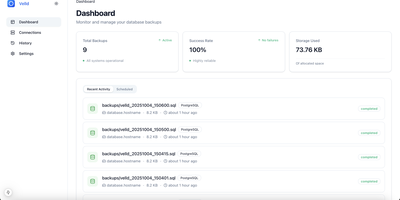
Database administrators and backend engineers managing production PostgreSQL, MySQL, MariaDB, MongoDB, and Redis instances use Velld to centralize scheduled backups, storage retention, and disaster recovery in a single self-hosted control plane. You can register multiple database connections across staging and production environments, test connectivity with one click, and route traffic through encrypted SSH bastion tunnels using password or private-key authentication to reach isolated private subnets. Flexible cron schedules and preset hourly, daily, weekly, or monthly intervals automate snapshot creation, while configurable retention policies purge expired archives from local volumes or S3-compatible object storage buckets after seven, fourteen, thirty, or ninety days. An integrated backup comparison tool renders split or unified line-by-line diffs between any two snapshots so you can inspect schema changes or data drift before triggering a guided database restore or downloading compressed dump files. The real-time monitoring dashboard tracks backup completion rates, total storage consumption, and execution histories alongside automated email and webhook alerts that notify your team immediately if a scheduled job fails. Running on a dedicated VPS on RepoCloud with guaranteed CPU, RAM, and SSD, full root SSH access, and a browser serial console. MIT licensed.