Pinpoint
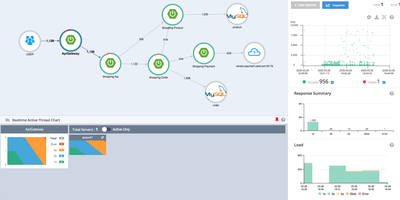
When checkout slows to a crawl somewhere across forty services, Pinpoint draws you the map of what is actually talking to what and where the time went. The ServerMap renders your whole topology live: services, databases, message queues, and external APIs as nodes whose edges carry transaction counts and error rates, so the unhealthy dependency announces itself visually. Click a node and the scatter chart plots every request against its response time; drag across the suspicious cluster and the CallStack opens those exact transactions at code level, method by method, SQL statement by SQL statement, until the bottleneck has nowhere to hide. The Inspector watches each application's CPU, memory, garbage collection, TPS, and JVM arguments, while realtime active-thread charts show stuck work as it happens. Agents attach to Java, PHP, and Python applications without changing a line of code, and applications already instrumented with OpenTelemetry send their traces straight in over OTLP. Group applications into services so each team sees its own Service Map, then arm alarm templates for slow counts, error rates, and thread saturation before users notice. Error Analysis gathers exceptions and error logs grouped by route, and URI metrics rank your hottest endpoints by cost. Running on a dedicated VPS on RepoCloud with guaranteed CPU, RAM, and SSD, full root SSH access, and a browser serial console. Apache-2.0 licensed.
Deploy