Pulse
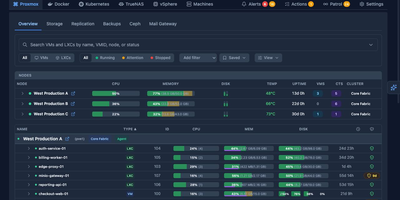
Pulse monitors your entire heterogeneous infrastructure from one screen: Proxmox VE, Proxmox Backup Server, Proxmox Mail Gateway, Docker, Podman, Docker Swarm, Kubernetes, TrueNAS SCALE/CORE, VMware vSphere, and standalone Linux/Windows/macOS machines. The Go binary embeds a SolidJS/TypeScript frontend, delivering WebSocket-driven dashboards with sub-second metric updates on port 7655. A unified agent auto-detects Docker, Podman, Kubernetes, and Proxmox on each host without manual configuration and self-updates silently, while Proxmox nodes need only API credentials with zero agent installation. Smart alerts use adaptive hysteresis-based thresholds to prevent notification floods, pushing to Discord, Slack, Telegram, Teams, email, ntfy.sh, Gotify, and generic webhooks with per-resource overrides. The standout feature is Pulse Patrol: scheduled AI health checks running every ten minutes to seven days using OpenAI, Anthropic, Gemini, or local Ollama models. Patrol catches silent backup failures, capacity creep, restart loops, unhealthy containers, and clock drift that dashboards miss when nobody is watching. Platform-specific views render Proxmox nodes, Ceph clusters, Docker Compose projects, Kubernetes workloads, TrueNAS pools, and vSphere VMs in familiar layouts. OIDC, SSO, and SAML authentication with credential encryption at rest secures access. 6,500+ stars and 441 releases since February 2025. Running on a dedicated VPS on RepoCloud with guaranteed CPU, RAM, and SSD, full root SSH access, and a browser serial console. MIT licensed.
CoreObs
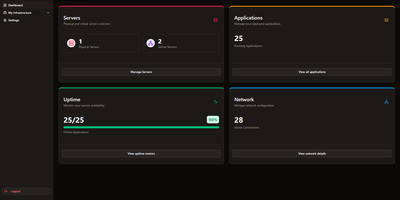
CoreObs delivers a unified self-hosted dashboard that replaces the typical combination of Uptime Kuma, Homer, and separate monitoring tools with a single interface for managing your entire server infrastructure. The Next.js frontend with shadcn components provides a modern dark-themed UI displaying server hardware metrics collected by a lightweight Go agent that leverages Glances for hardware abstraction — streaming real-time per-core CPU load, RAM utilization, NVIDIA GPU statistics, disk usage, system uptime, and load averages via WebSocket connections. The application registry tracks all self-hosted services with configurable uptime monitoring, availability history charts, and instant notifications through Discord, Telegram, Pushover, and email when services go down or recover. Quick-access links provide one-click navigation to each application's management panel directly from the dashboard. The network visualization module built on React Flow enables creating visual topology maps of your infrastructure with drag-and-drop nodes representing servers, switches, and services connected by labeled edges. Server data can be organized with tags, copied between entries, and monitored with configurable pagination and compact view modes. Deploy via Docker Compose with three containers — the Next.js web interface, the Go monitoring agent, and PostgreSQL 17 for persistent storage. Running on a dedicated VPS on RepoCloud with guaranteed CPU, RAM, and SSD, full root SSH access, and a browser serial console. MIT licensed.
Beszel
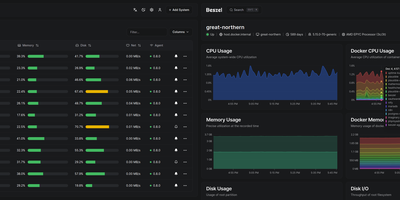
Reaching 24,000 GitHub stars within two years of its first commit in July 2024, Beszel delivers Netdata-grade monitoring dashboards from a single Docker container with no Prometheus stack, no external database, and no complex configuration — just a one-binary hub on PocketBase (SQLite embedded) and a sub-15 MB agent per host that auto-discovers Docker and Podman containers on contact. The agent connects outbound via WebSocket or SSH tunnel, requiring zero open ports on monitored servers and zero manual network configuration. Per-host metrics cover CPU usage, memory with swap and ZFS ARC breakdown, disk I/O across multiple partitions, network throughput, load average, sensor temperatures, battery charge, and GPU utilization with power draw for Nvidia, AMD, and Intel cards — features that competitors lock behind paid tiers. S.M.A.R.T. disk health including eMMC wear indicators and Linux mdraid array status surface hardware degradation before failures occur. Container statistics track CPU, memory, and network history per container with automatic discovery as new containers start. Configurable threshold alerts notify via email, Discord, Telegram, ntfy, Pushover, Gotify, Matrix, Mattermost, Signal, Slack, Microsoft Teams, and Twilio when metrics exceed defined limits. Multi-user accounts with OAuth/OIDC authentication let teams share monitored systems with role-based access, while automatic backups persist data to disk or S3-compatible storage. Running on a dedicated VPS on RepoCloud with guaranteed CPU, RAM, and SSD, full root SSH access, and a browser serial console. MIT licensed.
Nimbus
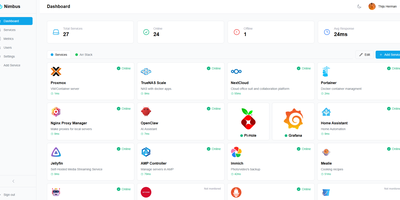
Nimbus is a self-hosted homelab dashboard that turns your scattered pile of services into a polished, organized command center with real-time health monitoring for every endpoint you care about. The dashboard displays live status cards for each registered service, tracking response times down to the millisecond and graphing uptime history so you can spot degradation before it becomes an outage. Health checks run on configurable intervals with smart self-signed certificate handling, meaning your internal services with self-issued TLS do not trigger false alarms. Multi-user support comes standard: local accounts authenticate via JWT, while OAuth2 integration with Google, GitHub, and Discord lets team members sign in with existing credentials. Role-based access control and a built-in admin panel give you granular authority over who sees what. Each user personalizes their view with custom backgrounds, light or dark mode, accent color themes, and drag-and-drop service tile arrangement. Services group into named categories and cards resize to fit your preferred layout, with both grid and list view modes available. Prometheus metrics export feeds your existing Grafana stack, and webhook notifications alert you instantly when a service goes offline. Custom service icons upload directly or auto-fetch from the Dashboard Icons collection. Zero-config Docker deployment gets you running in under 30 seconds with a single docker-compose command. Running on a dedicated VPS on RepoCloud with guaranteed CPU, RAM, and SSD, full root SSH access, and a browser serial console. AGPL-3.0 licensed.
Maintenant
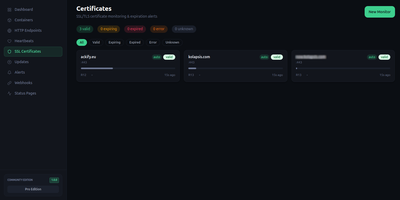
Maintenant replaces three to five separate monitoring tools with a single Go binary that consolidates container discovery, endpoint monitoring, SSL tracking, resource metrics, and public status pages without requiring any external database. The embedded Vue 3 frontend serves on port 8080 immediately after deployment, auto-discovering Docker containers and Kubernetes pods through direct socket and API access without configuration. HTTP and TCP endpoint monitoring validates availability with configurable intervals, while TLS certificate tracking alerts before expiration across all monitored domains. Resource metrics collect CPU, RAM, network throughput, and disk usage per container with real-time Server-Sent Events streaming to the dashboard. Heartbeat and cron monitoring accepts pings from external scheduled jobs, triggering alerts on missed check-ins via webhook callbacks and Discord notifications. The built-in alert engine supports escalation rules and notification batching. Public status pages expose component health to end users without authentication, customizable per monitored service. Network security insights analyze exposed ports, container privilege levels, and host configuration to produce a posture score. Update intelligence scans OCI registries to detect available container image updates with digest comparison. The REST API with SSE broker enables automation, and the integrated MCP server provides tooling for AI assistant integration. SQLite in WAL mode stores all data with zero operational overhead. Running on a dedicated VPS on RepoCloud with guaranteed CPU, RAM, and SSD, full root SSH access, and a browser serial console. AGPL-3.0 licensed.