ByteStash
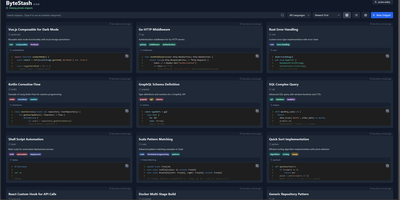
The functions, config files, and one-liners you keep re-deriving finally get a searchable home: ByteStash is a self-hosted code snippet manager - a private Gist. Each snippet holds multiple code fragments, so a Docker Compose file, its .env template, and a plaintext usage note live together under one titled, categorized entry. Monaco-based syntax highlighting covers dozens of languages, from Python, TypeScript, Go, and Rust to YAML, Dockerfiles, Terraform, and Markdown. Retrieval is the point: filter by language or category, search titles and descriptions, and optionally include snippet contents in full-text search. Snippets can be pinned for quick access and shared via public links that recipients open without an account. Multi-user support runs on JWT authentication with optional OIDC single sign-on for teams on centralized identity, and a full CRUD REST API with Swagger documentation wires snippet retrieval into editors, scripts, and CI pipelines. Storage is a single SQLite database with optional encryption, and collections export as JSON or Markdown. A React frontend on a Node.js backend, deployed as one lightweight container.
ShopNex
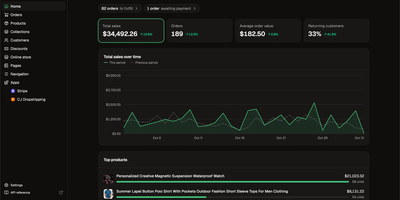
ShopNex is a self-hosted ecommerce platform that gives merchants a browser admin, themeable storefront, hosted checkout, and app integrations without paying a platform subscription or per-sale software fee. You manage products with options, variants, SKUs, stock per variant, collections, product images, and clean URLs, then sell through a bundled Astro storefront using Liquid themes or a custom frontend connected to the typed Storefront SDK. The hosted checkout collects shipping rates, manual payment methods, discount codes, and Stripe Checkout payments, while order records keep payment and fulfillment status, shipping lines, transactions, and price snapshots separate for clean operations. Customer accounts and guest orders are matched by email, staff access is invite-only with owner, admin, and staff roles, and discounts, shipping, taxes, and store settings are controlled from the admin. Integrations receive signed Standard Webhooks with retries and admin redelivery, scoped API tokens grant only the resources an app needs, and OAuth apps clean up tokens and webhooks when uninstalled. You can run one shop by default or switch to multi-shop by domain without migrating data, and every admin and storefront procedure is also exposed as REST under /api/v1 with a live OpenAPI document. Running on a dedicated VPS on RepoCloud with guaranteed CPU, RAM, and SSD, full root SSH access, and a browser serial console. MIT licensed.
Jellystat
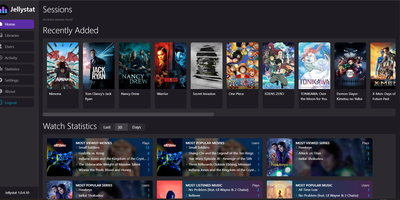
Jellystat is a self-hosted media analytics and live session monitoring dashboard for Jellyfin and Emby servers that turns raw streaming activity into detailed user, library, and playback insights. Media server administrators use the live dashboard to watch active streams in real time, inspecting transcoding status, client devices, bitrates, and playback progress as sessions happen. Every completed or partial stream is logged automatically so you can browse chronological watch histories, filter by library or stream type, and analyze peak concurrent streaming hours across the week. Dedicated library and user views break down total watch duration, play counts, and most popular movies, episodes, or music albums per account. If you already use the official Jellyfin Playback Reporting or Statistics plugins, you can import existing historical records directly into your instance without losing past data. Built-in database backup and restore tools, automatic library synchronization tasks, IP geolocation via MaxMind GeoLite, and interactive Swagger API documentation at the /swagger endpoint round out the administrative toolkit. Running on a dedicated VPS on RepoCloud with guaranteed CPU, RAM, and SSD, full root SSH access, and a browser serial console. MIT licensed.
Watchtower
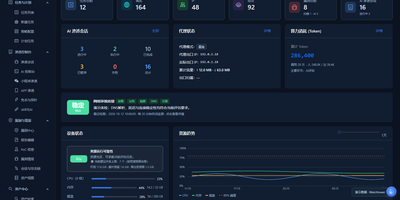
Watchtower puts AI-driven security assessments into one web console, where sessions probe your attack surface while every request, finding, and piece of evidence is captured as it happens. The AI session console follows the attack surface, session progress, tool calls, and findings as an assessment runs, so you can watch an engagement unfold instead of reading a log afterwards. A built-in proxy workflow records HTTP and HTTPS traffic history with highlighted patterns, and any captured request can be sent to the Repeater for editing, replay, and response comparison. Mobile work is covered too: connect phones over USB or wireless, capture app traffic separately from accessibility control, and import WeChat mini-program packages to configure an assessment session. A public vulnerability intelligence library can be searched by component, severity, and source and kept synchronized locally, giving assessments current context without sending your targets anywhere. Findings are managed by source, severity, and status, each linked back to its supporting evidence, and the report editor assembles them with a live preview, impact notes, and remediation guidance. The dashboard tracks assets, tasks, AI sessions, token usage, and runtime resources, and task admission is budgeted against physical memory so heavy scans do not starve the host. Running on a dedicated VPS on RepoCloud with guaranteed CPU, RAM, and SSD, full root SSH access, and a browser serial console. GPL-3.0 licensed.
Vocero CRM
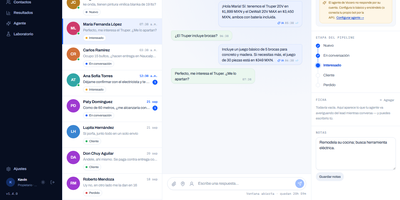
Vocero CRM turns WhatsApp into your sales floor, with a shared team inbox, a visual pipeline, and an AI agent that answers customers using only what your business taught it. Incoming messages land in a three-column inbox within two seconds, showing sent, delivered, and read states, enforcing the official 24-hour window, and offering approved templates when it closes. Every person who writes becomes a contact automatically and enters a Kanban pipeline you can rename, where dragging a card, adding notes, or archiving a lead takes seconds. The AI agent learns from question-and-answer pairs and free-text knowledge blocks, and answers only from what it knows. It bundles message bursts into one reply and hands the conversation to a human whenever the customer asks or the rules say so. Before the agent ever meets a real customer, the Laboratory sends six simulated customers at it, from the decided buyer to the angry one, and an independent judge scores each conversation from 0 to 100 with findings and one-click fixes you can re-test after every change. Owners create team accounts, message templates sync their approval status from Meta, and WhatsApp tokens sit encrypted at rest while every customer record stays on hardware you own. Running on a dedicated VPS on RepoCloud with guaranteed CPU, RAM, and SSD, full root SSH access, and a browser serial console. MIT licensed.
Chief-Onboarding
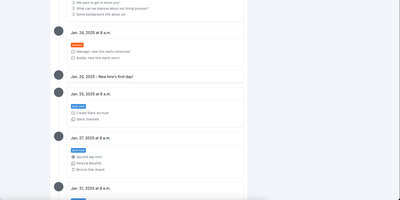
New hires fail from information overload and IT bottlenecks, not lack of goodwill - the observation behind ChiefOnboarding, a free, open-source employee onboarding platform (Django, Celery, PostgreSQL, Redis). Its answer is sequences - drag-and-drop timelines that drip-feed to-do items, resources, courses, forms, and badges to each new hire, triggered by dates or by completing a previous item, so nobody faces everything at once. Onboarding starts before day one: preboarding pages welcome hires early, and colleagues can leave personal messages that appear there. The account provisioning module creates the new hire's Slack, Google, Asana, and other accounts automatically on the scheduled day via a library of integrations plus custom webhooks - the IT ticket queue never gets involved. Everything works through two equivalent interfaces: a full web dashboard and a Slack bot, either usable standalone. Slack can even auto-create new hire accounts when someone joins the workspace and assign default sequences with zero manual action. Colleague tasks with comments and collaboration, a searchable people directory, scheduled introductions, and per-hire timezone awareness (no 3 a.m. notifications) round it out. No trackers, no phoning home - third-party credentials sit in encrypted fields on your server.
LobsterBoard
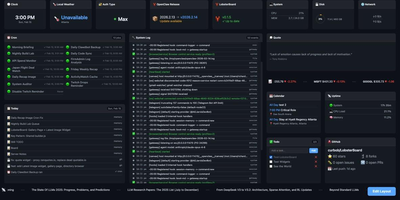
LobsterBoard lets you assemble custom monitoring dashboards from 50 pre-built widgets using a visual drag-and-drop editor, covering everything from CPU and memory gauges to AI subscription trackers, stock tickers, and camera feeds on your own server with zero cloud dependencies. The snap-grid editor handles layout composition with resize handles and a property panel, so you drag widgets onto a canvas, configure their data sources, and the dashboard is live. Real-time system statistics flow through Server-Sent Events, updating CPU load, memory pressure, disk usage, network throughput, and Docker container status without page refreshes. Five built-in themes range from a dark default to a retro CRT terminal aesthetic, a warm sepia paper look, and pastel options for different display environments. The template gallery lets you export complete dashboard layouts with auto-captured screenshot previews, share them with other users, and import configurations as a full replacement or selective merge. Custom pages extend beyond dashboards into notes, kanban boards, or any free-form layout you need. Built-in widgets connect to iCal feeds for calendar events, RSS sources for news aggregation, weather APIs for local conditions, and financial data providers for cryptocurrency and stock prices. The whole system runs from a single server.cjs file with zero cloud dependencies or external frameworks. Running on a dedicated VPS on RepoCloud with guaranteed CPU, RAM, and SSD, full root SSH access, and a browser serial console. BSL-1.1 licensed (free for non-commercial use; converts to MIT in 2030).

Bar Assistant
Turn your scattered collection of liquor bottles and bar tools into a master mixology station with an intelligent digital cellar. Bar Assistant tracks your personal liquor cabinet, inventory levels, and available mixers against a catalog of more than 500 cocktail recipes. The platform calculates exact alcohol by volume ratings, computes ingredient costs per serving, and dynamically highlights every cocktail you can craft with on-hand supplies. Built-in recipe scrapers extract formula details, measurements, and glassware requirements directly from web links, JSON payloads, or YAML files. Multi-bar workspaces allow home mixologists and commercial venues to separate private collections from communal drink menus while handling complex ingredient substitutions, custom infusions, and shopping lists. Integrated Meilisearch indexing powers instant typo-tolerant searches across spirit categories, flavor tags, and cocktail strengths. Visual cocktail cards display high-resolution drink photography, user ratings, glassware requirements, and step-by-step garnish instructions. Deploy Bar Assistant on RepoCloud with dedicated VPS compute, full root SSH credentials, and in-browser console access, backed by an open-source MIT license.
docat
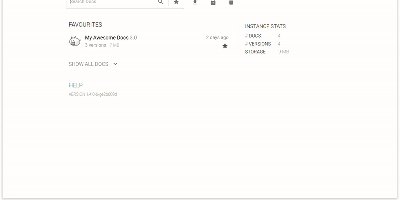
Hosting finished documentation for many projects at once, Docat leaves every uploaded version online for the readers still on version 2. Zip the static HTML that MkDocs, Sphinx, or mdBook produced. Send it to a project and version with curl or the docatl command line client. Tag the newest build as latest, and links get a stable address. Readers land on a home page that opens on starred favourites. A search box narrows the list, and its queries can be shared as links. Instance statistics report documents, versions, and storage. Inside any docs page, a version dropdown with a latest label moves between releases. Uploads are open at first. Claim a project and it returns a token that must accompany every later version upload or deletion. The same token hides versions from the dropdown and from search, and each project can carry its own icon. Operators can mount a small config file for custom header and footer HTML, raise the 100 MB default archive limit with an environment variable, and put nginx basic authentication in front of the write endpoints. Swagger UI and ReDoc pages at /api/docs and /api/redoc document the HTTP API for pipeline authors. Running on a dedicated VPS on RepoCloud with guaranteed CPU, RAM, and SSD, full root SSH access, and a browser serial console. MIT licensed.

OpenReader
With OpenReader, any EPUB, PDF, Word document, Markdown file, or plain text book transforms into an interactive reading workspace paired with natural text-to-speech playback and multi-chapter audiobook export. Documents render natively in their original page layout rather than flattening into plain text, using layout-aware block detection and cross-page stitching so multi-column academic papers, technical manuals, and textbooks flow in the right reading order while skipping headers and footnotes. As narration plays, word-level forced alignment highlights each spoken word directly on the page in real time, and progressive background generation starts audio playback on the first segment while synthesizing upcoming pages ahead of your cursor. Readers can connect local speech engines such as Kokoro, KittenTTS, and Orpheus or cloud voice providers, select language-aware voices for multilingual books, adjust playback speed, and switch among thirteen light and dark reading themes. Cached audio segments persist across seeks and browser reloads, allowing the background worker to assemble complete M4B or MP3 audiobooks for offline listening on mobile devices while syncing reading progress, queues, and library imports across sessions. Running on a dedicated VPS on RepoCloud with guaranteed CPU, RAM, and SSD, full root SSH access, and a browser serial console. MIT licensed.
SEOnaut
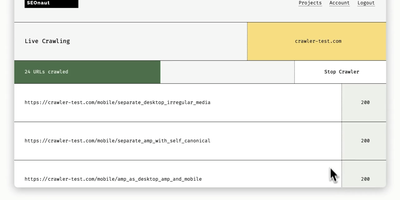
More than 70 automated checks sniff out broken links, redirect chains, and missing meta tags across your whole site, and SEOnaut, the self-hosted SEO audit crawler, sorts every finding into critical, alert, or warning so you know what to fix first. Add a website as a project, press Crawl Now, and watch URLs stream in with their status codes; a Stop button ends any run that wanders off. Reports also cover duplicate titles and descriptions, heading order, hreflang, canonicals, image alt text, thin content, orphan pages, and non-HTTPS URLs, while a passed-checks list shows what is already healthy. Dashboard charts follow crawl history, issue trends, status codes, link types, and page depth. Crawl options are set per project: ignore robots.txt, follow nofollow links, include noindex pages, read the sitemap, allow subdomains, check external links, or authenticate with HTTP Basic to audit a password-protected staging site. Page Details opens any URL with its inlinks, outgoing links, redirections, and images, and URL Explorer searches the crawled pages by term. Export sitemap.xml, CSV lists, or a replayable WACZ archive. Each person picks a light or dark theme and one of five interface languages. Running on a dedicated VPS on RepoCloud with guaranteed CPU, RAM, and SSD, full root SSH access, and a browser serial console. MIT licensed.
CoreObs
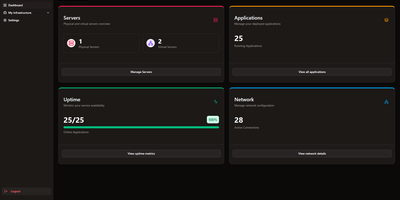
CoreObs delivers a unified self-hosted dashboard that replaces the typical combination of Uptime Kuma, Homer, and separate monitoring tools with a single interface for managing your entire server infrastructure. The Next.js frontend with shadcn components provides a modern dark-themed UI displaying server hardware metrics collected by a lightweight Go agent that leverages Glances for hardware abstraction — streaming real-time per-core CPU load, RAM utilization, NVIDIA GPU statistics, disk usage, system uptime, and load averages via WebSocket connections. The application registry tracks all self-hosted services with configurable uptime monitoring, availability history charts, and instant notifications through Discord, Telegram, Pushover, and email when services go down or recover. Quick-access links provide one-click navigation to each application's management panel directly from the dashboard. The network visualization module built on React Flow enables creating visual topology maps of your infrastructure with drag-and-drop nodes representing servers, switches, and services connected by labeled edges. Server data can be organized with tags, copied between entries, and monitored with configurable pagination and compact view modes. Deploy via Docker Compose with three containers — the Next.js web interface, the Go monitoring agent, and PostgreSQL 17 for persistent storage. Running on a dedicated VPS on RepoCloud with guaranteed CPU, RAM, and SSD, full root SSH access, and a browser serial console. MIT licensed.
PotatoMesh
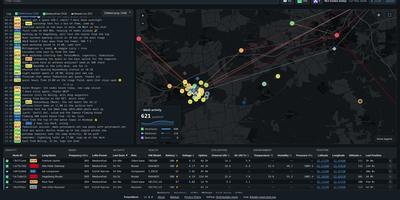
When your community asks what its LoRa mesh is doing right now, PotatoMesh answers with a live map, chat log, and node table built from the traffic your own radios hear. It is a self-hosted dashboard for Meshtastic, Meshcore, and Reticulum networks, with no MQTT clutter. Each node gets a detail page charting battery, voltage, channel utilization, temperature, humidity, and air quality over the past week, plus the neighbors it hears with signal strength and the trace routes it appears in. New nodes and telemetry reports pop up in the chat as they arrive, and a charts page follows telemetry and packets per hour across the whole network. Federation finds other PotatoMesh communities automatically and plots them on a world map with active-node counts per protocol. Ingestors feed the dashboard from radios over serial, TCP, Bluetooth, or passive UDP, and several can report to one instance. Open browsers update live, a Prometheus endpoint exports metrics, and Markdown pages publish your rules, contact details, or legal notice. Add a stop-sign emoji to a node's name to hide it, or switch on private mode to drop the chat entirely. Running on a dedicated VPS on RepoCloud with guaranteed CPU, RAM, and SSD, full root SSH access, and a browser serial console. Apache-2.0 licensed.
Xalgorix
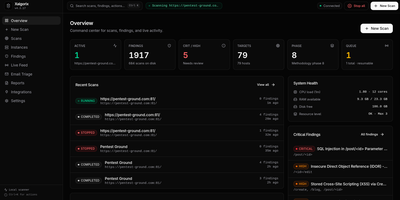
Xalgorix delivers AI-driven penetration testing that proves vulnerabilities exist rather than guessing, pairing an autonomous LLM agent with an independent exploit verifier that re-exploits every finding before it reaches your report. The 22-phase methodology mirrors how a skilled human pentester works through an engagement, covering reconnaissance, subdomain enumeration, port scanning, web crawling, parameter fuzzing, SQL injection testing, XSS detection, authentication bypass, API testing, and more. Select all phases or pick specific ones per target. The platform ships with 85+ offensive security tools preinstalled (nmap, nuclei, httpx, subfinder, katana, ffuf, gobuster, sqlmap, masscan, dalfox, feroxbuster) plus 14 built-in agent tools for browser automation, terminal execution, and note-taking. Connect your own LLM provider (OpenAI, Anthropic, DeepSeek, Gemini, Groq, Ollama, or MiniMax) so no scan data or target information leaves your infrastructure. The web dashboard on port 9137 provides live WebSocket telemetry showing tool calls, agent reasoning, and findings as scans progress. A findings index with CVSS scoring and severity filters organizes results, and branded PDF reports include your company name and logo. Wildcard and multi-target scans handle red team attack-surface mapping, while source-code scanning audits repositories directly without requiring a deployed target. A REST API enables scripted scans and SIEM pipeline integration, and webhooks push notifications to Discord or Telegram. Running on a dedicated VPS on RepoCloud with guaranteed CPU, RAM, and SSD, full root SSH access, and a browser serial console. Apache 2.0 licensed.
MySpeed
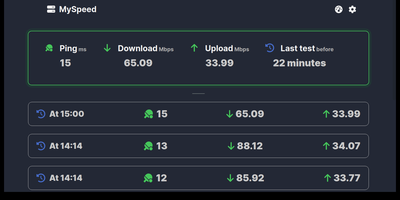
Holding internet service providers accountable for promised bandwidth requires continuous, automated measurement, and MySpeed turns any server into an always-on connection performance analyzer that tracks download speeds, upload throughput, ping latency, and jitter around the clock. Instead of running manual browser tests only when video calls stutter, you can schedule recurring speed checks using custom Cron expressions and switch freely between Ookla, LibreSpeed, and Cloudflare testing servers to verify routing performance across different upstream networks. Interactive statistics views render gradient speed timelines, ping and jitter graphs, hourly performance breakdowns that expose peak-hour congestion, and standard deviation consistency charts, using smart 300-bucket downsampling so multi-month histories load instantaneously. Failed tests are flagged with visual markers on the timeline, while built-in health checks dispatch instant alerts to Discord, Telegram, Signal, WhatsApp, Gotify, email, or custom webhooks whenever bandwidth drops below your target thresholds or outages occur. Administrators can link multiple remote MySpeed instances into a single dashboard to compare bandwidth across branch offices, pause scheduled runs during heavy file transfers, export historical logs, and scrape real-time telemetry into Prometheus and Grafana. Running on a dedicated VPS on RepoCloud with guaranteed CPU, RAM, and SSD, full root SSH access, and a browser serial console. MIT licensed.

Fugleramme
Garden birdsong as a framed collage: Fugleramme draws the species heard right now as hand-cut illustrations from 1800s natural-history plates, for an e-ink panel, a TV, or any browser. The birds come from BirdNET-Go, which can listen on the same machine or elsewhere on the network, so the microphone can stay near the birds while the frame hangs in the living room. Nearly 1200 cut-outs cover over 650 species, none of them AI-generated, and each bird is sized by its real body mass, larger ones toward the centre. The page redraws only when the birds change. Heard nothing in the lookback window? A bare perch appears. Collage mode shows everything heard within a window from 15 minutes to all time, latest-bird mode changes only when a different species calls, and newest-arrival mode holds until a new species turns up. An optional spotlight puts the latest bird in the middle. Spiral or voids layouts rearrange the sheet, and a species limit keeps the most heard or the rarest. Names sit beside the birds or in a poster-style numbered key, in two languages at once from over 40, and a star flags a bird the station has never heard before for its first 24 hours. A web admin page covers display, detector address, and optional password sign-in. Running on a dedicated VPS on RepoCloud with guaranteed CPU, RAM, and SSD, full root SSH access, and a browser serial console. MIT licensed.
portracker
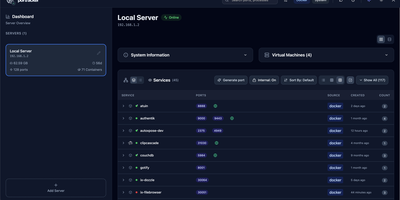
No spreadsheet has to track which service owns which port, because portracker discovers every service and port on your servers and keeps the list current from a self-hosted dashboard. Begin with a single port, shown with its owning service, its source (Docker or the host system), and its address, with internal container ports told apart from ports published to the host. Step back and ports gather into services: expandable cards carrying an icon, a health dot, and a port count, in list, grid, or table layouts, where a Why this status popover names the failing component and the rule that fired. Step back again and each server gets its own panel with hostname, OS, CPU, memory, and uptime, plus TrueNAS apps, VMs, and LXC containers once an API key is added. Step back once more and the whole fleet appears, because other portracker instances can be linked as peers, a VM's instance can be nested under its host, and every server can be searched at once. Along the way, rename services, hide the noisy ones, attach notes, act on a selection in bulk, or press Generate port for an unused number before deploying something new. Optional sign-in with a first-run setup wizard, an autoxpose link that shows public URLs and SSL status, light and dark themes, and keyboard shortcuts finish the picture. Running on a dedicated VPS on RepoCloud with guaranteed CPU, RAM, and SSD, full root SSH access, and a browser serial console. MIT licensed.
ExcaliDash
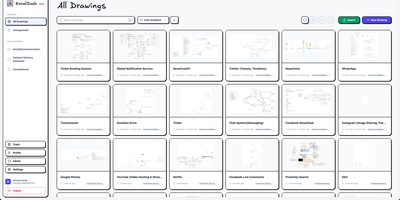
ExcaliDash adds persistent storage, access control, version history, and real-time collaboration to Excalidraw, transforming ephemeral whiteboarding sessions into a managed drawing library your team can rely on. The Node.js/Express backend with React/TypeScript frontend deploys via Docker Compose on port 6767, using Prisma ORM on SQLite for all drawings, users, and metadata. WebSocket-powered collaboration lets multiple users edit the same canvas simultaneously with live cursor presence. Drawing snapshots preserve every revision with visual preview and one-click restore to any previous state. Three authentication modes handle different deployment needs: local email/password for personal use, hybrid mode mixing native credentials with OIDC for gradual enterprise adoption, and enforced OIDC-only for organizations requiring SSO through providers like Authentik or Keycloak. Scoped sharing controls determine whether drawings stay private, shared internally with team members, or accessible via external links without authentication. Collections organize drawings through drag-and-drop grouping, full-text search locates any diagram instantly, and exports use the non-proprietary .excalidraw format ensuring complete data portability. 1,350+ stars since November 2025. Running on a dedicated VPS on RepoCloud with guaranteed CPU, RAM, and SSD, full root SSH access, and a browser serial console. AGPL-3.0 licensed.