Sentry
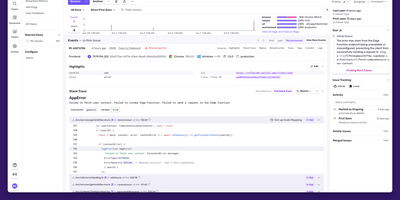
Backed by 44,000 GitHub stars and trusted by over four million developers, Sentry is the debugging platform that captures errors, traces, replays, profiles, and metrics from your applications and connects them all through distributed tracing. The error tracking engine captures full stack traces with source context, breadcrumbs, and automatic demangling for native crashes, while intelligent grouping consolidates duplicate events into actionable issues with regression detection and automatic assignment. Performance monitoring instruments your frameworks automatically, capturing every database query, API call, cache hit, and queue operation as spans within distributed traces that flow across frontend, backend, and mobile boundaries. Session Replay produces video-like recordings of real user sessions showing DOM interactions, network requests, console messages, and errors on a synchronized timeline, with AI-powered summaries that describe what happened without watching the full replay. Continuous profiling captures CPU execution data at the function and line level for Node.js, Python, iOS, and Android, linking slow spans directly to the exact code responsible. Cron monitoring tracks scheduled jobs for failures, missed runs, and duration anomalies. The alerting engine fires notifications through Slack, PagerDuty, Opsgenie, and webhooks on new issues, regressions, error spikes, or when latency and crash-free session rate thresholds are crossed. Self-hosted deployment runs as a Docker Compose stack with PostgreSQL, ClickHouse, Kafka, Redis, and Relay. Running on a dedicated VPS on RepoCloud with guaranteed CPU, RAM, and SSD, full root SSH access, and a browser serial console. FSL licensed.
SigNoz
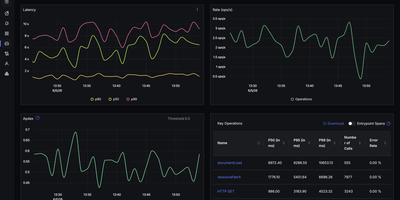
With over 31,000 GitHub stars and native OpenTelemetry support that eliminates vendor lock-in from day one, SigNoz delivers full-stack observability covering metrics, traces, and logs in a single pane of glass without the per-host pricing model of commercial APM platforms. The platform ingests telemetry data through the OpenTelemetry Collector, supporting auto-instrumentation for Java, Python, Node.js, Go, Ruby, PHP, and .NET applications with zero code changes required for basic tracing. ClickHouse serves as the columnar storage backend, providing fast aggregation queries over billions of spans and log lines with configurable retention policies and tiered storage. The distributed tracing view renders flame graphs and Gantt charts showing request flow across microservices with latency breakdowns, error rates, and p99 percentile calculations. Custom dashboards support PromQL and ClickHouse SQL queries with time-series charts, bar graphs, tables, and value widgets. The log management pipeline supports structured and unstructured logs with full-text search, log pipelines for parsing and enrichment, and correlation with traces via trace IDs. Alert rules can be configured on any metric or log query with notification channels including Slack, PagerDuty, OpsGenie, webhooks, and email. The exceptions monitoring module automatically groups and tracks application errors with stack traces, occurrence counts, and first-seen timestamps. Service maps visualize inter-service dependencies with real-time latency and error rate overlays. Running on a dedicated VPS on RepoCloud with guaranteed CPU, RAM, and SSD, full root SSH access, and a browser serial console. MIT licensed with an enterprise edition available.
Jaeger
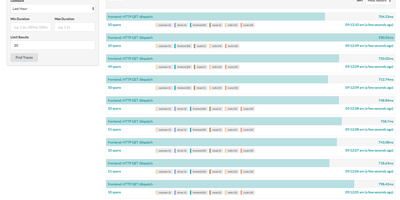
Created by Uber Technologies and graduated as the seventh CNCF top-level project in October 2019 with over 23,000 GitHub stars, Jaeger has become one of the most widely deployed open-source distributed tracing platforms, processing billions of spans per day in production environments at organizations including Uber, Red Hat, and Shopify. Version 2 rebuilt the platform on the OpenTelemetry Collector framework, inheriting its extensible pipeline architecture while implementing Jaeger-specific features as extensions and components, enabling seamless integration with the OpenTelemetry ecosystem through native OTLP protocol support. The platform stores traces in Cassandra 4.0+, Elasticsearch 7.x/8.x, OpenSearch 1.0+, ClickHouse, or the embedded Badger database for development setups. Three sampling strategies control trace volume: head-based sampling with constant, probabilistic, and rate-limiting modes, tail-based sampling using the OpenTelemetry Collector processor that evaluates complete traces before storage decisions, and adaptive sampling that dynamically adjusts probabilities based on observed traffic patterns. Service Performance Monitoring computes RED metrics directly from spans, displaying request rates, error rates, and latency percentiles in the Monitor tab with drill-down from aggregate service views to individual traces. The web UI provides trace search with multi-field filtering, trace detail views with span timeline visualization, trace comparison across services, and dependency graphs mapping service relationships from actual traffic. Deployment options range from a single all-in-one binary for development to distributed collector-ingester-query configurations with Kafka intermediate buffering for production scale. Running on a dedicated VPS on RepoCloud with guaranteed CPU, RAM, and SSD, full root SSH access, and a browser serial console. Apache 2.0 licensed.
Apache HertzBeat
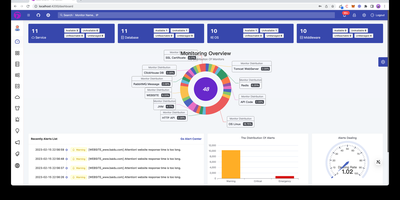
Instead of deploying proprietary background agents across dozens of target nodes, engineers rely on Apache HertzBeat to monitor real-time infrastructure health, metrics gathering, threshold alerting, and public status pages from a central operations platform. Operations teams can poll hundreds of target services without deploying proprietary background daemons, gathering performance data across Linux hosts, Kubernetes clusters, SQL databases, and network switches using native connection protocols. Engineers can define custom monitoring targets directly within the web dashboard by composing declarative YAML templates that specify polling intervals, parsing expressions, and metric extraction rules. The centralized alert engine processes inbound threshold events, suppresses cascading alert storms during maintenance windows, and dispatches actionable incident notifications to Discord channels, Slack rooms, Telegram groups, and webhook endpoints. Telemetry streams flow into interactive charts with customizable refresh cadences, enabling site reliability engineers to inspect latency waterfalls, correlate log spikes against CPU exhaustion, and track disk capacity trends over extended timeframes. Administrators can also publish real-time public status pages that inform external stakeholders about service availability, scheduled downtime, and ongoing incident resolutions. Running on a dedicated VPS on RepoCloud with guaranteed CPU, RAM, and SSD, full root SSH access, and a browser serial console. Apache 2.0 licensed.
OneUptime
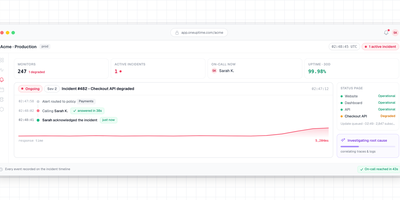
With 7,400+ GitHub stars and a feature set that replaces seven separate SaaS subscriptions — Pingdom for monitoring, StatusPage.io for status pages, PagerDuty for on-call, Incident.io for incident management, Datadog for APM, Loggly for logs, and Sentry for error tracking — OneUptime delivers every tool your reliability team needs in a single open-source platform that is genuinely 100% open source under Apache 2.0 (not open-core). Uptime monitoring runs synthetic checks against websites, APIs, ports, SSL certificates, and DNS records from distributed global probes with configurable intervals and thresholds. Branded status pages publish automatically when monitors detect issues, notifying subscribers via email, SMS, webhook, or RSS without manual intervention during an outage. On-call scheduling routes alerts through escalation policies to the right engineer via phone call, SMS, push notification, Slack, or Microsoft Teams. The incident management workflow handles declaration, triage, communication, resolution, and post-mortem generation in a unified timeline. APM collects traces and metrics via native OpenTelemetry integration — no proprietary agents required — while log management provides full-text search and alerting. An AI agent continuously monitors telemetry data, identifies root causes, and opens GitHub pull requests with proposed fixes for review. Deploy via Docker Compose or Kubernetes Helm charts with a Terraform provider for infrastructure-as-code configuration. Running on a dedicated VPS on RepoCloud with guaranteed CPU, RAM, and SSD, full root SSH access, and a browser serial console. Apache-2.0 licensed.
Coroot
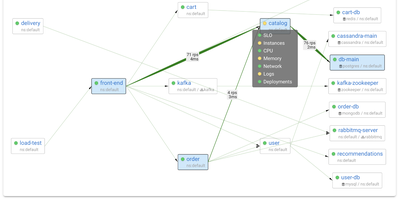
Coroot uses eBPF to capture metrics, distributed traces, logs, and continuous CPU profiles directly from the Linux kernel, delivering full observability without any application code changes, SDKs, or sidecars. From the first minute of deployment, an automatically generated service map covers every microservice, database, message queue, and external dependency with request rate, error rate, and latency measurements. When a service breaches its SLO, AI-powered inspections analyze telemetry across all dimensions to pinpoint the root cause and send a single consolidated alert with findings, replacing the flood of fragmented notifications typical of traditional monitoring. Deployment tracking automatically discovers Kubernetes rollouts and compares each release against the previous one to detect performance regressions, resource spikes, and cost impacts without CI/CD pipeline integration. Continuous profiling captures CPU flame graphs down to the line of code with negligible overhead. Integrated cost monitoring tracks cloud spending across AWS, GCP, and Azure, attributing expenses to individual services and deployments. Coroot supports Prometheus, OpenTelemetry, and ClickHouse as data sources and works identically on Kubernetes clusters, virtual machines, and bare-metal hosts. 7,700+ GitHub stars. Apache-2.0 licensed.
HyperDX
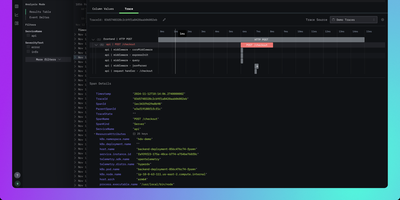
HyperDX correlates logs, metrics, traces, session replays, and errors in a single interface so engineers can resolve production incidents in minutes instead of hours. Nearly 10,000 GitHub stars reflect its role as the integrated UI layer for the ClickStack blueprint endorsed by ClickHouse. The platform connects to any ClickHouse cluster as its storage backend, working with existing table structures without requiring data migration or proprietary ingestion formats. An intuitive Lucene-like search syntax supports full-text queries and property filtering like level:err or service.name:api without needing SQL, while native JSON string querying and event delta analysis surface anomalies in high-cardinality datasets. One-click cross-signal correlation lets you jump from a log line to its distributed trace, from a slow span to associated logs, or from a frontend session replay to the backend errors it triggered. The OpenTelemetry Collector accepts telemetry via OTLP on gRPC port 4317 and HTTP port 4318, supporting automatic instrumentation for Node.js, Python, Java, Go, Ruby, and browser applications. APM tracks HTTP request latency, database query duration, and external service calls with trace waterfall visualizations. Configurable alerts trigger via webhook, Slack, PagerDuty, or email when thresholds are breached. Deploys via Docker Compose with ClickHouse, MongoDB, Redis, and the OpenTelemetry Collector. Running on a dedicated VPS on RepoCloud with guaranteed CPU, RAM, and SSD, full root SSH access, and a browser serial console. MIT licensed.
Moneat
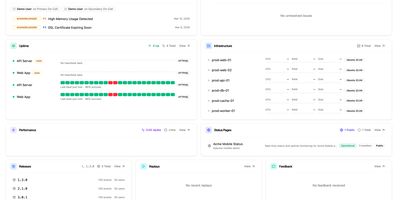
Moneat is the open-source observability platform that unifies error tracking, session replay, performance monitoring, logging, uptime checks, synthetics, product analytics, and AI observability into a single self-hosted application — replacing Sentry, Datadog, and Statuspage with one deployment. The Sentry SDK compatibility layer accepts data from @sentry/browser, @sentry/node, @sentry/react, @sentry/nextjs, sentry-sdk for Python, sentry-kotlin, sentry-java, sentry-android, sentry-cocoa, sentry-go, sentry-ruby, and Sentry.NET by updating one DSN endpoint. Datadog Agent compatibility redirects existing fleets by setting dd_url, and native OpenTelemetry OTLP ingestion accepts logs, traces, and metrics from any exporter or Collector. Error monitoring groups exceptions with smart deduplication, session replay records DOM-based user interactions linked to errors, distributed tracing visualizes transaction and span breakdowns with live service maps, and continuous profiling renders flamegraphs in pprof, JFR, and Sentry formats. Uptime monitoring runs HTTP, TCP, and ping checks with public status pages, while synthetics executes API tests, multi-step workflows, SSL checks, and DNS probes. Custom dashboards support drag-and-drop widgets with Grafana import, product analytics provides funnels and retention cohorts, release tracking surfaces crash-free rates with source map upload, and AI observability traces LLM calls end to end. Built on Kotlin and Java with ClickHouse for analytical storage, PostgreSQL for relational data, and Redis for caching, deployment uses Docker Compose with an interactive installer automating secrets and service orchestration. Running on a dedicated VPS on RepoCloud with guaranteed CPU, RAM, and SSD, full root SSH access, and a browser serial console. AGPL-3.0 licensed.