StackStorm
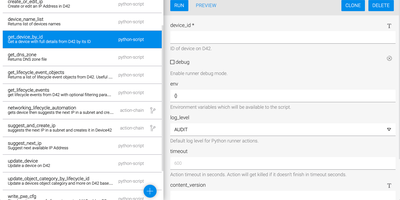
Sensors watch your infrastructure so your engineers do not have to watch it at 3 a.m. StackStorm is event-driven automation: Python sensors poll or listen to external systems (monitoring alerts, ticket updates, chat messages, webhooks, timers) and inject each event as a trigger. Rules match triggers against criteria you define and fire the response automatically, mapping the event payload straight into action parameters. Actions do the work: SSH commands, REST calls, and integrations for AWS, Docker, OpenStack, Puppet, Jira, Slack, and hundreds more from community packs, or your own scripts wrapped with a few lines of metadata. Multi-step responses become workflows that sequence actions with conditions, branching, and data passed between tasks, handling everything from disk-full remediation to full deployment pipelines. Everything bundles into packs, the shareable units that group sensors, rules, actions, and workflows per product or per automation, installable from the StackStorm Exchange or your own Git repositories. The web UI runs actions, explores workflow executions down to individual task results in real time, manages rules, and installs packs, while every execution, manual or automated, lands in an audit trail with its triggering context. ChatOps aliases even let the team trigger approved automations from chat. Running on a dedicated VPS on RepoCloud with guaranteed CPU, RAM, and SSD, full root SSH access, and a browser serial console. Apache-2.0 licensed.
CoreObs
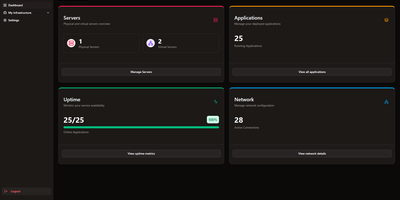
CoreObs delivers a unified self-hosted dashboard that replaces the typical combination of Uptime Kuma, Homer, and separate monitoring tools with a single interface for managing your entire server infrastructure. The Next.js frontend with shadcn components provides a modern dark-themed UI displaying server hardware metrics collected by a lightweight Go agent that leverages Glances for hardware abstraction — streaming real-time per-core CPU load, RAM utilization, NVIDIA GPU statistics, disk usage, system uptime, and load averages via WebSocket connections. The application registry tracks all self-hosted services with configurable uptime monitoring, availability history charts, and instant notifications through Discord, Telegram, Pushover, and email when services go down or recover. Quick-access links provide one-click navigation to each application's management panel directly from the dashboard. The network visualization module built on React Flow enables creating visual topology maps of your infrastructure with drag-and-drop nodes representing servers, switches, and services connected by labeled edges. Server data can be organized with tags, copied between entries, and monitored with configurable pagination and compact view modes. Deploy via Docker Compose with three containers — the Next.js web interface, the Go monitoring agent, and PostgreSQL 17 for persistent storage. Running on a dedicated VPS on RepoCloud with guaranteed CPU, RAM, and SSD, full root SSH access, and a browser serial console. MIT licensed.
OCI Core
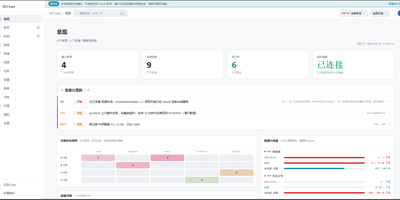
Anyone juggling several Oracle Cloud accounts knows the tab-switching ritual; OCI Core ends it by pulling every tenancy's instances into one self-hosted panel. The cross-account list shows state, shape, volumes, and public IPs for each machine, and you can start, stop, resize, rename, or terminate instances without opening Oracle's console. A creation wizard offers every shape in an availability domain, not just the free presets, while long operations such as IP swaps, resizes, and terminations run as background jobs with visible progress. Capacity hunting watches Oracle's read-only capacity reports and retries creation until a scarce shape appears, notifying you when it lands. Networking tools edit VCNs, subnets, and security rules visually, swap public IPs, enable IPv6, and manage extra network cards. Storage views resize boot and block volumes, and a rescue mode moves a broken system disk to a healthy machine for repair. Billing breaks spend down by service and region, tracks the monthly free egress allowance, and shows real usage for free-tier accounts. Accounts are checked for connectivity, quotas, and credential health, with emails, IPs, and OCIDs masked by default and revealed only on demand. Alerts reach Telegram, WeCom, DingTalk, email, or webhooks, and access is guarded by argon2id passwords, TOTP two-factor sign-in, session controls, and an audit log. Running on a dedicated VPS on RepoCloud with guaranteed CPU, RAM, and SSD, full root SSH access, and a browser serial console. MIT licensed.
PowerDNS-Admin
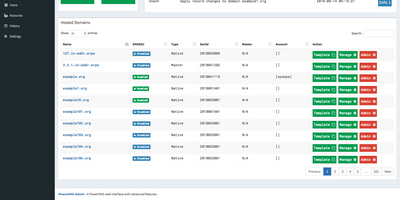
Raw zone files and API calls become something a whole team can operate safely once PowerDNS-Admin puts its web interface in front of a PowerDNS authoritative server. It's a Python/Flask application covering full forward and reverse zone management, with the touches that matter in daily DNS work: zone templates for stamping out consistent new domains, easy IPv6 PTR record editing (reverse zones by hand are misery), full IDN/Punycode support for internationalized domains, and DynDNS 2 protocol support so routers and scripts can update records the way they would against a commercial dynamic-DNS service. Access control is enterprise-grade: local users, LDAP against OpenLDAP or Active Directory, SAML, and OAuth via Google, GitHub, Azure, or OpenID Connect, hardened with TOTP two-factor authentication. Role-based permissions extend to zone-specific access control - hand a developer their project's zone without exposing the rest of your namespace - and activity logging records who changed which record when, the audit trail bare PowerDNS never gives you. The dashboard monitors PDNS service configuration and statistics, and its own API exposes zone and record management for automation on top of the UI. Runs against MySQL/MariaDB or PostgreSQL, talking to PowerDNS through its REST API. MIT-licensed.
Kite
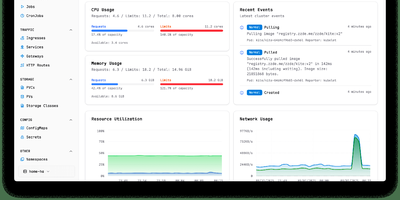
With nearly 3,000 GitHub stars and 14 releases since its June 2025 launch, Kite delivers a lightweight Kubernetes dashboard that replaces the fragmented workflow of switching between kubectl, Lens, and separate monitoring tools with a unified multi-cluster management platform. The dashboard automatically discovers clusters from kubeconfig files and supports independent Prometheus configurations per cluster, providing real-time CPU, memory, and network charts alongside live pod log streaming with filtering and search. A built-in web terminal opens shells directly into pods and nodes without kubectl port-forward, while the Monaco-based YAML editor offers syntax highlighting and validation for in-place resource editing. The integrated AI agent, powered by OpenAI or Anthropic models via native Go SDK integrations, translates natural language into precise client-go API calls — querying cluster health, analyzing pod logs, scaling deployments, patching resources, and cleaning up failed jobs — all operating strictly within the logged-in user's RBAC permissions. Enterprise governance includes OAuth 2.0 single sign-on, multi-factor authentication, FIDO2 passkeys, granular role-based access control with per-namespace permissions, and comprehensive audit logging. Helm chart management enables browsing, installing, and upgrading releases directly from the UI, while the Docker registry integration provides quick image tag selection. Deploy via a single Docker container with SQLite or use the official OCI Helm chart with PostgreSQL or MySQL for production. Running on a dedicated VPS on RepoCloud with guaranteed CPU, RAM, and SSD, full root SSH access, and a browser serial console. Apache 2.0 licensed.
DCM
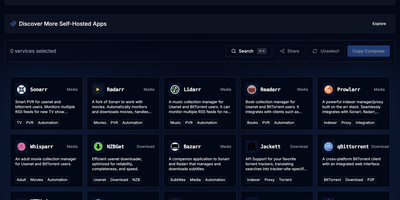
DCM is a visual builder that eliminates docker-compose copy-paste anxiety for home server enthusiasts. The TypeScript and Next.js web interface on port 7576 presents a curated catalog of popular self-hosted applications organized into categories: media management with Jellyfin, Plex, Sonarr, Radarr, and Prowlarr; dashboards like Homarr and Heimdall; databases including PostgreSQL, MariaDB, MongoDB, and Redis; monitoring stacks with Grafana and Prometheus; download clients like qBittorrent and NZBGet; security tools including Vaultwarden; storage solutions like Nextcloud; and home automation via Home Assistant. Select any combination of containers and DCM generates both compose.yaml and .env files with correct volume mounts, environment variables, PUID/PGID ownership, network modes, and port mappings — ready to paste into your terminal. Automatic port conflict detection identifies clashing services and reassigns ports before you ever hit a deployment error. The Template Gallery ships predefined multi-container stacks for common setups: media servers, development environments, database clusters, and monitoring solutions — some incorporating ten or more services in a single template. Built as a static Next.js export served from a 62 MB multi-arch Docker image supporting amd64, arm64, and arm/v7, DCM runs on everything from rack servers to Raspberry Pis. Share generated configurations via URL or download them locally. Running on a dedicated VPS on RepoCloud with guaranteed CPU, RAM, and SSD, full root SSH access, and a browser serial console. AGPL-3.0 licensed.
ZTNET
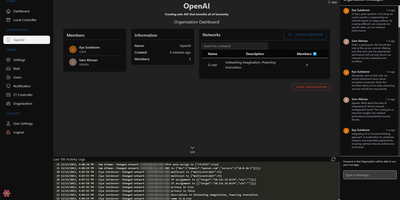
ZTNET provides a polished web dashboard for running your own ZeroTier network controller, covering network creation, member authorization, IP assignment, flow rule editing, and real-time node monitoring entirely from the browser. The organization system supports multi-tenant deployments where teams manage separate network pools with role-based permissions and customizable email notification templates for events like member joins, departures, IP changes, and authorization updates. Each network view displays connected members with their ZeroTier addresses, assigned IPs, last-seen timestamps, physical endpoints, and protocol versions in a clean tabular layout. The admin panel provides platform-wide user management, SMTP configuration for transactional emails, and system-level settings. Built on the T3 stack with Next.js, Prisma ORM, tRPC, TypeScript, and Tailwind CSS with DaisyUI components, the application supports both PostgreSQL and SQLite for persistence and communicates directly with the ZeroTier controller daemon through its native API. Dark and light themes adapt to user preference, and responsive layouts make network management practical from any device. Docker Compose bundles the web application alongside the ZeroTier controller service. Over 100,000 Docker pulls confirm steady community adoption. GPL-3.0 licensed.
Cup
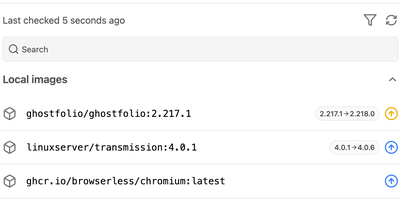
A fast, read-only radar for outdated Docker images. Cup reads the images behind your running Docker or Podman containers, asks each registry whether a newer digest or tag exists, and flags every result as a major, minor, or patch bump, a plain digest change, or up to date. Docker Hub, ghcr.io, Quay, lscr.io, and Gitea-style registries are supported, private ones through token authentication, and checks are designed not to exhaust registry rate limits. The browser dashboard on port 8000 counts monitored, outdated, up-to-date, and unknown images, adds search and filters, and opens any image to show its update type, check time, and a copyable pull command. Prefer automation? Schedule refreshes with a cron expression, trigger one through the API, or run the cup check command from a cronjob for table or JSON output. Rules in cup.json exclude images, ignore registries, and skip chosen update types, even per image. The JSON API feeds Homepage widgets, Home Assistant, and custom dashboards, one dashboard can aggregate several Cup servers, and agent mode serves the API without the interface. Cup only reports, so deciding when to update stays with you. Running on a dedicated VPS on RepoCloud with guaranteed CPU, RAM, and SSD, full root SSH access, and a browser serial console. AGPL-3.0 licensed.
Apprise-API
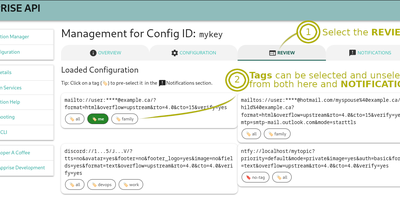
One REST call, 130+ notification services: Apprise API wraps the well-known Apprise library in a lightweight Django/Gunicorn microservice, so "send an alert" works the same whether it goes to Slack, Discord, Telegram, Teams, email, SMS, Pushover, or PagerDuty - each addressed by a simple URL scheme. It solves the credential-sprawl problem cleanly: instead of embedding provider tokens in every app, cron job, and CI pipeline, you centralize them here and everything else just POSTs a body and title. Two modes cover every workflow. Stateless calls to /notify carry target URLs in the payload (or fall back to a default set via APPRISE_STATELESS_URLS); stateful mode stores named configurations server-side under keys, so /notify/{KEY} fans out to everything registered - with tag-based routing (comma for OR, space for AND) selecting which endpoints fire per message. Messages take info, success, warning, or failure types in text, Markdown, or HTML, with attachments up to a configurable size. A built-in web UI manages and tests configurations, APPRISE_CONFIG_LOCK makes the store read-only, service allow/deny lists restrict which schemes work, webhook remapping adapts third-party payloads, and a Prometheus /metrics endpoint watches the gateway itself.
Saki Panel
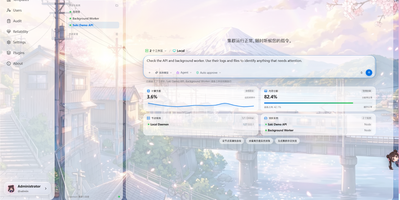
Saki Panel is a self-hosted operations console that manages your game servers, containers, and background processes across multiple Linux machines, with an AI assistant sitting inside the workspace when something breaks. Start, stop, restart, and monitor nine kinds of instances, from Minecraft and Steam game servers to Docker containers, Compose stacks, Node and Python apps, and plain shell commands. Remote nodes connect over SSH and report CPU, memory, and disk metrics to a cluster dashboard, so every machine is visible in one place. When an instance crashes, Saki Watch records the exit and its error fingerprint, then helps diagnose the cause from live logs, files, and metrics instead of making you copy text between a terminal and a chat window. Proposed fixes appear as diffs that need your approval, are graded by risk level, and can roll back automatically if verification fails after a patch. Day to day work happens in the same console: a web terminal, a file manager with an editor and archive support, database tools for SQLite, MySQL, PostgreSQL, and Redis, and cron-scheduled tasks with full run history. Role-based access with dozens of permission codes, audit logs, and incident notifications through webhooks or Telegram keep a small team in control. Running on a dedicated VPS on RepoCloud with guaranteed CPU, RAM, and SSD, full root SSH access, and a browser serial console. Apache-2.0 licensed.
Elasticvue
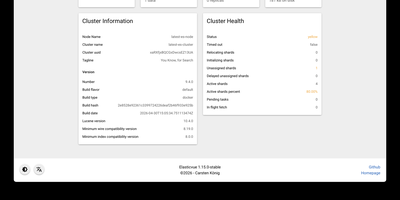
Elasticvue is a graphical interface for Elasticsearch where you can inspect cluster health, browse indices, search and edit documents, and send REST queries. Start on the Home tab, which summarizes status, nodes, shards, indices, document counts, and disk usage. Nodes shows load, CPU, RAM, heap, and disk for each member, and Shards lays out every primary and replica in a grid with a switch for shard allocation. Indices handles creation, aliases, templates, and bulk actions. Search runs query string searches across an index pattern, opens any hit in a JSON editor for updates or deletion, and downloads results as JSON. Rest sends any request from tabbed editors with history, saved queries, and examples, while Snapshots manages repositories and backups. Version 1.16 adds user and role management for Elasticsearch clusters. Secured clusters connect with basic authentication, API keys, or AWS IAM credentials, and the Docker image preloads cluster definitions from an environment variable or a mounted JSON file. Elasticvue supports every Elasticsearch version, even end-of-life releases, and speaks English, Chinese, French, Russian, Japanese, and Italian. Running on a dedicated VPS on RepoCloud with guaranteed CPU, RAM, and SSD, full root SSH access, and a browser serial console. MIT licensed.
DockPanel
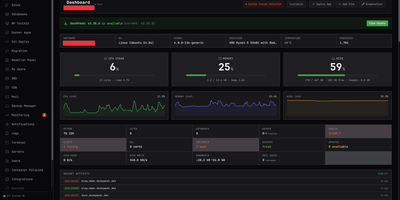
Created in March 2026 and rapidly gaining traction in self-hosting communities, DockPanel delivers the most feature-dense free server panel available — 811 API endpoints, 153 one-click Docker app templates across 14 categories, and full multi-server management, all running on three Rust binaries consuming under 50MB of combined RAM. The panel handles the complete server lifecycle: sites with automatic SSL via Let's Encrypt, MySQL and PostgreSQL databases in Docker containers, Git push-to-deploy using Nixpacks for automatic language detection without Dockerfiles, blue-green zero-downtime deployments with automatic rollback on failed health checks, DNS management, mail servers, monitoring dashboards, and encrypted backups to S3, SFTP, Backblaze B2, or Google Cloud Storage. Security receives production-grade attention with per-image CVE scanning that gates deployments, a built-in WAF, passkey authentication alongside Argon2 password hashing, HttpOnly JWT sessions with blacklist-on-logout, rate limiting on auth endpoints, and fail2ban integration — all verified through an 18-vulnerability pentest with zero remaining issues. Infrastructure as Code support exports your entire server configuration to YAML, and the developer CLI provides status, diagnose, and export commands for automation. GPU passthrough enables AI workload hosting, reseller accounts support white-label branding for agencies, and ARM64 compatibility covers Raspberry Pi and Oracle Cloud free-tier deployments. Running on a dedicated VPS on RepoCloud with guaranteed CPU, RAM, and SSD, full root SSH access, and a browser serial console. AGPL-3.0 licensed.

RocketplaneIO
RocketplaneIO is a self-hosted AI SRE platform that gives Kubernetes clusters zero-instrumentation eBPF observability plus a copilot capable of safely diagnosing and fixing issues without your telemetry ever leaving your infrastructure. Point it at any cluster, and an eBPF DaemonSet starts capturing HTTP, gRPC, SQL, Redis, and Kafka spans across every service, including compiled binaries, with cross-service context propagation and no code changes required. The live service map draws itself from actual network traffic, matching technology logos from container images and coloring each node's health from RED metrics. Every log line sits two clicks from its parent distributed trace, and a PromQL query engine, embedded from the real Prometheus evaluator, runs over ClickHouse for long-term metric retention. The complete Kubernetes inventory (Services, Ingress, ConfigMaps, network policies, persistent volumes, CRDs) syncs continuously and is searchable alongside traces and logs. When the copilot identifies a problem, it picks from a catalog of roughly 30 risk-classified safe actions; each action verifies its preconditions, captures a before-state snapshot, executes, checks the result, and rolls back automatically on failure. Disruptive operations pause for explicit human approval before proceeding. An MCP endpoint exposes the identical guardrailed toolbox to external AI agents, so Claude Code or Cursor can operate the cluster through the same safety boundary the browser copilot uses. Complex remediations compose as searchable, forkable Starlark workflows that compile deterministically at save. Running on a dedicated VPS on RepoCloud with guaranteed CPU, RAM, and SSD, full root SSH access, and a browser serial console. Apache-2.0 licensed.
Icinga 2
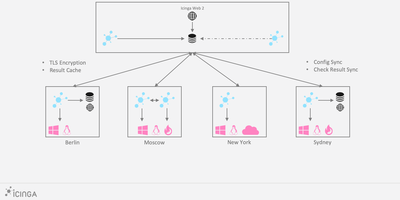
Servers, services, and network gear report their health to Icinga 2, the open-source monitoring core that runs checks, evaluates thresholds, and decides who gets woken up. A distributed hierarchy of master, satellite, and agent zones scales from a single box to global estates: satellites execute checks in remote regions and keep working when the master is unreachable, while agents run local checks under TLS-secured, certificate-based trust. The object-based configuration language defines hosts, services, dependencies, and notification rules as code, with apply rules generating checks across whole groups automatically. Performance data streams into Graphite, InfluxDB, or Elasticsearch writers, and Icinga DB carries runtime state and history into Redis and SQL for the web frontends. The REST API drives acknowledgements, downtimes, and check scheduling from scripts and chat tools, with fine-grained permissions down to diagnostic information. The 2.16 line hardens API security, streams richer runtime updates to Icinga DB for the new Icinga Notifications 1.0 incident workflows, and lets operators set exact acknowledgement times through the API. Running on a dedicated VPS on RepoCloud with guaranteed CPU, RAM, and SSD, full root SSH access, and a browser serial console. GPL-3.0-or-later licensed.
Tugtainer
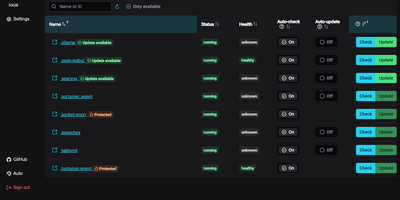
Tugtainer delivers a visual command center for Docker environments that automates container image updates, monitors registry releases, and manages application lifecycles across multiple servers without command-line intervention. System administrators can inspect running containers across all connected hosts, trigger immediate image pulls, and configure automated cron schedules for recurring health and registry checks. Flexible update policies allow teams to flag production databases as notification-only while automatically updating stateless web applications whenever new image tags publish. When updating linked services, the platform analyzes Docker Compose project definitions and custom dependency labels to stop and restart containers in strict dependency order, preventing broken network links and orphaned volume mounts. Administrators can authenticate private container registries, browse image layers and tags, and view real-time container log streams directly within the browser console. Automated pruning jobs continuously reclaim server disk space by deleting obsolete, untagged images and dangling build layers after successful deployments. Multi-channel alerting integrates with over fifty notification providers, delivering real-time update summaries and error warnings directly to Discord, Telegram, Slack, and email webhooks. Running on a dedicated VPS on RepoCloud with guaranteed CPU, RAM, and SSD, full root SSH access, and a browser serial console. MIT licensed.
Cupdate
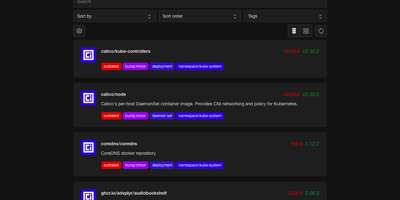
Cupdate keeps a watchful eye on every container image you run, reporting which ones are outdated or vulnerable while deliberately never touching the update button itself. Point it at a Kubernetes cluster, a Docker socket, or Podman hosts (local or remote, one or several) and it inventories every image in use with no configuration to write. Each image is matched against its registry to find the newest available version, and the dashboard shows the gap between what you deployed and what you could be running, with release notes inline so the decision to upgrade takes seconds instead of a changelog hunt. Vulnerability data is layered on top from four sources: Docker Scout for Docker Hub images, Clair for participating Quay images, GitHub Advisories for images tied to repositories, and osv.dev correlation for images shipping SBOMs. A dependency graph explains why each image exists in your stack by showing which workloads pull it, which ends the "can I delete this?" guessing game. Subscribe to the RSS feed to hear about new releases passively, query the REST API to drive scripts that update compose files or kustomizations, or surface outdated and vulnerable counts in a Homepage dashboard widget. Prometheus metrics and traces are available when you want the watcher itself watched. Running on a dedicated VPS on RepoCloud with guaranteed CPU, RAM, and SSD, full root SSH access, and a browser serial console. MIT licensed.
NetsGo
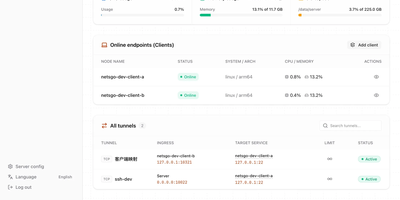
Created to eliminate the configuration fragmentation plaguing multi-device Homelab setups and small-team infrastructures, NetsGo merges what typically requires three separate tools — a tunnel daemon, a management panel, and a monitoring stack — into a single Go binary that starts with one command and listens on one port. The server exposes HTTP, TCP, and UDP tunnels, a built-in Web console for node management, a REST API for automation, and real-time traffic statistics with per-client bandwidth limiting, all sharing default port 9527 so firewalls and reverse proxies need only a single rule. Version 0.1.11 introduced Client-to-Client P2P tunnels via WebRTC DataChannel with three selectable transport strategies — Server relay, Prefer P2P with automatic fallback, and P2P only — reducing latency for direct connections while maintaining the centralized control plane. The management console displays every connected client's online status, authentication tokens, tunnel configuration, active transport mode, P2P candidate gathering progress, and cumulative byte-level traffic counters updated every second. Unlike frp or rathole which delegate management to external plugins or configuration files, NetsGo provides built-in client key generation, tunnel target migration between nodes, SOCKS5 proxying, IP-whitelist console access, and one-command server upgrades. Running on a dedicated VPS on RepoCloud with guaranteed CPU, RAM, and SSD, full root SSH access, and a browser serial console. Apache 2.0 licensed.
Docker Updater
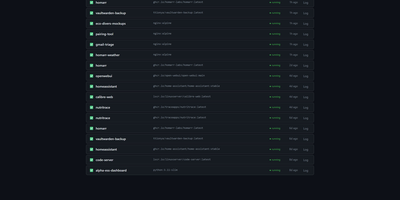
Docker Updater puts you back in charge of container updates: it watches your registries for newer images, and nothing updates until you approve it, so no database restarts itself at dinner. Polls run on a schedule you set, and each container card shows the newer image waiting before anything is pulled. The check costs nothing: it compares the digest your container runs against the registry manifest without pulling a byte, across Docker Hub, GHCR and other Bearer-token registries. Read the last five GitHub releases for an image before committing, update one container or a batch, and watch the pull percentage, layer count and recreation step stream live on the card. If the new container fails to start, the old one returns automatically, and you can keep a backup even after a clean update. Not ready? Defer an update for 7, 14, 30 or 90 days, or indefinitely, and it leaves your notifications alone until then. Several Docker hosts join the same dashboard over SSH or TCP with health indicators, and Compose stacks restart together so services find new addresses. Notifications arrive through an auto-generated ntfy topic or your own Apprise URL, every update keeps a persistent log, and a reclaimable-images view shows what disk space old images hold. The dashboard serves on port 9090 in English or Simplified Chinese, with optional login. Running on a dedicated VPS on RepoCloud with guaranteed CPU, RAM, and SSD, full root SSH access, and a browser serial console. MIT licensed.