Databasus
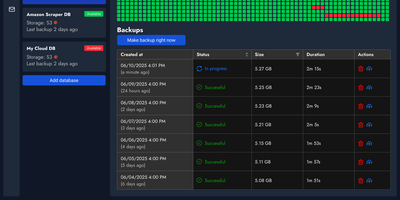
With over 7,500 GitHub stars and 1 million Docker pulls — making it the most popular open-source database backup tool on GitHub ahead of pgBackRest and WAL-G — Databasus delivers production-grade backup management through a designer-polished web interface that replaces complex configuration files and CLI-only workflows. The platform supports PostgreSQL 14-18, MySQL 5.7-8, MariaDB 10-12, and MongoDB 4.2-8 with logical backups via pg_dump and mysqldump, while PostgreSQL 17+ enables physical backups using the native pg_basebackup engine with block-level incremental support via pg_basebackup --incremental and continuous WAL streaming via pg_receivewal for Point-in-Time Recovery to any second between backups. Storage destinations include local disk, AWS S3, CloudFlare R2, Google Drive, Azure Blob Storage, SFTP, NAS, and rclone-backed targets, while built-in AES-256-GCM encryption secures both backup files and stored credentials. Restore verification runs automated recovery into throwaway Docker containers, validating backups by comparing schema counts, table structure, and row counts against the source database — proving recoverability rather than merely checking checksums. The notification system integrates with Slack, Discord, Telegram, email, and webhooks for real-time backup status alerts. Deployment options span a single Docker container, Docker Compose with Caddy for automatic HTTPS, Helm charts for Kubernetes clusters, or a one-line install script. SSH tunnel support reaches databases in closed networks through bastion hosts without public exposure. Running on a dedicated VPS on RepoCloud with guaranteed CPU, RAM, and SSD, full root SSH access, and a browser serial console. Apache 2.0 licensed.
Kopia
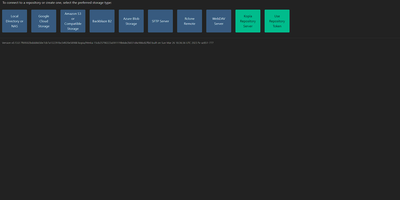
Engineers who have outgrown Duplicati or rsync scripts tend to appreciate Kopia's design: encrypted, compressed, content-deduplicated snapshots in Go, stored in a repository on any storage you control - S3, Google Cloud Storage, Azure Blob, Backblaze B2, SFTP, WebDAV, or a plain filesystem. Encryption is mandatory and end-to-end: every block is encrypted client-side with AES-256-GCM or ChaCha20-Poly1305 using keys derived from your repository password, and even file names never leave the machine in plaintext. Blocks are packed into 20-40 MB blobs with random names, so the storage provider learns nothing about content or structure. Deduplication is automatic and content-based - identical data across files, snapshots, and even multiple machines backing up to the same repository is stored once. Policies govern everything per-directory: compression choice, retention (hourly through annual), scheduling, and ignore rules. Incremental snapshots are point-in-time records you can mount and browse like a filesystem. This deployment runs the Kopia repository server with its web UI, centralizing backups from multiple client machines over an authenticated API - each client connects with the server URL and certificate fingerprint, and users only see their own snapshots. Error correction, high-latency-tolerant caching, and both CLI and GUI round it out.
Yopass
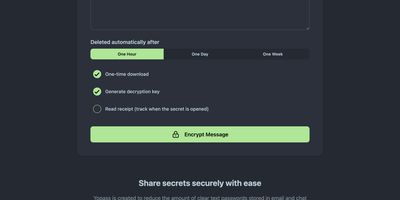
With nearly 3,000 GitHub stars and active development since 2014 through version 14.2.0, Yopass eliminates the universal bad habit of sharing passwords and API keys through Slack messages, email threads, and ticket systems by encrypting secrets entirely in the browser using OpenPGP before anything reaches the server. The Go backend stores only ciphertext — it never sees plaintext — while the React frontend handles all encryption and decryption client-side, generating one-time URLs that self-destruct after a single viewing or when the configured expiration of one hour, one day, or one week passes. File upload support streams encrypted files with configurable size limits, and optional custom password protection adds a second encryption layer beyond the URL-embedded key. The server supports Redis or Memcached as storage backends with automatic key expiration, deploying via Docker Compose in under five minutes or as Kubernetes manifests for production environments. Built-in TLS support works alongside reverse proxy configurations for Nginx, Caddy, and Traefik with automatic Let's Encrypt certificate provisioning. Prometheus metrics expose HTTP request counts, latency histograms, and secret lifecycle counters for Grafana dashboard integration and alerting. Read-only mode enables split-instance deployments separating secret creation from retrieval across different network zones. Multi-language support localizes the interface for international teams. The open-source core under Apache 2.0 provides full self-hosted functionality with no account management required. Running on a dedicated VPS on RepoCloud with guaranteed CPU, RAM, and SSD, full root SSH access, and a browser serial console. Apache-2.0 licensed.
Netdata
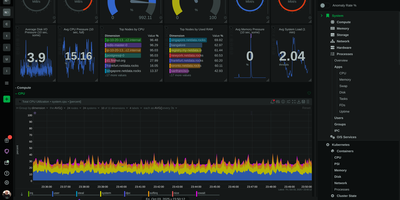
Trusted by millions of engineers and deployed on over 80,000 GitHub stars worth of community confidence, Netdata delivers true real-time monitoring at per-second granularity — 10-60x faster than Prometheus, Datadog, or any conventional monitoring stack that averages away the transient anomalies lasting 2-10 seconds where most production incidents originate. A single installation command deploys the agent with zero configuration, automatically discovering every running process, container, systemd service, network connection, disk, and application on the host within seconds. Unsupervised machine learning trains multiple models per metric directly at the edge, detecting anomalies without thresholds, baselines, or manual tuning. The distributed Parent-Child architecture scales horizontally from a single Raspberry Pi to fleets exceeding 100,000 nodes while maintaining sub-2-second visualization latency and storing metrics at approximately 0.5 bytes per sample through tiered compression. Native network monitoring provides live topology maps, NetFlow and sFlow analytics, SNMP device polling across 200+ profiles, and trap handling — capabilities that typically require a separate NPM product. Hundreds of pre-configured alerts cover systems and applications out of the box, with AI-powered root cause analysis surfacing correlated metrics through natural language via MCP-compatible AI assistants. The agent supports Linux, macOS, FreeBSD, Kubernetes, and Docker with eBPF-based kernel observability requiring no application instrumentation. Running on a dedicated VPS on RepoCloud with guaranteed CPU, RAM, and SSD, full root SSH access, and a browser serial console. GPL v3+ licensed.
Cockpit
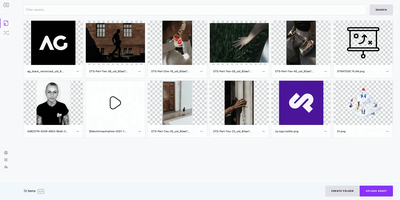
Cockpit puts Linux server administration in a web browser, rendering storage, networking, containers, and virtual machines as visual panels you click through instead of command-line syntax you memorize. It ships in every major Linux distribution and activates through systemd socket activation, consuming zero resources until someone connects on port 9090. What makes it different from other admin panels: every change through the web interface appears instantly at the command line, and every terminal change reflects in the browser in real time. No abstraction layer sits between the UI and the operating system, which means no configuration drift. Storage management covers disk partitioning, RAID arrays, LUKS encryption, LVM volumes, and NFS shares. Network configuration handles bonds, bridges, VLANs, and firewall zones through visual editors. Native Podman integration pulls images, creates containers, manages pods, and provides terminal access into running processes. KVM/libvirt support handles VM creation, cloning, snapshots, and live migration with console access. A built-in terminal provides shell access when the web interface is not enough, and the journal viewer filters systemd logs by severity and unit. Multi-server management connects additional hosts over SSH, presenting a unified dashboard across your entire infrastructure from one browser tab. Runs on a dedicated RepoCloud VPS with full root SSH access and browser serial console. LGPL licensed.
VictoriaMetrics
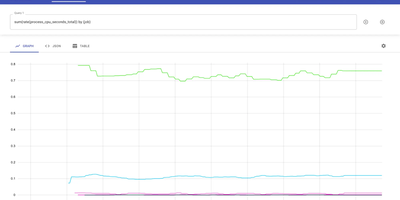
Trusted by thousands of organizations processing billions of time series data points and backed by 17,000+ GitHub stars, VictoriaMetrics delivers a monitoring and time series database that outperforms Prometheus by 16x on query speed while consuming 2.5x less disk space through its optimized compression and storage engine. The architecture supports both single-node deployments handling 10M+ active time series and a horizontally scalable cluster version with vminsert, vmstorage, and vmselect components providing multi-tenancy, replication, and independent namespace isolation. Data ingestion accepts both push protocols including InfluxDB line protocol, Graphite plaintext, OpenTSDB HTTP, CSV, and OpenTelemetry OTLP alongside pull-based Prometheus scraping and remote write, enabling drop-in replacement of existing monitoring stacks without reconfiguring exporters. MetricsQL extends standard PromQL with additional functions, subqueries, and implicit time range alignment while maintaining full backward compatibility with existing Prometheus alerts and Grafana dashboards. The vmalert component processes recording and alerting rules with Alertmanager integration, while vmbackup and vmrestore enable point-in-time snapshots to S3, GCS, and Azure Blob Storage. Stream aggregation operates as a StatsD alternative for pre-aggregating high-cardinality metrics before storage. NFS-compatible storage backends including Amazon EFS and Google Filestore allow shared persistent volumes across cluster nodes. Running on a dedicated VPS on RepoCloud with guaranteed CPU, RAM, and SSD, full root SSH access, and a browser serial console. Apache-2.0 licensed.
HashiCorp Vault
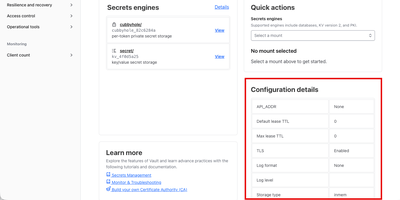
With over 36,000 GitHub stars and adoption by organizations including Adobe, Shopify, and Roblox, HashiCorp Vault is the industry-standard platform for secrets management, encryption services, and privileged access control across hybrid and multi-cloud infrastructure. The key/value secrets engine stores arbitrary secrets with full versioning, soft-delete, and metadata tracking, while dynamic secrets engines generate on-demand, short-lived credentials for AWS, Azure, GCP, databases including PostgreSQL, MySQL, MongoDB, and MSSQL, and SSH access with automatic revocation after configurable lease periods. The PKI secrets engine dynamically issues X.509 certificates on demand with automatic rotation and ACME protocol support, eliminating manual certificate management workflows entirely. Encryption as a service through the transit secrets engine lets applications encrypt, decrypt, sign, verify, and generate HMACs without managing cryptographic keys directly, supporting AES-GCM-256, ChaCha20-Poly1305, RSA-2048/4096, ECDSA-P256/P384, and ED25519 algorithms. Authentication integrates with LDAP, OIDC/OAuth2, SAML, AppRole for machine-to-machine access, Kubernetes service accounts, AWS IAM, Azure Active Directory, and GitHub tokens. Fine-grained ACL policies use path-based rules with glob patterns and sentinel policies for programmatic enforcement. The integrated Raft storage backend provides high-availability clustering without external dependencies, while alternative backends include Consul, S3, DynamoDB, PostgreSQL, and MySQL. The built-in web UI provides a visual interface for browsing secrets, managing policies, configuring auth methods, and monitoring cluster health. Running on a dedicated VPS on RepoCloud with guaranteed CPU, RAM, and SSD, full root SSH access, and a browser serial console. BSL 1.1 licensed.
Dokku
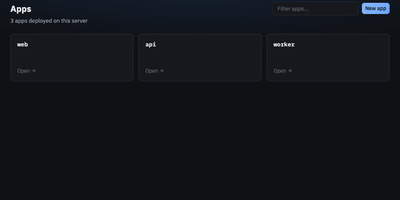
With over 32,000 GitHub stars and a decade of production use since 2013, Dokku is the original self-hosted Heroku alternative — a Docker-powered PaaS that turns any single Ubuntu server into a full application platform with a simple git push. Deploy applications written in Node.js, Python, Ruby, Go, Java, PHP, Scala, and Clojure using Heroku-compatible buildpacks, Cloud Native Buildpacks via pack-cli, standard Dockerfiles, or pre-built Docker images, with automatic language and framework detection handling the rest. Every deployment runs through zero-downtime checks that health-test new containers before routing traffic via the built-in Nginx reverse proxy, which handles virtual host configuration, WebSocket proxying, and HTTP/2 support automatically. The official plugin ecosystem provides managed datastores including PostgreSQL, MySQL, MariaDB, MongoDB, Redis, RabbitMQ, and Elasticsearch, each provisioned with a single CLI command and linked to apps via environment variables. Automated TLS certificates arrive through the Let's Encrypt plugin with auto-renewal, while persistent storage volumes, cron job scheduling, user ACL management, and process scaling round out the platform capabilities. The entire system is CLI-driven — no web dashboard — keeping resource overhead minimal enough to run multiple applications on a $5/month VPS. Dokku also supports Lambda function builds, custom builder plugins, and app.json-based healthcheck configuration for advanced deployment workflows. Running on a dedicated VPS on RepoCloud with guaranteed CPU, RAM, and SSD, full root SSH access, and a browser serial console. MIT licensed.
Pulse
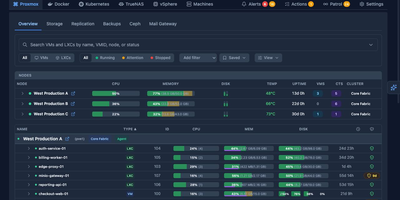
Pulse monitors your entire heterogeneous infrastructure from one screen: Proxmox VE, Proxmox Backup Server, Proxmox Mail Gateway, Docker, Podman, Docker Swarm, Kubernetes, TrueNAS SCALE/CORE, VMware vSphere, and standalone Linux/Windows/macOS machines. The Go binary embeds a SolidJS/TypeScript frontend, delivering WebSocket-driven dashboards with sub-second metric updates on port 7655. A unified agent auto-detects Docker, Podman, Kubernetes, and Proxmox on each host without manual configuration and self-updates silently, while Proxmox nodes need only API credentials with zero agent installation. Smart alerts use adaptive hysteresis-based thresholds to prevent notification floods, pushing to Discord, Slack, Telegram, Teams, email, ntfy.sh, Gotify, and generic webhooks with per-resource overrides. The standout feature is Pulse Patrol: scheduled AI health checks running every ten minutes to seven days using OpenAI, Anthropic, Gemini, or local Ollama models. Patrol catches silent backup failures, capacity creep, restart loops, unhealthy containers, and clock drift that dashboards miss when nobody is watching. Platform-specific views render Proxmox nodes, Ceph clusters, Docker Compose projects, Kubernetes workloads, TrueNAS pools, and vSphere VMs in familiar layouts. OIDC, SSO, and SAML authentication with credential encryption at rest secures access. 6,500+ stars and 441 releases since February 2025. Running on a dedicated VPS on RepoCloud with guaranteed CPU, RAM, and SSD, full root SSH access, and a browser serial console. MIT licensed.
HyperDX
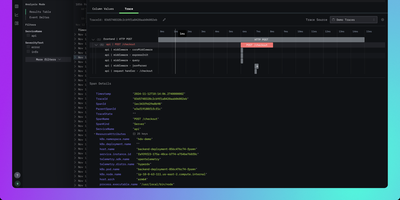
HyperDX correlates logs, metrics, traces, session replays, and errors in a single interface so engineers can resolve production incidents in minutes instead of hours. Nearly 10,000 GitHub stars reflect its role as the integrated UI layer for the ClickStack blueprint endorsed by ClickHouse. The platform connects to any ClickHouse cluster as its storage backend, working with existing table structures without requiring data migration or proprietary ingestion formats. An intuitive Lucene-like search syntax supports full-text queries and property filtering like level:err or service.name:api without needing SQL, while native JSON string querying and event delta analysis surface anomalies in high-cardinality datasets. One-click cross-signal correlation lets you jump from a log line to its distributed trace, from a slow span to associated logs, or from a frontend session replay to the backend errors it triggered. The OpenTelemetry Collector accepts telemetry via OTLP on gRPC port 4317 and HTTP port 4318, supporting automatic instrumentation for Node.js, Python, Java, Go, Ruby, and browser applications. APM tracks HTTP request latency, database query duration, and external service calls with trace waterfall visualizations. Configurable alerts trigger via webhook, Slack, PagerDuty, or email when thresholds are breached. Deploys via Docker Compose with ClickHouse, MongoDB, Redis, and the OpenTelemetry Collector. Running on a dedicated VPS on RepoCloud with guaranteed CPU, RAM, and SSD, full root SSH access, and a browser serial console. MIT licensed.
Sourcebot
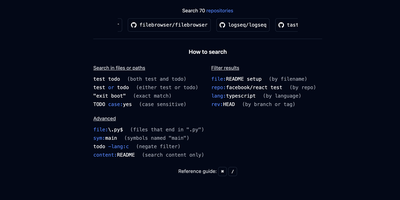
Point Sourcebot at your GitHub, GitLab, Bitbucket, Azure DevOps, Gerrit, or Gitea repositories and get regex, symbol, and filtered search results in under a second across thousands of repos and branches. Backed by Y Combinator with production deployments at NVIDIA, Shutterstock, SeatGeek, Arista, and Red Hat, the Zoekt-powered engine deploys as a single Docker container with zero external data transmission. Ask Sourcebot connects reasoning models like Claude Opus to your entire codebase, enabling natural language questions that return structured answers grounded with inline citations and navigable code snippets, backed by automatic tool calls that search code, follow references, and read files across all indexed repositories. Ask connectors extend this to Jira, Slack, Linear, and Confluence via MCP, pulling external context alongside code for debugging and documentation. IDE-level code navigation provides goto definition and find all references across repository boundaries without local cloning. The built-in file explorer renders any indexed file with syntax highlighting, breadcrumb navigation, and git blame showing per-line commit attribution. An analytics dashboard tracks daily, weekly, and monthly search activity. Permission syncing from GitHub and GitLab enforces access control lists so users only see repositories they are authorized to access. Running on a dedicated VPS on RepoCloud with guaranteed CPU, RAM, and SSD, full root SSH access, and a browser serial console. Other licensed.
Kener
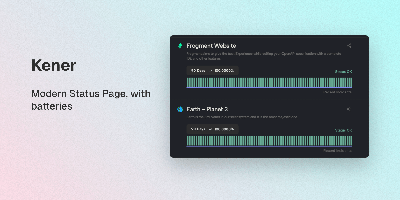
A polished public status page without Statuspage prices or a heavyweight observability suite: Kener is a status and uptime monitoring system built with SvelteKit and Node.js. It runs 11 monitor types - API, Ping, TCP, DNS, SSL certificate, SQL query, Heartbeat, gRPC, and GameDig game-server checks among them - each with configurable intervals and thresholds. Incident management covers the full lifecycle: structured timelines from investigation through resolution, acknowledgements, and subscriber-visible updates, plus maintenance windows with RRULE-based recurring schedules and automatic status transitions. Notifications reach email, Slack, Discord, and custom webhooks through trigger-based workflows with template-driven messaging. One instance can serve multiple branded status pages - per product, team, or region - with custom logos, colors, and CSS, localization into 21 languages, timezone-aware displays, and server-rendered pages that stay fast and SEO-friendly. Operations tooling includes role-based access for teams, API key management, a secrets vault, analytics integrations (Google Analytics, Plausible, Umami, and others), and a REST API with 17+ endpoints for automating incidents and monitors from CI/CD. MIT-licensed; Docker deployment with Redis, SQLite by default, PostgreSQL or MySQL for production.
Unleash
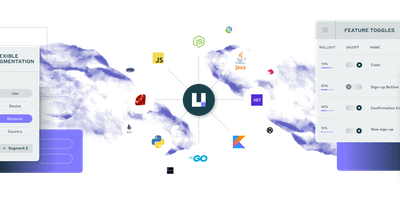
Deployment decoupled from release: Unleash, the most popular open-source feature management platform on GitHub, is a Node.js server backed by PostgreSQL. Ship code dark, then control who sees it through activation strategies: gradual percentage rollouts, targeting by user ID, IP, hostname, or application name, custom constraints against your own context fields, and scheduled or time-limited releases. Strategies stack - a flag activates if any strategy matches - and strategy variants layer A/B versions on top of the on/off decision. Each flag carries per-environment configurations, so a feature can run at 100% in staging while canarying at 5% in production. Backend SDKs (Node.js, Java, Go, Python, Ruby, .NET, PHP, Rust, and more) fetch configuration and evaluate flags locally, so a flag check adds zero network latency to request paths; frontend SDKs for React, Vue, Svelte, iOS, Android, and Flutter evaluate through a proxy layer. Flag hygiene is built in: flags are typed (release, experiment, operational, kill-switch, permission) with expected lifetimes, and Unleash marks overdue flags as potentially stale and surfaces unknown flags your SDKs request but that don't exist. Self-hosting via Docker keeps flag data, targeting rules, and evaluation infrastructure entirely on your side.
Agent Gateway
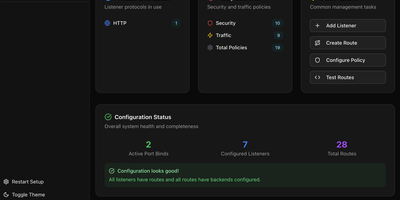
Backed by the Linux Foundation with contributions from AWS, Cisco, IBM, Microsoft, Red Hat, and Shell, Agentgateway is the first data plane built from the ground up for AI agent workloads — providing a unified Rust-based proxy that handles conventional HTTP and gRPC traffic alongside MCP tool servers, A2A agent communication, and LLM inference endpoints through a single deployment. The LLM gateway routes requests to OpenAI, Anthropic, Gemini, AWS Bedrock, and other providers through an OpenAI-compatible unified API with per-tenant budget controls, spend tracking, prompt enrichment, load balancing across multiple model endpoints, and automatic failover when providers experience outages. The MCP gateway federates multiple tool servers behind one endpoint, supporting stdio, HTTP/SSE, and Streamable HTTP transports with built-in OAuth authentication compliant with the MCP auth specification, integrating Auth0 and Keycloak out of the box. OpenAPI integration exposes existing REST APIs as MCP-native tools without code changes, enabling legacy services to participate in agent workflows. Policy-based RBAC controls which agents access which tools, while OpenTelemetry integration provides distributed tracing across agent communication chains. Deploy as a standalone binary with flat YAML configuration or on Kubernetes using the built-in controller with Gateway API support for declarative infrastructure-as-code management. Running on a dedicated VPS on RepoCloud with guaranteed CPU, RAM, and SSD, full root SSH access, and a browser serial console. Apache 2.0 licensed.
Dockge
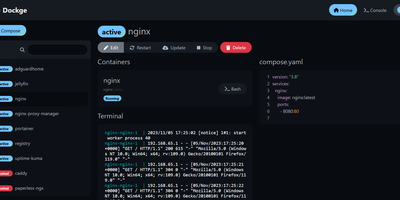
Created by the developer behind Uptime Kuma and carrying over 23,000 GitHub stars, Dockge brings the same clean, reactive design philosophy to Docker Compose stack management with a web interface that makes Portainer's compose handling feel like editing YAML in a terminal over SSH. The interactive editor provides syntax highlighting, inline validation, and a live preview of your compose.yaml files while keeping every stack stored as a standard file on disk in /opt/stacks by default, meaning you can seamlessly switch between the web UI and the docker compose CLI without lock-in or proprietary database formats. Real-time WebSocket updates stream pull progress, container start/stop transitions, and build output directly to the browser with no polling delays. The built-in web terminal opens a shell session inside any running container for quick debugging, while the docker-run-to-compose converter transforms single-container run commands into proper compose.yaml definitions with one click. Multi-agent support introduced in version 1.4.0 connects multiple Docker hosts to a single Dockge dashboard, enabling centralized management of stacks distributed across different servers. Image update detection shows which stacks have newer versions available, and one-click updates pull the latest images and recreate containers without manual intervention. The stack is a single Docker container running on Node.js with Socket.IO for reactivity and stores no external database. Running on a dedicated VPS on RepoCloud with guaranteed CPU, RAM, and SSD, full root SSH access, and a browser serial console. MIT licensed.
GPT Load
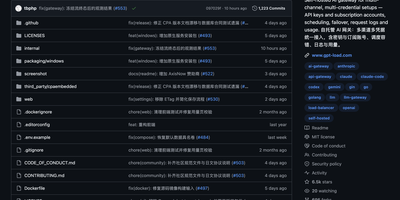
GPT Load has become the go-to self-hosted AI gateway for teams managing multiple LLM provider credentials behind a single URL. The Go-built proxy transparently preserves native API formats for OpenAI Chat Completions, OpenAI Responses, Anthropic Messages, and Google Gemini — applications swap one base URL and keep their existing SDK integration untouched. Twenty built-in channels cover official APIs (OpenAI, Anthropic, Gemini, xAI), cloud platforms (Azure OpenAI, AWS Bedrock, Google Vertex AI), model services (DeepSeek, Moonshot AI, SiliconFlow, Zhipu AI, Alibaba Cloud, Volcengine, OpenRouter, Groq), and subscription accounts (Codex, Claude, Antigravity, Grok) using the same credential management, scheduling, and health system. The intelligent key pool rotates among valid credentials using atomic counters for fair high-concurrency distribution, automatically blacklists failing keys after configurable thresholds, and recovers them via scheduled health checks — all transparent to clients. Weighted load balancing distributes traffic across multiple upstream endpoints while per-credential proxies route individual keys through different egress paths. The Vue 3 management dashboard provides real-time statistics, group configuration, key testing, request logs with full debugging context, per-model cost estimates, and route inspection. Docker deployment exposes the management interface and proxy on port 3001 with SQLite by default, MySQL or PostgreSQL optional, and Redis for distributed leader-follower cluster scaling. Running on a dedicated VPS on RepoCloud with guaranteed CPU, RAM, and SSD, full root SSH access, and a browser serial console. MIT licensed.
KrakenD
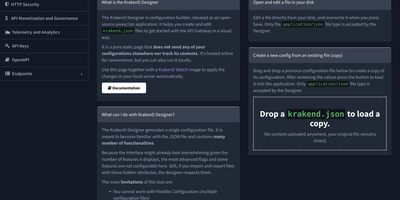
KrakenD processes over 18,000 requests per second on a single instance while consuming under 50MB of RAM at 1,000 concurrent connections, operating as a stateless API gateway that requires no database whatsoever. The Community Edition has earned over 2,600 GitHub stars by outperforming database-dependent alternatives like Kong and Tyk in independent benchmarks. Written entirely in Go, it uses declarative JSON or YAML configuration files that integrate directly into GitOps workflows for version-controlled infrastructure management. The gateway aggregates responses from multiple backend services into a single API call, transforms request and response payloads with field filtering, grouping, and mapping, and applies zero-trust security policies including JWT validation, OAuth 2.0, CORS, HSTS, clickjacking protection, and XSS prevention. Traffic management features include multi-layer rate limiting at both the router and proxy levels, circuit breakers for backend fault isolation, spike arrest policies, and concurrent call support that requests the same data from multiple backends in parallel for improved response times. Telemetry integrates with OpenTelemetry, Prometheus, Grafana dashboards, Datadog, Zipkin, and Jaeger for distributed tracing and metrics collection. The gateway extends through Go plugins, Lua scripting, Martian modifiers, and Google CEL expressions for custom request processing logic. AI workload routing supports OpenAI, Anthropic, Gemini, and other model endpoints with built-in fallback, retries, and load balancing. Deploy via Docker with the devopsfaith/krakend image as a single binary. Running on a dedicated VPS on RepoCloud with guaranteed CPU, RAM, and SSD, full root SSH access, and a browser serial console. Apache 2.0 licensed.
Plandex
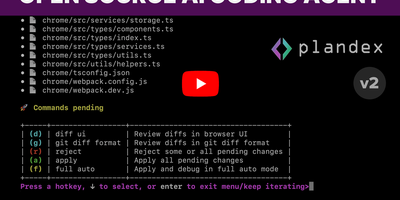
With 15,500 GitHub stars and over 1,100 forks, Plandex delivers a terminal-based AI coding agent purpose-built for the complex, multi-file tasks that overwhelm single-file AI assistants. The Go-powered server maintains a cumulative diff review sandbox that quarantines all AI-generated changes from your project files until you explicitly approve them — enabling 20-file refactors where you cherry-pick good changes and reject bad ones without touching git. A 2M token effective context window loads only what each step requires, while tree-sitter project maps index repositories exceeding 20M tokens across 30+ programming languages, providing structural awareness of class hierarchies, function signatures, and import graphs without burning tokens on full file content. The configurable model pack system assigns different models to different roles — Claude for planning, GPT for coding, Gemini for summarization — supporting Anthropic, OpenAI, Google, OpenRouter, Azure OpenAI, AWS Bedrock, DeepSeek, Perplexity, and Ollama for local models. Full auto mode handles end-to-end autonomous workflows including high-level planning, context loading, implementation, terminal command execution, and automated debugging of both terminal and browser applications. The interactive REPL provides fuzzy auto-complete, version-controlled sandbox branching, rewind to any previous point, and Git integration for commit message generation. The Plandex Server exposes 60+ REST API endpoints for programmatic orchestration across organizations, projects, plans, and branches. Deploy via Docker Compose for self-hosted operation with your own API keys. Running on a dedicated VPS on RepoCloud with guaranteed CPU, RAM, and SSD, full root SSH access, and a browser serial console. MIT licensed.