HashiCorp Consul
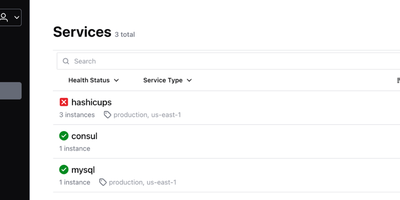
With nearly 30,000 GitHub stars and deployment across organizations including Criteo, Pandora, and Barclays, HashiCorp Consul is the industry-standard platform for service discovery, service mesh, and distributed configuration across dynamic multi-cloud and multi-datacenter infrastructure. Services register themselves and become discoverable via a built-in DNS interface on port 8600 or an HTTP API on port 8500, with health checks ensuring only healthy instances receive traffic through automatic catalog deregistration and service-level circuit breaking. The service mesh capabilities use Envoy sidecar proxies with Transparent Proxy mode to establish automatic mTLS encryption for all service-to-service communication, while identity-based intentions define fine-grained authorization rules controlling which services can communicate. The integrated API Gateway manages north-south traffic into the mesh with configurable routing rules, TLS termination, and header-based matching policies. Consul's distributed key-value store provides hierarchical configuration storage accessible via CLI, HTTP API, and the built-in web UI, with blocking queries enabling watch-based configuration updates without polling. Multi-datacenter federation connects Consul clusters across regions through WAN gossip and RPC forwarding, enabling cross-datacenter service discovery and failover with configurable prepared queries. The Raft consensus protocol provides strong consistency for the service catalog and KV store, with anti-entropy mechanisms ensuring agent state converges with the server catalog. Consul integrates natively with Kubernetes via Helm charts with automatic sidecar injection, Nomad for workload orchestration, Vault for secrets management, and Terraform for infrastructure provisioning. Running on a dedicated VPS on RepoCloud with guaranteed CPU, RAM, and SSD, full root SSH access, and a browser serial console. BUSL 1.1 licensed.
dbx
Universal database administration across modern enterprise infrastructure is simplified through dbx, a lightweight web client and SQL studio supporting over ninety database engines. Database administrators connect to MySQL, PostgreSQL, SQLite, Redis, MongoDB, ClickHouse, DuckDB, Oracle, and Microsoft SQL Server through authenticated network connections and encrypted SSH tunnels. The interactive query editor provides real-time multi-schema autocomplete, syntax linting, execution plan analysis, and natural language SQL query synthesis powered by configurable large language model backends. Teams visualize complex relational database architectures using interactive entity-relationship diagrams that map table foreign key constraints, primary indexes, and table partition layouts automatically. Operators inspect live Redis memory usage breakdowns, monitor real-time server command throughput, and manage key expirations without opening raw terminal sessions. The editable data grid supports multi-row modifications, foreign key reference lookups, CSV and JSON exports, and binary blob data inspection directly inside the browser viewport. Software developers expose connected databases directly to external AI coding assistants through native Model Context Protocol server endpoints. Running on a dedicated VPS on RepoCloud with guaranteed CPU, RAM, and SSD, full root SSH access, and a browser serial console. Apache-2.0 licensed.
Gatus
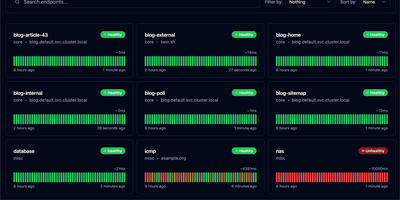
With 11,400+ GitHub stars and active development since 2019, Gatus is the developer-oriented status page and health monitoring tool that ships as a single statically-linked Go binary in a scratch Docker image under 20 MB — deploying in seconds while monitoring your entire infrastructure across 12 protocols from a single YAML configuration file. Define health checks for HTTP, ICMP, TCP, DNS, gRPC, WebSocket, SSH, UDP, SCTP, STARTTLS, and TLS endpoints with conditions that go far beyond simple ping: evaluate response status codes, body content with JSONPath expressions, response time thresholds, certificate expiration days, DNS record values, and IP address ranges. Each endpoint supports independent alerting through Slack, Microsoft Teams, PagerDuty, Discord, Telegram, Twilio, Mattermost, Google Chat, email, Gotify, Pushover, and custom webhook providers with configurable failure thresholds and descriptions. The built-in status page displays uptime badges, response time graphs, and incident timelines with maintenance window support for planned downtime communication. External endpoints accept push-based health reports from services behind firewalls. Prometheus metrics export via the /metrics endpoint enables integration with existing observability stacks. OIDC and Basic Authentication protect the dashboard. PostgreSQL persistence stores historical uptime data. The official Helm chart supports Kubernetes deployment with liveness probes and PVC storage, while a community sidecar auto-generates endpoint configurations from Kubernetes Ingress and HTTPRoute resources. Running on a dedicated VPS on RepoCloud with guaranteed CPU, RAM, and SSD, full root SSH access, and a browser serial console. Apache 2.0 licensed.
ZTNET
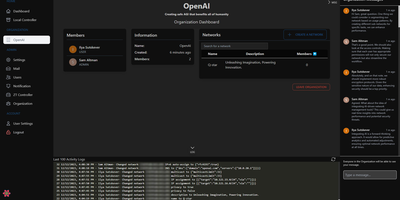
ZTNET provides a polished web dashboard for running your own ZeroTier network controller, covering network creation, member authorization, IP assignment, flow rule editing, and real-time node monitoring entirely from the browser. The organization system supports multi-tenant deployments where teams manage separate network pools with role-based permissions and customizable email notification templates for events like member joins, departures, IP changes, and authorization updates. Each network view displays connected members with their ZeroTier addresses, assigned IPs, last-seen timestamps, physical endpoints, and protocol versions in a clean tabular layout. The admin panel provides platform-wide user management, SMTP configuration for transactional emails, and system-level settings. Built on the T3 stack with Next.js, Prisma ORM, tRPC, TypeScript, and Tailwind CSS with DaisyUI components, the application supports both PostgreSQL and SQLite for persistence and communicates directly with the ZeroTier controller daemon through its native API. Dark and light themes adapt to user preference, and responsive layouts make network management practical from any device. Docker Compose bundles the web application alongside the ZeroTier controller service. Over 100,000 Docker pulls confirm steady community adoption. GPL-3.0 licensed.
Runtipi
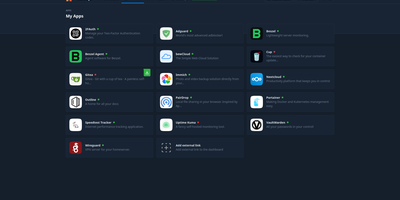
Runtipi makes any Linux server a personal app platform where installing services like Plex, Nextcloud, or Home Assistant takes a single click from a curated store of 265+ applications. With 9,500+ GitHub stars and 50 contributors, the React frontend backed by NestJS orchestrates Docker Compose projects for each installed app, automatically generating environment files, compose configurations, and Traefik reverse proxy labels for domain routing and SSL certificate provisioning via Let's Encrypt. The integrated Traefik reverse proxy handles all incoming traffic routing, HTTPS termination, and forward-auth protection for securing applications behind Runtipi's authentication layer without manual configuration. One-click updates notify administrators of new app versions and apply container image upgrades with automatic pre-update backup creation, while the restore feature rolls back application data to any saved snapshot. Custom app stores extend the ecosystem through Git repositories following the Runtipi app definition format, enabling organizations and communities to maintain private catalogs alongside the official store. The Docker Compose override system preserves user customizations across updates, allowing advanced modifications without losing changes. Architecture-aware filtering detects ARM64 or x86 platforms and displays only compatible applications. All apps deploy as standard Docker containers, and compose files can be exported for independent operation without lock-in. Running on a dedicated VPS on RepoCloud with guaranteed CPU, RAM, and SSD, full root SSH access, and a browser serial console. GPL-3.0 licensed.
Pipelock
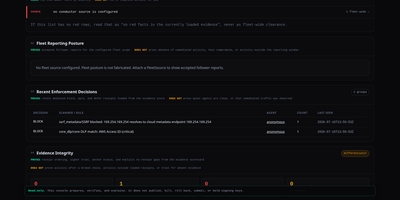
Your AI coding agent has your API keys in its environment and unrestricted network access, which means one prompt injection away from sending those secrets anywhere. Pipelock closes that gap by sitting as a proxy between your agents and every outbound connection, scanning the actual content of HTTP, WebSocket, MCP, and Agent-to-Agent traffic before it leaves your server. An 11-layer scanner pipeline checks every request against 62 credential patterns covering AWS, GCP, Azure, GitHub, OpenAI, Anthropic, SSH keys, and database URLs, then inspects every response for prompt injection using 29 detection patterns with six-pass normalization that catches base64-encoded, leetspeak, and whitespace-obfuscated payloads. The MCP proxy wraps any Model Context Protocol server (stdio, HTTP, or WebSocket) with bidirectional scanning that detects tool description poisoning and mid-session rug-pull changes via SHA-256 fingerprinting. Every scanning decision produces a cryptographically signed action receipt that third parties can verify offline without trusting the agent or the vendor. The Operator Console provides a web dashboard for reviewing evidence scorecards, receipt timelines, agent sessions, enforcement decisions, and fleet posture at a glance. Cross-request taint tracking catches slow-drip exfiltration attempts that spread a secret across multiple calls. Canary tokens plant synthetic secrets that trip alerts the moment an agent tries to exfiltrate them. Pre-built Prometheus metrics and a Grafana dashboard provide real-time visibility into traffic volumes and block rates. Deploy on a dedicated VPS on RepoCloud with guaranteed CPU, RAM, and SSD, full root SSH access, and a browser serial console. Apache 2.0 licensed.
Arcane
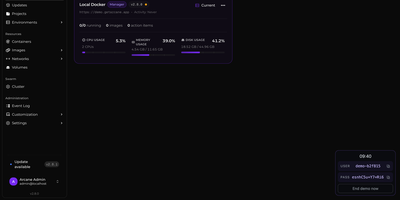
Arcane gives you a single polished dashboard to manage Docker containers, images, volumes, networks, and Compose projects across unlimited remote hosts. The SvelteKit frontend paired with a Go backend delivers real-time resource monitoring with historical graphs, container lifecycle controls including shell exec and live log streaming, and one-click Docker Compose deployment with Git repository synchronization for version-controlled stack definitions. The manager-agent architecture connects remote environments via Direct TCP on port 3553 or Edge mode where agents initiate outbound gRPC/WebSocket connections through NAT and firewalls without requiring inbound ports, all secured with mTLS certificates. Vulnerability scanning identifies security issues in running container images directly from the interface. The backup system enables scheduled container snapshots with configurable retention for disaster recovery. Network and volume administration includes visual relationship mapping between services, and the responsive interface supports dark/light themes with full mobile optimization and community-driven internationalization via Crowdin. 6,500+ stars and 89 releases since April 2025 reflect a rapid development cadence. Running on a dedicated VPS on RepoCloud with guaranteed CPU, RAM, and SSD, full root SSH access, and a browser serial console. BSD-3-Clause licensed.
Apache HertzBeat
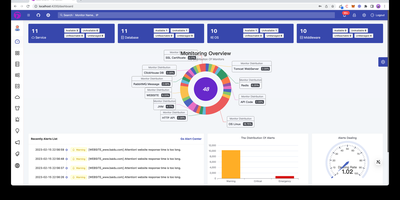
Instead of deploying proprietary background agents across dozens of target nodes, engineers rely on Apache HertzBeat to monitor real-time infrastructure health, metrics gathering, threshold alerting, and public status pages from a central operations platform. Operations teams can poll hundreds of target services without deploying proprietary background daemons, gathering performance data across Linux hosts, Kubernetes clusters, SQL databases, and network switches using native connection protocols. Engineers can define custom monitoring targets directly within the web dashboard by composing declarative YAML templates that specify polling intervals, parsing expressions, and metric extraction rules. The centralized alert engine processes inbound threshold events, suppresses cascading alert storms during maintenance windows, and dispatches actionable incident notifications to Discord channels, Slack rooms, Telegram groups, and webhook endpoints. Telemetry streams flow into interactive charts with customizable refresh cadences, enabling site reliability engineers to inspect latency waterfalls, correlate log spikes against CPU exhaustion, and track disk capacity trends over extended timeframes. Administrators can also publish real-time public status pages that inform external stakeholders about service availability, scheduled downtime, and ongoing incident resolutions. Running on a dedicated VPS on RepoCloud with guaranteed CPU, RAM, and SSD, full root SSH access, and a browser serial console. Apache 2.0 licensed.
Statping-ng
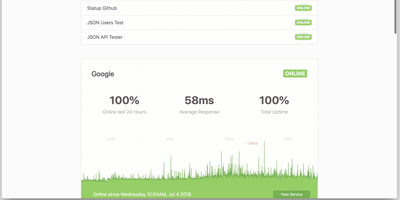
A status page and uptime monitor in one Go binary: Statping-ng - the actively maintained fork of Statping - replaces the UptimeRobot-plus-Statuspage combo with a ~20 MB Docker image using under 50 MB of RAM. It checks services over HTTP, TCP, UDP, ICMP ping, and gRPC health checks on configurable intervals, with per-service timeouts, expected status codes, POST requests with custom JSON bodies, SSL verification, and failure thresholds before alerting. The public status page is the differentiator against plain monitors: visitors see live status, uptime percentages, and latency charts grouped into service categories, with incident announcements and scheduled-maintenance messages you publish from the dashboard - and Sass-based custom styling matches the page to your brand rather than a vendor template. When something fails, notifiers fire immediately: Slack, Discord, Telegram, SMTP email, PagerDuty, Twilio SMS, Pushover, and custom webhooks, each testable before saving. Because notifiers are single Go files, the plugin system makes new channels straightforward. A RESTful API manages services and reads uptime data programmatically, and the free Statping mobile app connects to your server via QR code for on-the-go monitoring. Data persists to SQLite, MySQL, or PostgreSQL. Point it at internal services too - anything the container can reach is monitorable.
Coroot
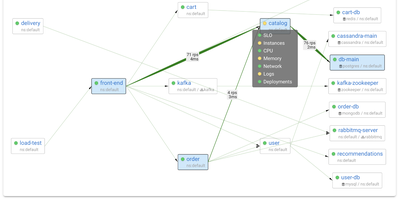
Coroot uses eBPF to capture metrics, distributed traces, logs, and continuous CPU profiles directly from the Linux kernel, delivering full observability without any application code changes, SDKs, or sidecars. From the first minute of deployment, an automatically generated service map covers every microservice, database, message queue, and external dependency with request rate, error rate, and latency measurements. When a service breaches its SLO, AI-powered inspections analyze telemetry across all dimensions to pinpoint the root cause and send a single consolidated alert with findings, replacing the flood of fragmented notifications typical of traditional monitoring. Deployment tracking automatically discovers Kubernetes rollouts and compares each release against the previous one to detect performance regressions, resource spikes, and cost impacts without CI/CD pipeline integration. Continuous profiling captures CPU flame graphs down to the line of code with negligible overhead. Integrated cost monitoring tracks cloud spending across AWS, GCP, and Azure, attributing expenses to individual services and deployments. Coroot supports Prometheus, OpenTelemetry, and ClickHouse as data sources and works identically on Kubernetes clusters, virtual machines, and bare-metal hosts. 7,700+ GitHub stars. Apache-2.0 licensed.
KubeSphere
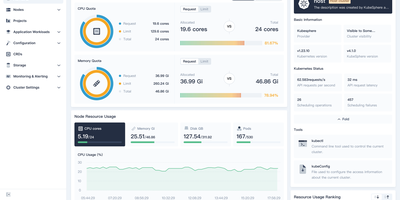
Managing Kubernetes shouldn't require every developer to become a Kubernetes expert — KubeSphere wraps cluster operations, CI/CD, service mesh, and observability into guided web workflows that operations teams configure once and developers consume without kubectl. The LuBan extensible architecture treats each capability as an independently installable extension plugging into a lightweight microkernel: enable DevOps without service mesh, add monitoring without the app store, compose exactly what your organization needs. Multi-cluster management provides a centralized control plane for provisioning and operating clusters across cloud providers, data centers, and edge locations with unified identity and resource quotas. The DevOps extension integrates Jenkins for graphical pipeline creation with S2I and B2I workflows, while Argo CD powers GitOps continuous deployment with real-time sync status. Istio-based service mesh provides traffic management, canary deployments, circuit breaking, and distributed tracing through the console without CLI knowledge. Prometheus monitoring with custom dashboards, Fluentd log collection with multi-tenant search, and alerting via Slack and email complete the observability stack. Multi-tenant workspace hierarchy enforces resource quotas and fine-grained RBAC roles across teams. A built-in Helm-based app store handles lifecycle management across clusters. KubeKey deploys production-grade clusters on bare metal or VMs with air-gapped support. Running on a dedicated VPS on RepoCloud with guaranteed CPU, RAM, and SSD, full root SSH access, and a browser serial console. Apache-2.0 licensed.
Comp AI
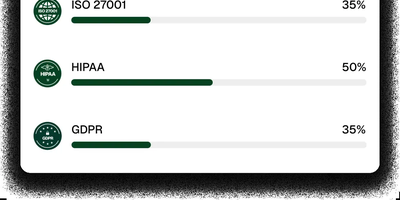
Comp AI turns the months-long slog of SOC 2, ISO 27001, HIPAA, and GDPR certification into a largely automated process by connecting to your existing infrastructure and continuously collecting the evidence auditors actually ask for. Point it at your AWS account, Google Cloud project, GitHub organization, or any of 580+ supported integrations, and autonomous agents pull configuration snapshots, access logs, encryption status, and policy compliance data on a recurring schedule so your compliance posture reflects reality rather than last quarter's manual export. The AI policy engine analyzes your tech stack, team structure, and risk tolerance to generate organization-specific policies for information security, access control, incident response, data retention, and vendor management; no two companies get the same boilerplate. An open-source device agent runs on employee machines checking disk encryption, firewall status, screen lock settings, password length, and antivirus presence around the clock, flagging failures the moment they occur instead of surfacing them during an audit. Built-in penetration testing agents scan your codebase and API endpoints for vulnerabilities like SQL injection and output audit-ready reports. The vendor risk management module scores third-party services and surfaces compliance gaps before they become findings. A public trust center lets prospects verify your compliance status directly, eliminating security questionnaire bottlenecks. Running on a dedicated VPS on RepoCloud with guaranteed CPU, RAM, and SSD, full root SSH access, and a browser serial console. AGPL-3.0 licensed.
Sencho
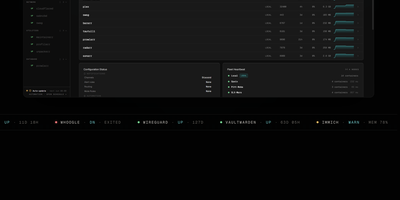
With over 430 GitHub stars and designed for DevOps engineers, platform teams, and homelab operators, Sencho is the self-hosted Docker Compose control plane that gives you a real operational cockpit without abandoning file-on-disk compose workflows. The web dashboard provides live CPU, memory, and disk sparklines per container, one-click start/stop/restart controls, and a Monaco-powered YAML editor with syntax highlighting, inline diff, and one-click rollback. Compose files remain the source of truth on the host filesystem. Multi-node management connects remote Sencho instances via authenticated HTTP and WebSocket proxy using long-lived API tokens, with no SSH access or exposed Docker sockets required. The Pilot Agent establishes an outbound-only WebSocket tunnel for nodes behind NAT, CGNAT, or strict firewalls. Blueprints define compose intent once and deploy it across label-targeted nodes, with drift detection keeping the fleet aligned. Fleet Federation provides cordon and pin controls for maintenance windows, while Fleet Actions execute bulk deploy, stop, and restart operations by stack label across the entire infrastructure. The security suite includes Trivy vulnerability scanning, deploy enforcement policies, SARIF and SBOM export, and Fleet Sync to replicate scan policies across replicas. Additional capabilities include 199+ one-click app templates, Git source integration, atomic deploys with auto-rollback, auto-heal, scheduled operations, webhooks, and custom S3 off-site backups to MinIO, R2, B2, or AWS. Running on a dedicated VPS on RepoCloud with guaranteed CPU, RAM, and SSD, full root SSH access, and a browser serial console. AGPL-3.0 licensed.

Flagsmith
With over 6,400 GitHub stars, 130 contributors, and 512 releases, Flagsmith is the open-source feature flag and remote configuration platform that gives development teams granular control over feature releases, remote configuration values, user segmentation, and A/B testing from a single self-hosted dashboard. Feature flags support boolean toggles and remote config values simultaneously — every flag carries both an enabled state and a configurable value, letting teams deploy functional and visual changes without code modifications or app store approvals. User segments target audiences by attributes, percentage rollouts, and custom rules, enabling beta testing, canary releases, and gradual feature rollouts with real-time toggle control. Multivariate flags split traffic across multiple variations with configurable percentage weights for A/B and multivariate testing with analytics integration. The flag evaluation engine runs server-side with local evaluation mode in SDKs for sub-millisecond performance without network calls, supporting 15+ languages including TypeScript, Python, Java, C#/.NET, Go, Ruby, PHP, Swift, Kotlin, Flutter, React, and Next.js. The REST API and webhooks enable integration with CI/CD pipelines, and pre-built connectors exist for Datadog, New Relic, Amplitude, Mixpanel, Segment, Heap, Rudderstack, and Slack. Built on Django with a React frontend, self-hosting deploys via Docker Compose with PostgreSQL, or via Helm charts and the OpenShift Operator for Kubernetes environments. Change history provides a complete audit trail of flag modifications. Running on a dedicated VPS on RepoCloud with guaranteed CPU, RAM, and SSD, full root SSH access, and a browser serial console. BSD-3-Clause licensed.
ToolHive
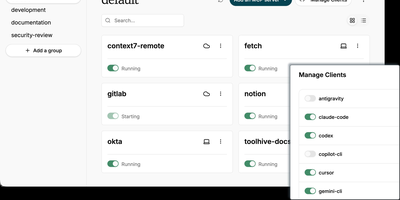
ToolHive is an open-source MCP server management platform that lets you run, secure, and orchestrate Model Context Protocol servers in isolated containers, giving AI agents structured access to tools like GitHub, databases, and cloud services without exposing host credentials or network. Every server launches inside its own sandboxed container with a minimal permission file, network access filtering, and encrypted secrets management, preventing misbehaving connectors from reaching beyond their defined scope. The built-in registry provides a catalog of vetted servers you can install with one command, while custom images and package-manager references let you onboard proprietary connectors without writing Dockerfiles. Platform teams deploy the Kubernetes operator to declare MCP servers as cluster resources using Custom Resource Definitions, with automated lifecycle management and multi-namespace isolation. The Virtual MCP Server gateway aggregates multiple backends behind a single endpoint, centralizing OIDC authentication, tool filtering, and composite cross-server workflows so clients connect once instead of juggling separate URLs. An MCP Optimizer analyzes tool schemas via semantic search and surfaces only relevant tools per request, cutting token consumption by up to 85%. OpenTelemetry traces and Prometheus metrics deliver full visibility into tool execution, latency, and request audit trails across every managed server. Running on a dedicated VPS on RepoCloud with guaranteed CPU, RAM, and SSD, full root SSH access, and a browser serial console. Apache 2.0 licensed.
Laminar
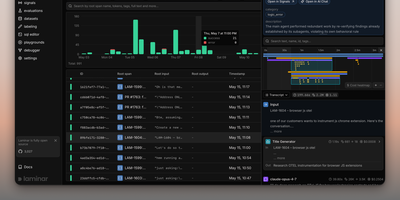
Backed by Y Combinator (S24) and processing traces from thousands of AI agents in production, Laminar is the open-source observability platform that treats agent debugging as a first-class engineering discipline rather than an afterthought. Its OpenTelemetry-native SDK auto-instruments Vercel AI SDK, LangChain, OpenAI, Anthropic, Gemini, Browser Use, Stagehand, Mastra, Pydantic AI, and the OpenAI Agents SDK with a single line of code, capturing every LLM turn, tool call, and sub-agent delegation as nested spans with full input/output data and token costs. The Signals engine lets you describe failures in plain language — "agent is stuck in a loop" or "tool returned empty results" — then reads every trace and alerts via Slack when it detects a match. A built-in debugger records runs and replays them from cache so each iteration takes seconds, designed for Claude Code, Cursor, or Codex to drive the repair loop via the MCP server or CLI. Run code-first evaluations in Python or TypeScript locally or in CI/CD pipelines, build datasets from production traces, and query everything with raw SQL through custom dashboards, the in-app editor, or your coding agent. The Rust backend delivers 20x trace compression, a custom real-time streaming engine, ultra-fast full-text search, and gRPC ingestion, while ClickHouse powers columnar analytics and PostgreSQL stores application state. Running on a dedicated VPS on RepoCloud with guaranteed CPU, RAM, and SSD, full root SSH access, and a browser serial console. Apache 2.0 licensed.
Bitwarden
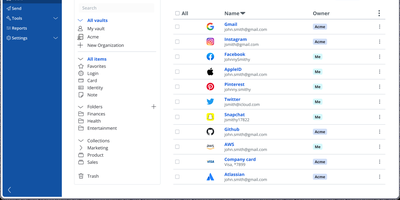
Backed by nearly 20,000 GitHub stars and ranked number one in G2's Enterprise User Satisfaction for eleven consecutive quarters, Bitwarden is the open-source password manager trusted by millions worldwide. The zero-knowledge encryption architecture ensures all vault data — passwords, passkeys, credit cards, identities, secure notes, and file attachments — is encrypted exclusively on client devices using AES-256 with PBKDF2-SHA256 or Argon2id key derivation and RSA-2048 for organization key exchange. Cross-platform clients span a web vault, browser extensions for Chrome, Firefox, Safari, Edge, Opera, Vivaldi, and Brave, native desktop apps for Windows, macOS, and Linux, mobile apps for iOS and Android, and a CLI for scripting. Bitwarden Send enables time-limited, password-protected sharing of text and files, while the built-in TOTP authenticator generates two-factor codes alongside stored credentials. Enterprise deployments integrate with identity providers through SAML 2.0 and OpenID Connect SSO, automate provisioning via SCIM or Directory Connector supporting LDAP, Active Directory, Azure AD, Okta, and OneLogin, and enforce security policies with custom roles and granular permissions. Emergency access allows designated contacts to request vault view or takeover through configurable waiting periods with cryptographic key exchange. The Secrets Manager stores API keys, tokens, and infrastructure credentials with native GitHub Actions, GitLab CI/CD, Ansible, and Terraform integrations. Running on a dedicated VPS on RepoCloud with guaranteed CPU, RAM, and SSD, full root SSH access, and a browser serial console. AGPL-3.0 licensed.
Mira
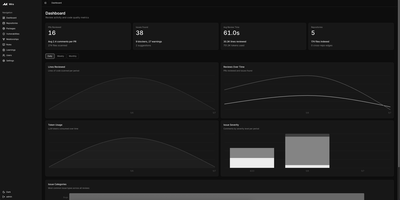
The fastest tool on the public Martian Code Review Bench at 77 seconds per PR with competitive F1 scores — while every higher-scoring competitor takes 5 to 14 times longer — Mira is the fully open-source AI code reviewer that ships the entire feature surface other tools gate behind per-seat subscriptions: indexed PR reviews with full-repo context, streaming walkthroughs posted within seconds, inline vulnerability scanning from hourly OSV.dev polls, org-wide package inventory answering "which repos use [email protected]?" in one query, interactive dependency graphs with blast-radius SVG rendering via ReactFlow, a learning loop that synthesizes rules from rejected comments and human review patterns on merged PRs, and cost telemetry showing actual spend per repo and per model. Unlike CodeRabbit, Greptile, and GitHub Copilot code review which are SaaS-only with per-seat pricing, Mira runs as a single Docker image on your infrastructure with your LLM key through OpenRouter (fronting Anthropic, OpenAI, Google Gemini, DeepSeek) or direct to Ollama and vLLM for fully air-gapped deployments. The engine indexes Python, TypeScript, Go, Rust, Java, C/C++, C#, Swift, Kotlin, Scala, and PHP with per-file symbol extraction, enabling multi-file reasoning across diffs rather than isolated line-by-line review. Integrates with GitHub, GitLab, and Forgejo via webhook with full feature parity. Running on a dedicated VPS on RepoCloud with guaranteed CPU, RAM, and SSD, full root SSH access, and a browser serial console. Apache 2.0 licensed.