Swetrix
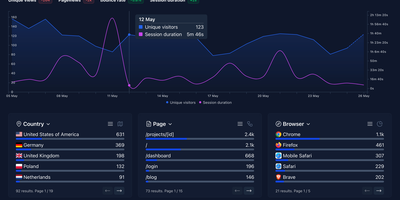
Traffic analytics, real-user performance monitoring, and client-side error tracking - normally three tools - in one cookieless, privacy-first dashboard: Swetrix. The Community Edition ships the same core engine as the cloud product - a NestJS API with ClickHouse for high-volume event storage, MySQL for relational data, and Redis for caching, fronted by a React dashboard and a ~5 KB tracking script with official packages for 20+ frameworks including Next.js, WordPress, and Shopify. Traffic analytics cover pageviews, referrers, UTM campaigns, geolocation, sessions with page flows, funnels, and custom events - all anonymized server-side with no cookies, no cross-device tracking, and no consent banner required for GDPR compliance. Performance monitoring records real-user metrics per pageview: TTFB, DNS and TLS timing, and render times, so regressions surface in the same place as traffic. Error tracking captures unhandled JavaScript exceptions automatically with formatted stack traces, filename/line metadata, affected browsers and pages, first/last-seen timestamps, and a resolve workflow - replacing a separate error monitoring subscription for many teams. Alerts fire to email, Slack, Telegram, Discord, or webhooks on traffic spikes, new errors, and custom events. If Plausible covers your traffic questions but you also want to know why the site broke, Swetrix answers both.
MeshCentral
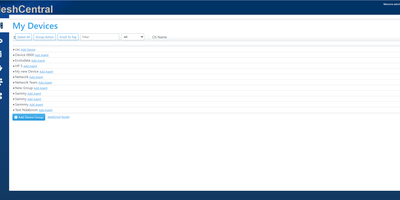
With over 7,000 GitHub stars and continuous development since 2017 by former Intel engineer Ylian Saint-Hilaire, MeshCentral has become the go-to self-hosted alternative to ConnectWise Control and Splashtop for managing devices remotely without per-seat licensing fees. The Node.js server installs via a single npm command and manages Windows, macOS, Linux, and FreeBSD endpoints through lightweight agents that maintain persistent WebSocket connections for real-time remote desktop, terminal access, and file transfer directly in the browser. Intel AMT integration provides out-of-band hardware management including power control and BIOS access even when the operating system is unresponsive. Device groups organize endpoints by location, customer, or function with granular role-based access control for multi-technician environments. Session recording captures remote desktop interactions for compliance auditing, while Wake-on-LAN powers on machines remotely across subnets. The server supports MongoDB for production deployments handling thousands of agents or the embedded NeDB for smaller setups under 200 devices, with a single 8GB VPS comfortably managing 1,500 concurrent agents. Security features include mandatory TLS with automatic Let's Encrypt certificate provisioning, multi-factor authentication via TOTP and FIDO2, SAML-based single sign-on, IP filtering, and HashiCorp Vault integration for secrets management. The web console provides real-time device monitoring with hardware and software inventory, network topology visualization, and customizable branding. TacticalRMM uses MeshCentral as its remote access layer. Running on a dedicated VPS on RepoCloud with guaranteed CPU, RAM, and SSD, full root SSH access, and a browser serial console. Apache-2.0 licensed.
Jaeger
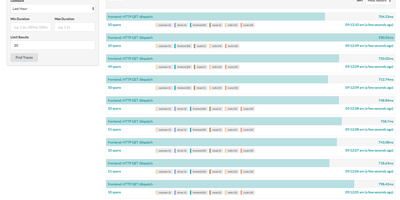
Created by Uber Technologies and graduated as the seventh CNCF top-level project in October 2019 with over 23,000 GitHub stars, Jaeger has become one of the most widely deployed open-source distributed tracing platforms, processing billions of spans per day in production environments at organizations including Uber, Red Hat, and Shopify. Version 2 rebuilt the platform on the OpenTelemetry Collector framework, inheriting its extensible pipeline architecture while implementing Jaeger-specific features as extensions and components, enabling seamless integration with the OpenTelemetry ecosystem through native OTLP protocol support. The platform stores traces in Cassandra 4.0+, Elasticsearch 7.x/8.x, OpenSearch 1.0+, ClickHouse, or the embedded Badger database for development setups. Three sampling strategies control trace volume: head-based sampling with constant, probabilistic, and rate-limiting modes, tail-based sampling using the OpenTelemetry Collector processor that evaluates complete traces before storage decisions, and adaptive sampling that dynamically adjusts probabilities based on observed traffic patterns. Service Performance Monitoring computes RED metrics directly from spans, displaying request rates, error rates, and latency percentiles in the Monitor tab with drill-down from aggregate service views to individual traces. The web UI provides trace search with multi-field filtering, trace detail views with span timeline visualization, trace comparison across services, and dependency graphs mapping service relationships from actual traffic. Deployment options range from a single all-in-one binary for development to distributed collector-ingester-query configurations with Kafka intermediate buffering for production scale. Running on a dedicated VPS on RepoCloud with guaranteed CPU, RAM, and SSD, full root SSH access, and a browser serial console. Apache 2.0 licensed.
Kite
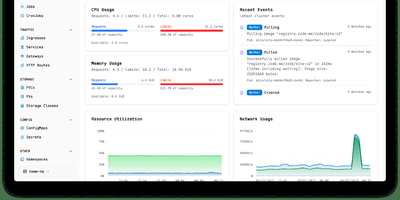
With nearly 3,000 GitHub stars and 14 releases since its June 2025 launch, Kite delivers a lightweight Kubernetes dashboard that replaces the fragmented workflow of switching between kubectl, Lens, and separate monitoring tools with a unified multi-cluster management platform. The dashboard automatically discovers clusters from kubeconfig files and supports independent Prometheus configurations per cluster, providing real-time CPU, memory, and network charts alongside live pod log streaming with filtering and search. A built-in web terminal opens shells directly into pods and nodes without kubectl port-forward, while the Monaco-based YAML editor offers syntax highlighting and validation for in-place resource editing. The integrated AI agent, powered by OpenAI or Anthropic models via native Go SDK integrations, translates natural language into precise client-go API calls — querying cluster health, analyzing pod logs, scaling deployments, patching resources, and cleaning up failed jobs — all operating strictly within the logged-in user's RBAC permissions. Enterprise governance includes OAuth 2.0 single sign-on, multi-factor authentication, FIDO2 passkeys, granular role-based access control with per-namespace permissions, and comprehensive audit logging. Helm chart management enables browsing, installing, and upgrading releases directly from the UI, while the Docker registry integration provides quick image tag selection. Deploy via a single Docker container with SQLite or use the official OCI Helm chart with PostgreSQL or MySQL for production. Running on a dedicated VPS on RepoCloud with guaranteed CPU, RAM, and SSD, full root SSH access, and a browser serial console. Apache 2.0 licensed.
Glance
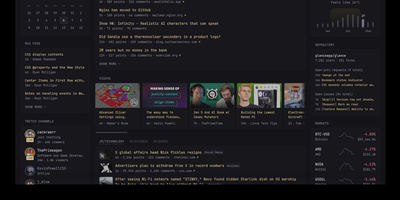
With over 35,000 GitHub stars in just two years, Glance has become the most popular self-hosted dashboard project on GitHub, outpacing established alternatives like Homarr and Homepage. Built as a single Go binary under 20MB with minimal JavaScript and zero external dependencies, Glance delivers a blazing-fast personal information dashboard that consolidates your entire digital morning routine into one beautiful page. Configure everything through clean YAML files that support modular includes and environment variable interpolation, with automatic hot-reload that applies changes without restarting the server. The widget ecosystem covers RSS and Atom feeds, Reddit and Hacker News frontpages, YouTube channel subscriptions, GitHub release timelines, weather forecasts from Open-Meteo, stock market quotes, Docker container status, Twitch live streams, calendar events via iCal, site monitor uptime checks, and custom HTML or iframe embeds. A community widgets repository extends functionality even further with user-contributed integrations. The theming system provides light, dark, and custom color schemes with multiple layout options including slim and wide column configurations. Authentication support added in 2025 secures access with username and password protection. Preconfigured page templates let you get started in seconds with curated layouts for development, homelab monitoring, news reading, and entertainment tracking. Deploy via Docker Compose or as a standalone binary on Linux, macOS, or Windows across AMD64 and ARM64 architectures. Running on a dedicated VPS on RepoCloud with guaranteed CPU, RAM, and SSD, full root SSH access, and a browser serial console. AGPL-3.0 licensed.
OneUptime
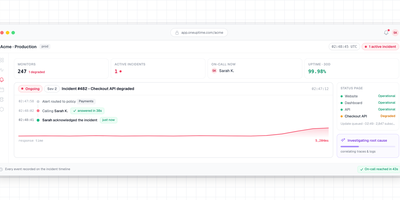
With 7,400+ GitHub stars and a feature set that replaces seven separate SaaS subscriptions — Pingdom for monitoring, StatusPage.io for status pages, PagerDuty for on-call, Incident.io for incident management, Datadog for APM, Loggly for logs, and Sentry for error tracking — OneUptime delivers every tool your reliability team needs in a single open-source platform that is genuinely 100% open source under Apache 2.0 (not open-core). Uptime monitoring runs synthetic checks against websites, APIs, ports, SSL certificates, and DNS records from distributed global probes with configurable intervals and thresholds. Branded status pages publish automatically when monitors detect issues, notifying subscribers via email, SMS, webhook, or RSS without manual intervention during an outage. On-call scheduling routes alerts through escalation policies to the right engineer via phone call, SMS, push notification, Slack, or Microsoft Teams. The incident management workflow handles declaration, triage, communication, resolution, and post-mortem generation in a unified timeline. APM collects traces and metrics via native OpenTelemetry integration — no proprietary agents required — while log management provides full-text search and alerting. An AI agent continuously monitors telemetry data, identifies root causes, and opens GitHub pull requests with proposed fixes for review. Deploy via Docker Compose or Kubernetes Helm charts with a Terraform provider for infrastructure-as-code configuration. Running on a dedicated VPS on RepoCloud with guaranteed CPU, RAM, and SSD, full root SSH access, and a browser serial console. Apache-2.0 licensed.
Databasus
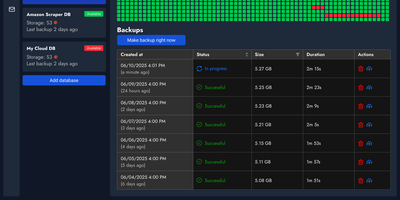
With over 7,500 GitHub stars and 1 million Docker pulls — making it the most popular open-source database backup tool on GitHub ahead of pgBackRest and WAL-G — Databasus delivers production-grade backup management through a designer-polished web interface that replaces complex configuration files and CLI-only workflows. The platform supports PostgreSQL 14-18, MySQL 5.7-8, MariaDB 10-12, and MongoDB 4.2-8 with logical backups via pg_dump and mysqldump, while PostgreSQL 17+ enables physical backups using the native pg_basebackup engine with block-level incremental support via pg_basebackup --incremental and continuous WAL streaming via pg_receivewal for Point-in-Time Recovery to any second between backups. Storage destinations include local disk, AWS S3, CloudFlare R2, Google Drive, Azure Blob Storage, SFTP, NAS, and rclone-backed targets, while built-in AES-256-GCM encryption secures both backup files and stored credentials. Restore verification runs automated recovery into throwaway Docker containers, validating backups by comparing schema counts, table structure, and row counts against the source database — proving recoverability rather than merely checking checksums. The notification system integrates with Slack, Discord, Telegram, email, and webhooks for real-time backup status alerts. Deployment options span a single Docker container, Docker Compose with Caddy for automatic HTTPS, Helm charts for Kubernetes clusters, or a one-line install script. SSH tunnel support reaches databases in closed networks through bastion hosts without public exposure. Running on a dedicated VPS on RepoCloud with guaranteed CPU, RAM, and SSD, full root SSH access, and a browser serial console. Apache 2.0 licensed.
Netdata
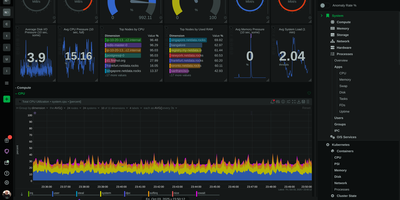
Trusted by millions of engineers and deployed on over 80,000 GitHub stars worth of community confidence, Netdata delivers true real-time monitoring at per-second granularity — 10-60x faster than Prometheus, Datadog, or any conventional monitoring stack that averages away the transient anomalies lasting 2-10 seconds where most production incidents originate. A single installation command deploys the agent with zero configuration, automatically discovering every running process, container, systemd service, network connection, disk, and application on the host within seconds. Unsupervised machine learning trains multiple models per metric directly at the edge, detecting anomalies without thresholds, baselines, or manual tuning. The distributed Parent-Child architecture scales horizontally from a single Raspberry Pi to fleets exceeding 100,000 nodes while maintaining sub-2-second visualization latency and storing metrics at approximately 0.5 bytes per sample through tiered compression. Native network monitoring provides live topology maps, NetFlow and sFlow analytics, SNMP device polling across 200+ profiles, and trap handling — capabilities that typically require a separate NPM product. Hundreds of pre-configured alerts cover systems and applications out of the box, with AI-powered root cause analysis surfacing correlated metrics through natural language via MCP-compatible AI assistants. The agent supports Linux, macOS, FreeBSD, Kubernetes, and Docker with eBPF-based kernel observability requiring no application instrumentation. Running on a dedicated VPS on RepoCloud with guaranteed CPU, RAM, and SSD, full root SSH access, and a browser serial console. GPL v3+ licensed.
Cockpit
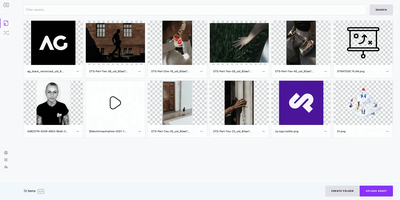
Cockpit puts Linux server administration in a web browser, rendering storage, networking, containers, and virtual machines as visual panels you click through instead of command-line syntax you memorize. It ships in every major Linux distribution and activates through systemd socket activation, consuming zero resources until someone connects on port 9090. What makes it different from other admin panels: every change through the web interface appears instantly at the command line, and every terminal change reflects in the browser in real time. No abstraction layer sits between the UI and the operating system, which means no configuration drift. Storage management covers disk partitioning, RAID arrays, LUKS encryption, LVM volumes, and NFS shares. Network configuration handles bonds, bridges, VLANs, and firewall zones through visual editors. Native Podman integration pulls images, creates containers, manages pods, and provides terminal access into running processes. KVM/libvirt support handles VM creation, cloning, snapshots, and live migration with console access. A built-in terminal provides shell access when the web interface is not enough, and the journal viewer filters systemd logs by severity and unit. Multi-server management connects additional hosts over SSH, presenting a unified dashboard across your entire infrastructure from one browser tab. Runs on a dedicated RepoCloud VPS with full root SSH access and browser serial console. LGPL licensed.
VictoriaMetrics
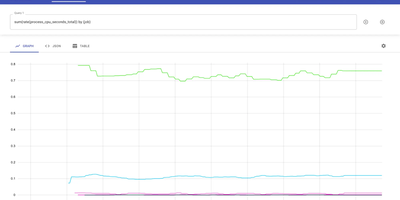
Trusted by thousands of organizations processing billions of time series data points and backed by 17,000+ GitHub stars, VictoriaMetrics delivers a monitoring and time series database that outperforms Prometheus by 16x on query speed while consuming 2.5x less disk space through its optimized compression and storage engine. The architecture supports both single-node deployments handling 10M+ active time series and a horizontally scalable cluster version with vminsert, vmstorage, and vmselect components providing multi-tenancy, replication, and independent namespace isolation. Data ingestion accepts both push protocols including InfluxDB line protocol, Graphite plaintext, OpenTSDB HTTP, CSV, and OpenTelemetry OTLP alongside pull-based Prometheus scraping and remote write, enabling drop-in replacement of existing monitoring stacks without reconfiguring exporters. MetricsQL extends standard PromQL with additional functions, subqueries, and implicit time range alignment while maintaining full backward compatibility with existing Prometheus alerts and Grafana dashboards. The vmalert component processes recording and alerting rules with Alertmanager integration, while vmbackup and vmrestore enable point-in-time snapshots to S3, GCS, and Azure Blob Storage. Stream aggregation operates as a StatsD alternative for pre-aggregating high-cardinality metrics before storage. NFS-compatible storage backends including Amazon EFS and Google Filestore allow shared persistent volumes across cluster nodes. Running on a dedicated VPS on RepoCloud with guaranteed CPU, RAM, and SSD, full root SSH access, and a browser serial console. Apache-2.0 licensed.
InfluxDB
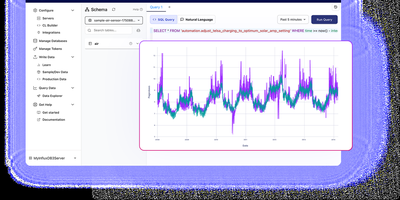
With over 31,600 GitHub stars and thousands of production deployments, InfluxDB 3 Core is the open-source time series database rebuilt in Rust on the FDAP stack — Apache Flight for high-throughput data transfer, DataFusion for vectorized SQL query execution, Arrow for columnar in-memory representation, and Parquet for compressed columnar storage. The engine delivers sub-10ms query response times on recent data and handles millions of writes per second through line protocol ingestion over HTTP, with unlimited tag cardinality eliminating the high-cardinality limitations that plagued earlier InfluxDB versions. The diskless architecture persists data as compressed Parquet files to S3-compatible object storage, Azure Blob, Google Cloud Storage, or local disk with configurable partitioning strategies, while the write-ahead log and in-memory buffer serve real-time queries against recent data before compaction. Native SQL support through DataFusion includes window functions, CTEs, subqueries, and joins, while InfluxQL maintains backward compatibility with existing InfluxDB 1.x and 2.x applications through the same query API. The embedded Python VM enables processing engine plugins and triggers that execute custom logic on write events, perform cross-database queries, and transform data in real time without external tooling. Flight SQL clients provide high-performance query access from Python, Go, Java, and Rust, and the HTTP API supports writes in line protocol format compatible with Telegraf's 300+ input plugins. Running on a dedicated VPS on RepoCloud with guaranteed CPU, RAM, and SSD, full root SSH access, and a browser serial console. MIT/Apache 2.0 dual-licensed.
Homepage
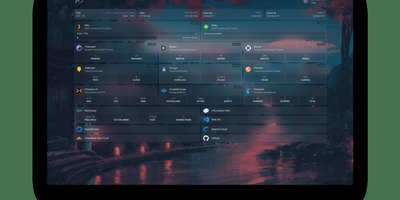
With over 31,000 GitHub stars and 430 contributors, Homepage has become the definitive self-hosted dashboard for homelab enthusiasts and server administrators who want a single, elegant landing page for all their services. The dashboard renders as a fully static site at build time for instant page loads, while a Node.js backend securely proxies all API requests to prevent exposing service credentials to the browser. Docker integration automatically discovers running containers through label-based configuration, populating the dashboard with service status indicators, health checks, and real-time statistics without manual URL entry. Over 100 native service widgets display live data from popular applications including Plex, Jellyfin, Radarr, Sonarr, Home Assistant, Pi-hole, Portainer, Proxmox, Nextcloud, Gitea, and dozens more, each showing relevant metrics like active streams, download queues, or system health directly on the dashboard. Information widgets provide weather forecasts, system resource utilization, search bars, and date/time displays. The layout system supports multiple columns, tabs, and custom CSS for pixel-perfect arrangement of service groups and bookmarks. Built-in authentication options include OIDC integration and password protection. Quick search functionality enables instant access to bookmarks and services with keyboard shortcuts. Internationalization covers 40+ languages with community-maintained translations. Configuration lives entirely in YAML files for version-controlled, reproducible dashboard setups. Deploy on a dedicated VPS on RepoCloud with guaranteed CPU, RAM, and SSD, full root SSH access, and a browser serial console for complete control. GPL-3.0 licensed with an active community and bi-weekly releases.
Pulse
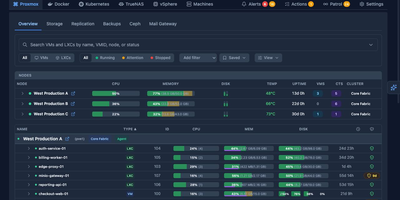
Pulse monitors your entire heterogeneous infrastructure from one screen: Proxmox VE, Proxmox Backup Server, Proxmox Mail Gateway, Docker, Podman, Docker Swarm, Kubernetes, TrueNAS SCALE/CORE, VMware vSphere, and standalone Linux/Windows/macOS machines. The Go binary embeds a SolidJS/TypeScript frontend, delivering WebSocket-driven dashboards with sub-second metric updates on port 7655. A unified agent auto-detects Docker, Podman, Kubernetes, and Proxmox on each host without manual configuration and self-updates silently, while Proxmox nodes need only API credentials with zero agent installation. Smart alerts use adaptive hysteresis-based thresholds to prevent notification floods, pushing to Discord, Slack, Telegram, Teams, email, ntfy.sh, Gotify, and generic webhooks with per-resource overrides. The standout feature is Pulse Patrol: scheduled AI health checks running every ten minutes to seven days using OpenAI, Anthropic, Gemini, or local Ollama models. Patrol catches silent backup failures, capacity creep, restart loops, unhealthy containers, and clock drift that dashboards miss when nobody is watching. Platform-specific views render Proxmox nodes, Ceph clusters, Docker Compose projects, Kubernetes workloads, TrueNAS pools, and vSphere VMs in familiar layouts. OIDC, SSO, and SAML authentication with credential encryption at rest secures access. 6,500+ stars and 441 releases since February 2025. Running on a dedicated VPS on RepoCloud with guaranteed CPU, RAM, and SSD, full root SSH access, and a browser serial console. MIT licensed.
HyperDX
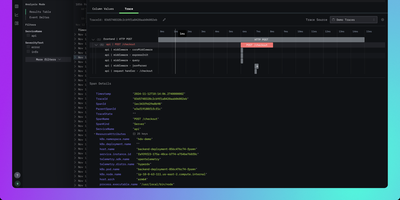
HyperDX correlates logs, metrics, traces, session replays, and errors in a single interface so engineers can resolve production incidents in minutes instead of hours. Nearly 10,000 GitHub stars reflect its role as the integrated UI layer for the ClickStack blueprint endorsed by ClickHouse. The platform connects to any ClickHouse cluster as its storage backend, working with existing table structures without requiring data migration or proprietary ingestion formats. An intuitive Lucene-like search syntax supports full-text queries and property filtering like level:err or service.name:api without needing SQL, while native JSON string querying and event delta analysis surface anomalies in high-cardinality datasets. One-click cross-signal correlation lets you jump from a log line to its distributed trace, from a slow span to associated logs, or from a frontend session replay to the backend errors it triggered. The OpenTelemetry Collector accepts telemetry via OTLP on gRPC port 4317 and HTTP port 4318, supporting automatic instrumentation for Node.js, Python, Java, Go, Ruby, and browser applications. APM tracks HTTP request latency, database query duration, and external service calls with trace waterfall visualizations. Configurable alerts trigger via webhook, Slack, PagerDuty, or email when thresholds are breached. Deploys via Docker Compose with ClickHouse, MongoDB, Redis, and the OpenTelemetry Collector. Running on a dedicated VPS on RepoCloud with guaranteed CPU, RAM, and SSD, full root SSH access, and a browser serial console. MIT licensed.
Kener
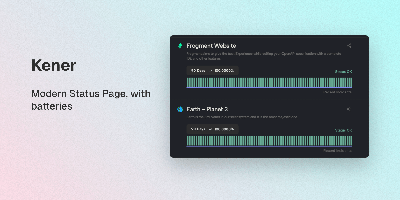
A polished public status page without Statuspage prices or a heavyweight observability suite: Kener is a status and uptime monitoring system built with SvelteKit and Node.js. It runs 11 monitor types - API, Ping, TCP, DNS, SSL certificate, SQL query, Heartbeat, gRPC, and GameDig game-server checks among them - each with configurable intervals and thresholds. Incident management covers the full lifecycle: structured timelines from investigation through resolution, acknowledgements, and subscriber-visible updates, plus maintenance windows with RRULE-based recurring schedules and automatic status transitions. Notifications reach email, Slack, Discord, and custom webhooks through trigger-based workflows with template-driven messaging. One instance can serve multiple branded status pages - per product, team, or region - with custom logos, colors, and CSS, localization into 21 languages, timezone-aware displays, and server-rendered pages that stay fast and SEO-friendly. Operations tooling includes role-based access for teams, API key management, a secrets vault, analytics integrations (Google Analytics, Plausible, Umami, and others), and a REST API with 17+ endpoints for automating incidents and monitors from CI/CD. MIT-licensed; Docker deployment with Redis, SQLite by default, PostgreSQL or MySQL for production.
Grafana Loki
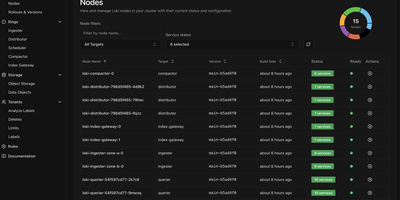
With over 28,600 GitHub stars and 450 contributors, Grafana Loki is the log aggregation system that takes the Prometheus approach to logging — indexing only metadata labels instead of full log content, making it dramatically cheaper and simpler to operate than traditional log management platforms. The label-based indexing strategy groups log streams using the same labels already applied to Prometheus metrics, enabling seamless switching between metrics and logs in Grafana dashboards without maintaining separate indexing infrastructure. Grafana Alloy, the telemetry collector replacing Promtail, scrapes and pushes logs with Prometheus-style service discovery, automatic Kubernetes Pod label extraction, and pipeline stages for parsing, filtering, and relabeling before ingestion. LogQL, the query language, combines label matchers for stream selection with regex line filters and aggregation functions, supporting rate calculations, pattern parsing, and metric generation from log data for alerting and dashboard panels. The storage architecture writes compressed log chunks and TSDB indexes to S3, GCS, Azure Blob Storage, or MinIO-compatible object stores, with configurable retention and compaction policies. Deployment modes scale from a single binary for development through monolithic high-availability mode with multiple replicas to full microservices decomposition with separate ingester, distributor, querier, query-frontend, compactor, and ruler components on Kubernetes via Helm charts. Multi-tenancy isolates data and query paths per tenant through header-based tenant ID assignment. Running on a dedicated VPS on RepoCloud with guaranteed CPU, RAM, and SSD, full root SSH access, and a browser serial console. AGPL-3.0 licensed.
OpenReplay
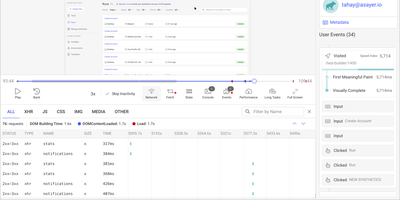
Backed by 12,400+ GitHub stars and positioned as the self-hosted alternative to FullStory and Hotjar, OpenReplay delivers the open-source session replay platform that keeps every byte of user behavior data on your own infrastructure. The JavaScript tracker captures pixel-perfect recordings of clicks, scrolls, form inputs, and navigation with automatic sensitive data masking, while simultaneously logging network requests, console errors, JavaScript exceptions, and Redux, VueX, MobX, NgRx, Pinia, and Zustand store state changes for complete technical context. DevTools mode reconstructs each session with full stack traces, GraphQL queries from Apollo and Relay, Fetch and Axios request payloads, CPU and memory metrics, and page speed waterfall charts — effectively giving developers a browser inspector tied to any user session. Product analytics surfaces conversion funnels, user journeys, click heatmaps, web vitals trends, and retention cohorts without requiring custom instrumentation. Co-browsing connects support agents to live user sessions with cursor control and WebRTC audio, enabling real-time assistance without third-party screen-sharing software. Integrations push session context into Sentry, Datadog, CloudWatch, Stackdriver, and Elastic for front-to-back debugging. Feature flags enable gradual rollouts with session-level targeting. The platform deploys to any cloud via Docker and Kubernetes with auto-scaling ingestion handling up to 50,000 sessions per month on the open-source edition. Running on a dedicated VPS on RepoCloud with guaranteed CPU, RAM, and SSD, full root SSH access, and a browser serial console. AGPLv3 licensed.
Dashy
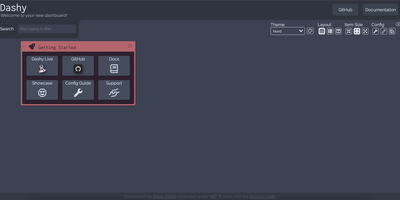
Every service you run, behind one polished start page: Dashy is the most customizable homelab dashboard, built as a Vue.js homepage. Configuration lives in a single YAML file, but you never have to hand-edit it: an integrated UI editor with real-time validation writes changes back to disk, so both config-as-code and point-and-click camps are served. Status indicators put a live health dot next to every app - HTTP checks or pings on custom intervals, with response time and status details on hover - giving you an at-a-glance uptime overview before anything breaks. Over 50 built-in widgets pull dynamic content from the services you already run: Pi-hole and AdGuard block stats, Proxmox lists, Nextcloud status, Netdata CPU/memory history, Prometheus data, plus weather, RSS, crypto prices, and generic iframe/API-response widgets for anything with an endpoint. Instant fuzzy search launches any app as you type, with customizable hotkeys and web-search fallthrough. Theming is deep: dozens of built-in themes, a UI color palette editor, and custom CSS over CSS variables. Alternate views include a fast-loading minimal startpage and a workspace view that embeds apps side-by-side without leaving the dashboard. Icons resolve from Font Awesome, homelab icon packs, emojis, or auto-fetched favicons. Built-in authentication, multi-page support, cloud backup/sync, and multi-language round out an MIT project with a massive community.