Cupdate
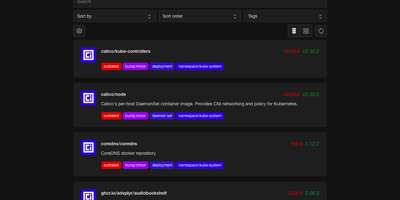
Cupdate keeps a watchful eye on every container image you run, reporting which ones are outdated or vulnerable while deliberately never touching the update button itself. Point it at a Kubernetes cluster, a Docker socket, or Podman hosts (local or remote, one or several) and it inventories every image in use with no configuration to write. Each image is matched against its registry to find the newest available version, and the dashboard shows the gap between what you deployed and what you could be running, with release notes inline so the decision to upgrade takes seconds instead of a changelog hunt. Vulnerability data is layered on top from four sources: Docker Scout for Docker Hub images, Clair for participating Quay images, GitHub Advisories for images tied to repositories, and osv.dev correlation for images shipping SBOMs. A dependency graph explains why each image exists in your stack by showing which workloads pull it, which ends the "can I delete this?" guessing game. Subscribe to the RSS feed to hear about new releases passively, query the REST API to drive scripts that update compose files or kustomizations, or surface outdated and vulnerable counts in a Homepage dashboard widget. Prometheus metrics and traces are available when you want the watcher itself watched. Running on a dedicated VPS on RepoCloud with guaranteed CPU, RAM, and SSD, full root SSH access, and a browser serial console. MIT licensed.
Kula
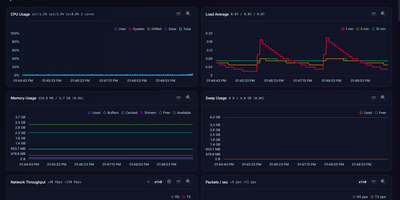
Kula watches a Linux server every second and turns CPU, memory, disks, network, containers, and applications into a live dashboard you can open before trouble becomes downtime. Follow total and per-core CPU, load averages, memory and swap pressure, disk I/O, filesystem space, temperatures, GPU load, and network throughput as charts update live in the browser. Drag to zoom into history, switch to focus or TV mode for a wall display, and check the System Info page when you need the hardware story behind a spike. Watch Docker, Podman, and cgroup containers beside host metrics, then add PostgreSQL, MySQL or MariaDB, nginx, and Apache monitoring or define custom metrics for the odd service only your team understands. Scrape the Prometheus endpoint into an existing observability stack, open the terminal UI over SSH for a quick live read, or ask the optional local Ollama assistant to discuss charts without sending data to a cloud service. Protect the dashboard with optional Argon2id logins and multiple users, schedule storage snapshots, and keep the whole tool working on closed networks with no external calls. Running on a dedicated VPS on RepoCloud with guaranteed CPU, RAM, and SSD, full root SSH access, and a browser serial console. AGPL-3.0 licensed.
VictoriaMetrics
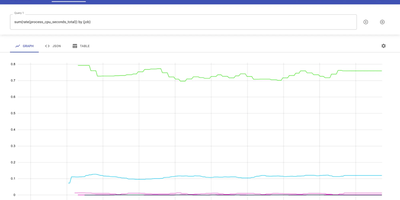
Trusted by thousands of organizations processing billions of time series data points and backed by 17,000+ GitHub stars, VictoriaMetrics delivers a monitoring and time series database that outperforms Prometheus by 16x on query speed while consuming 2.5x less disk space through its optimized compression and storage engine. The architecture supports both single-node deployments handling 10M+ active time series and a horizontally scalable cluster version with vminsert, vmstorage, and vmselect components providing multi-tenancy, replication, and independent namespace isolation. Data ingestion accepts both push protocols including InfluxDB line protocol, Graphite plaintext, OpenTSDB HTTP, CSV, and OpenTelemetry OTLP alongside pull-based Prometheus scraping and remote write, enabling drop-in replacement of existing monitoring stacks without reconfiguring exporters. MetricsQL extends standard PromQL with additional functions, subqueries, and implicit time range alignment while maintaining full backward compatibility with existing Prometheus alerts and Grafana dashboards. The vmalert component processes recording and alerting rules with Alertmanager integration, while vmbackup and vmrestore enable point-in-time snapshots to S3, GCS, and Azure Blob Storage. Stream aggregation operates as a StatsD alternative for pre-aggregating high-cardinality metrics before storage. NFS-compatible storage backends including Amazon EFS and Google Filestore allow shared persistent volumes across cluster nodes. Running on a dedicated VPS on RepoCloud with guaranteed CPU, RAM, and SSD, full root SSH access, and a browser serial console. Apache-2.0 licensed.
Grafana
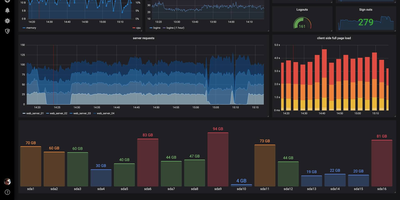
The de facto dashboard of observability: Grafana is the open-source frontend that turns the data stores you already run into interactive graphs. It does not store metrics itself; it connects to the data stores you already run and turns their contents into interactive dashboards. Supported sources number over 150 via plugins: Prometheus, Loki, Tempo, InfluxDB, Elasticsearch, MySQL, PostgreSQL, Microsoft SQL Server, AWS CloudWatch, Azure Monitor, Google Cloud Monitoring, and many more. Dashboards are built from a large library of panel types (time series, heatmaps, tables, gauges, logs) with template variables for reusable, parameterized views. Unified alerting evaluates rules against any connected data source, not just Prometheus, and routes notifications to Slack, PagerDuty, email, and other channels with grouping and silencing - unlike Prometheus Alertmanager, a single rule can combine a Loki log pattern, a PostgreSQL query result, and a CloudWatch metric. Dashboards serialize to JSON and data sources configure via provisioning files, so the entire observability setup can live in Git and deploy repeatably across environments. Explore mode adds ad-hoc querying outside dashboards, with split view for correlating a metric spike against the matching log lines, and access control spans organizations, teams, folder permissions, and OAuth, LDAP, and SAML integration. Written in Go and TypeScript, AGPL-licensed. Self-hosting gives you unlimited users, dashboards, and queries at flat hosting cost, without Grafana Cloud's usage-based pricing.
Homarr
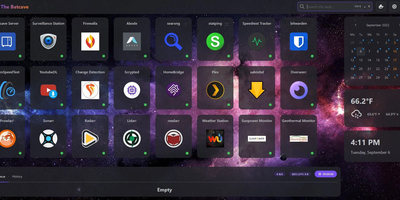
A single pane of glass for every service you run, arranged by drag-and-drop with no YAML or JSON files: Homarr is the modern dashboard for self-hosted infrastructure. Its grid system arranges apps, widgets, and bookmarks on desktop or touch, backed by an icon picker with over 11,000 icons. What separates Homarr from static launchers is 50+ live integrations: Plex, Jellyfin, and Emby media stats, the *arr suite (Sonarr, Radarr) with a unified release calendar, download clients, Pi-hole and AdGuard Home controls, Proxmox, Home Assistant, OPNsense, and Unifi monitoring. Widgets update in real time over WebSockets (tRPC and Redis under the hood), and a built-in search queries thousands of data points across connected services. Custom widgets extend the reach to any HTTP API without code: define endpoint, auth, and refresh interval in the management UI, then render responses as stat grids, tables, progress bars, status indicators, action buttons, or full custom JSX layouts - with an AI-prompt helper for generating templates. Multi-user support is first-class: credentials, OIDC, or LDAP sign-on, groups with granular permissions, and secrets encrypted with AES-256-CBC. A robust background-job system scales it from a Raspberry Pi homelab to deployments serving hundreds of users.
Webmin
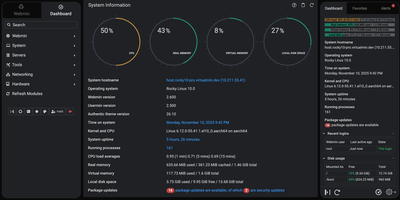
Skip the shell and the configuration file: Webmin handles user accounts, disk quotas, services, and server software on Linux and Unix machines from a browser tab. More than 100 standard modules sit under seven menus: Webmin, System, Servers, Tools, Networking, Hardware, and Cluster. System covers Users and Groups, Scheduled Cron Jobs, Running Processes, System Logs, Log File Rotation, Disk Quotas, Filesystem Backup, and systemd Bootup and Shutdown, plus Software Package Updates, which can hold selected packages on APT and DNF systems. Servers edits Apache, Nginx, BIND DNS, Postfix, Dovecot, MySQL and MariaDB, and PostgreSQL through forms. Networking brings an nftables firewall editor, Fail2Ban jails, and IPsec VPN settings. Tools adds File Manager, Custom Commands, and a Terminal that opens right in the browser. Hardware lists firmware, PCI, USB, storage, and sensor details. The dashboard keeps live CPU, memory, and disk gauges, stats history graphs, and a pending updates alert in view. Webmin Users limits each account to the modules it needs, while two-factor authentication, IP access control, and SSL settings guard the panel itself. Cluster modules reach other hosts registered in the Webmin Servers Index and run cron jobs, shell commands, and package installs on many servers at once. Running on a dedicated VPS on RepoCloud with guaranteed CPU, RAM, and SSD, full root SSH access, and a browser serial console. BSD-3-Clause licensed.
Glance
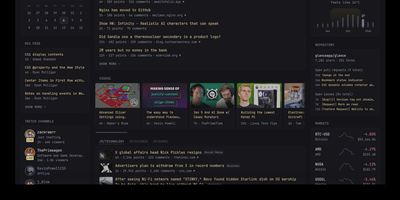
With over 35,000 GitHub stars in just two years, Glance has become the most popular self-hosted dashboard project on GitHub, outpacing established alternatives like Homarr and Homepage. Built as a single Go binary under 20MB with minimal JavaScript and zero external dependencies, Glance delivers a blazing-fast personal information dashboard that consolidates your entire digital morning routine into one beautiful page. Configure everything through clean YAML files that support modular includes and environment variable interpolation, with automatic hot-reload that applies changes without restarting the server. The widget ecosystem covers RSS and Atom feeds, Reddit and Hacker News frontpages, YouTube channel subscriptions, GitHub release timelines, weather forecasts from Open-Meteo, stock market quotes, Docker container status, Twitch live streams, calendar events via iCal, site monitor uptime checks, and custom HTML or iframe embeds. A community widgets repository extends functionality even further with user-contributed integrations. The theming system provides light, dark, and custom color schemes with multiple layout options including slim and wide column configurations. Authentication support added in 2025 secures access with username and password protection. Preconfigured page templates let you get started in seconds with curated layouts for development, homelab monitoring, news reading, and entertainment tracking. Deploy via Docker Compose or as a standalone binary on Linux, macOS, or Windows across AMD64 and ARM64 architectures. Running on a dedicated VPS on RepoCloud with guaranteed CPU, RAM, and SSD, full root SSH access, and a browser serial console. AGPL-3.0 licensed.
ServerBee
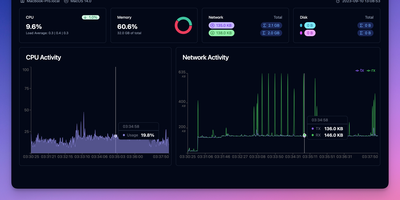
ServerBee delivers complete fleet monitoring from a single Rust binary that embeds both the server and web UI, requiring no external database or heavy runtime. Lightweight agents installed on each node stream CPU, memory, disk, network, load, temperature, GPU, and disk I/O metrics over persistent WebSocket connections to a central server backed by embedded SQLite. The real-time React dashboard presents 17 drag-and-drop widget types across custom layouts, with historical charts spanning one hour to 30 days and monthly traffic statistics with billing-cycle prediction and cost insights including burn rate and per-resource unit cost scoring. Network monitoring covers ICMP, TCP, and HTTP ping probes, service monitors for SSL certificates, DNS records, HTTP keyword matching, TCP ports, and WHOIS expiration, plus network-quality probing across 96 China 3-ISP and international presets with IP-quality and streaming-unlock detection. Remote management features include a web terminal with sandboxed file manager, Docker container stats with logs and events, firewall configuration, and agent auto-update capabilities. Public status pages display 90-day uptime timelines, while alerting supports email and webhook notifications with flexible trigger expressions. A native iOS companion app provides mobile monitoring access. Deploy via Docker or download the single binary for Linux, macOS, or Windows, running on a dedicated VPS on RepoCloud with guaranteed CPU, RAM, and SSD, full root SSH access, and a browser serial console. AGPL-3.0 licensed.
Elmo
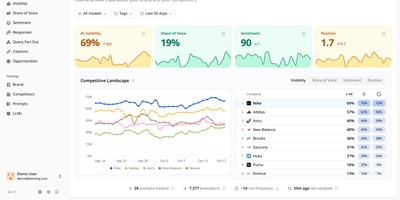
Tracking how ChatGPT, Claude, Gemini, Perplexity, and Google's AI answers talk about your brand, Elmo gives you a self-hosted dashboard for measuring and improving your AI search visibility. A setup wizard reads your website and suggests keywords, competitors, buyer personas, and tracking prompts. Behind the scenes, a worker reruns every tracked prompt on a schedule against the engines you connect, using scraping providers such as BrightData, Oxylabs, or SearchApi for real consumer experiences, or direct OpenAI, Anthropic, Mistral, and OpenRouter APIs. Each run feeds visibility scores per prompt and per model, mention tracking across names, aliases, and domains, sentiment from positive to negative, and each company's position in the answer. The Responses page filters answers by model, tag, prompt, or sentiment and highlights the passage behind each judgment. Citation analysis sorts cited URLs into your domains, competitors, social media, Google properties, and institutional sources. A share-of-voice leaderboard ranks competitors against you over time. Query fan-out shows the web searches engines ran before answering. Opportunities turns the numbers into a prioritized list of content to create, pitch, and seed. Shareable reports reach stakeholders without an account, and a REST API with TypeScript and Python SDKs plus an MCP server lets coding agents query the data. Raw engine output stays in your own database for later audit. Running on a dedicated VPS on RepoCloud with guaranteed CPU, RAM, and SSD, full root SSH access, and a browser serial console. MIT licensed.
SerpBear
Unlimited domains, unlimited keywords, daily Google position checks with stored history and trend charts: SerpBear is an open-source search engine rank tracker. Retrieval works through your choice of third-party SERP APIs - ScrapingAnt, ScrapingRobot, SerpApi, SearchApi, HasData - or your own proxy IP pool, and a flexible scrape-strategy system (Basic, Custom, or Smart, set globally or per domain) works around Google's removal of the 100-results-per-page parameter by choosing how many pages to check per keyword. Google Search Console integration adds real visit counts, impressions, and click-through rates per tracked keyword and surfaces top-performing pages and countries; Google Ads integration supplies monthly search volumes and auto-generates keyword ideas from your site's content. Email notifications report position changes daily, weekly, or monthly, a built-in REST API feeds dashboards and reporting tools, and data exports to CSV. Built with Next.js on SQLite, deployed via Docker, installable as a PWA on mobile - with no per-keyword or monthly SaaS fees.
Pythia
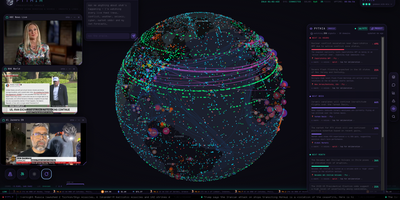
With over 400 GitHub stars and growing, Pythia transforms a local LLM into a self-calibrating geopolitical oracle that watches the entire planet and predicts what happens next — no API keys, no cloud, no cost. The Osiris-based Three.js globe frontend streams 30+ concurrent live feeds including GDELT geopolitics, armed conflict events, USGS earthquakes, NWS storm polygons, EONET disasters, FIRMS wildfires, Polymarket crowd odds, cryptocurrency and commodity prices, UNHCR displacement data, WHO disease outbreaks, and WFP food insecurity indicators. The FastAPI backend fuses these heterogeneous sources into a unified world brief, pipes it through Ollama, and generates located predictions across 24-hour, weekly, monthly, and yearly horizons — each carrying a probability, reasoning, and geocoordinates that fly the globe to the event. A council of four specialist swarm agents — Strategist, Economist, Naturalist, and Skeptic — re-scores every forecast, surfacing consensus, dissent, and splits through Brier-weighted voting where historically accurate personas earn louder votes. The engine maintains a persistent ledger graded by an LLM judge against archived world state, producing running Brier scores and calibration charts. Signal rules fire browser notifications and webhooks when conditions match, a morning brief digest summarizes overnight changes, and the agent API at port 8088 delivers the complete world view in a single JSON call compressed to approximately 50 tokens for AI agent consumption. Running on a dedicated VPS on RepoCloud with guaranteed CPU, RAM, and SSD, full root SSH access, and a browser serial console. MIT licensed.
CrowdSec Web UI
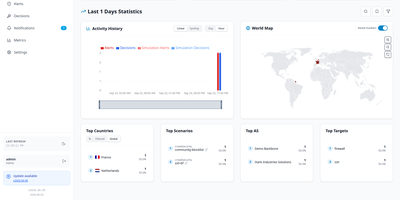
CrowdSec Web UI provides a centralized web console for monitoring intrusion detection telemetry, managing firewall remediation decisions, and auditing security events across multiple CrowdSec security engines. Administrators can connect several CrowdSec Local API endpoints simultaneously, aggregating threat intelligence and active bans into a unified visual interface. The dashboard displays geographic origins of attacking IP addresses, active remediation durations, and specific scenario triggers such as brute-force authentication attacks or web vulnerability probes. Operators can search through historical alert logs, inspect raw HTTP request details, and drill down into individual IP behaviors to differentiate authentic threats from false positives. Manual intervention tools let security teams enforce custom IP bans, adjust expiration timers, or immediately revoke erroneous bans across all connected bouncers with a single click. Integrated notification pipelines dispatch real-time security alerts to external destinations including ntfy, Gotify, and MQTT message brokers whenever critical thresholds are breached. Built-in Prometheus metrics dashboards visualize processing latencies, parser throughput, and decision counts over customizable time windows. Running on a dedicated VPS on RepoCloud with guaranteed CPU, RAM, and SSD, full root SSH access, and a browser serial console. AGPL-3.0 licensed.
HyperDX
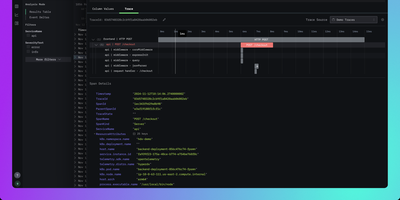
HyperDX correlates logs, metrics, traces, session replays, and errors in a single interface so engineers can resolve production incidents in minutes instead of hours. Nearly 10,000 GitHub stars reflect its role as the integrated UI layer for the ClickStack blueprint endorsed by ClickHouse. The platform connects to any ClickHouse cluster as its storage backend, working with existing table structures without requiring data migration or proprietary ingestion formats. An intuitive Lucene-like search syntax supports full-text queries and property filtering like level:err or service.name:api without needing SQL, while native JSON string querying and event delta analysis surface anomalies in high-cardinality datasets. One-click cross-signal correlation lets you jump from a log line to its distributed trace, from a slow span to associated logs, or from a frontend session replay to the backend errors it triggered. The OpenTelemetry Collector accepts telemetry via OTLP on gRPC port 4317 and HTTP port 4318, supporting automatic instrumentation for Node.js, Python, Java, Go, Ruby, and browser applications. APM tracks HTTP request latency, database query duration, and external service calls with trace waterfall visualizations. Configurable alerts trigger via webhook, Slack, PagerDuty, or email when thresholds are breached. Deploys via Docker Compose with ClickHouse, MongoDB, Redis, and the OpenTelemetry Collector. Running on a dedicated VPS on RepoCloud with guaranteed CPU, RAM, and SSD, full root SSH access, and a browser serial console. MIT licensed.
Graylog
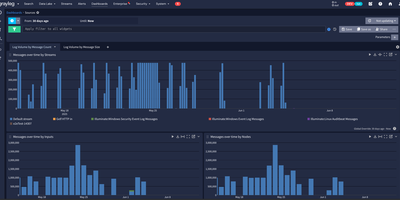
Trusted by over 60,000 organizations worldwide with more than 8,100 GitHub stars since 2010, Graylog has established itself as one of the fastest paths from raw log data to operational visibility, delivering centralized log management, security analytics, and compliance auditing through a purpose-built web interface with sub-second search at scale. The platform ingests logs from virtually any source via syslog, GELF, Beats, raw TCP/UDP, HTTP, CEF, IPFIX, and Netflow protocols, processing each message through configurable pipelines that parse fields, apply transformations, enrich events with GeoIP data from MaxMind or IPinfo lookup tables, and route messages to appropriate streams based on content rules. OpenSearch handles full-text indexing and storage with dynamic shard sizing that automatically calculates appropriate sizes from available node memory, while MongoDB stores configuration metadata including user accounts, roles, dashboards, alert rules, and pipeline definitions. The alerting system integrates with Slack, PagerDuty, and email with customizable notification templates and Replay Search links for immediate investigation context. Version 7.0 introduced MCP server integration for connecting preferred LLMs to perform AI-assisted log analysis and automation, while version 7.1 added Sigma detection rule import from private GitHub, GitLab, and Bitbucket repositories for detection-as-code workflows. The Sidecar agent management system centrally configures and deploys Filebeat, Winlogbeat, and nxlog collectors across infrastructure from the Graylog web interface. Running on a dedicated VPS on RepoCloud with guaranteed CPU, RAM, and SSD, full root SSH access, and a browser serial console. SSPL licensed.
Kubewall
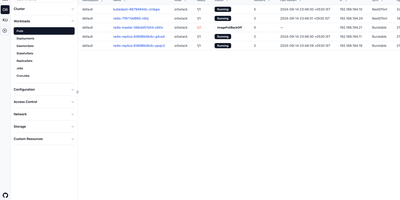
One binary is all that stands between you and every Kubernetes cluster you own: Kubewall opens a realtime web dashboard over all of them, with no agents to install and nothing phoning home. Switch between clusters from the sidebar and browse workloads, networking, storage, configuration, and access control in tables that update live as pods start, fail, and reschedule. Open any resource to inspect its overview, edit its manifest in the built-in YAML editor with validation, watch its events, or stream logs aggregated across pods and containers with search and tail controls. A command palette jumps straight to any resource type, while faceted filters and global search cut through thousands of objects by name, namespace, label, or image. Scale deployments, restart pods, trigger rollout restarts, and apply manifests with a click, or forward a cluster service to your local machine without memorising kubectl incantations. An integrated AI assistant, connected to OpenAI, Claude, Gemini, DeepSeek, OpenRouter, Ollama, or a local model, helps troubleshoot failures and review configurations right beside the resource it concerns. Running on a dedicated VPS on RepoCloud with guaranteed CPU, RAM, and SSD, full root SSH access, and a browser serial console. Apache-2.0 licensed.
Pyrra
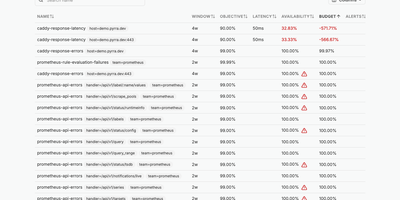
Define a service level objective in a few lines of YAML and Pyrra writes the Prometheus recording rules and multi-window burn rate alerts for it, then tracks the remaining error budget in a web interface. An objective can be an error ratio or a latency target, declared as a Kubernetes custom resource or as a plain file read from disk when running under Docker or as binaries. Grouping labels fan one definition out into an objective per route or handler. The objectives page lists each SLO with its window, target, availability, and remaining budget, sorted so the worst offenders sit on top; columns can be sorted or hidden, and a search box or a click on any label filters the list. Opening an objective highlights availability and error budget, plots the budget over time, and charts requests, errors, and duration with a time range picker and absolute or relative scales. Below the charts, a table shows the four generated alerts with their severities. Generated alerts carry a link back to the objective's page, and severities can be overridden in the spec. Queries go to Prometheus, Thanos, or Mimir, with basic auth, bearer tokens, or tenant IDs, and ready-made Grafana dashboards chart the same objectives. Running on a dedicated VPS on RepoCloud with guaranteed CPU, RAM, and SSD, full root SSH access, and a browser serial console. Apache-2.0 licensed.
OpsiMate
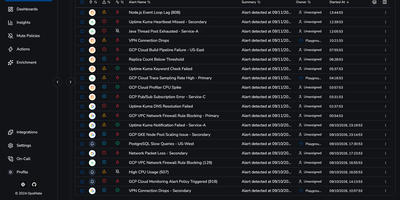
OpsiMate gives on-call teams one queue for alerts that would otherwise arrive in five different dashboards, each demanding attention in its own tab. Connect Grafana, Datadog, Zabbix, Uptime Kuma, Google Cloud, or any custom webhook source and watch incoming alerts land in one table with their source, service, severity, tags, and status attached. Filter the noise down to the team or service you own, group related alerts so one incident does not look like forty separate emergencies, and use mute policies when a known problem should stop paging people. Acknowledge work with one click, assign ownership so nobody wonders who is responding, resolve alerts from the same screen, and follow deep links back into Grafana or Zabbix when you need the original chart or trigger. Let supported integrations auto-resolve alerts when the underlying monitor recovers, and use root-cause notes and insights to keep the next responder from starting at zero. Discover services running in Docker, Kubernetes, and Linux virtual machines so the alert queue stays connected to the infrastructure behind it. Running on a dedicated VPS on RepoCloud with guaranteed CPU, RAM, and SSD, full root SSH access, and a browser serial console. AGPL-3.0 licensed.
Medama
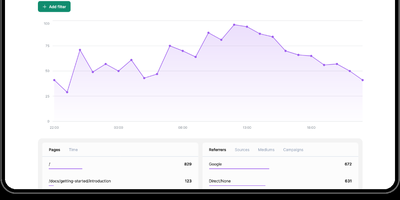
Track website traffic and conversion funnels with sub-second precision while guaranteeing visitors total anonymity with Medama, a privacy-first web analytics platform operating without cookies, IP storage, or consent banners. Site owners embed a sub-kilobyte tracking script into web headers to record page views, session duration, referrers, screen resolutions, browser user agents, and geographic countries anonymously. Built-in caching header mechanisms determine unique daily visitors without generating persistent hashes or storing cross-site identifiers that violate privacy regulations. The web dashboard visualizes hourly traffic trends with interactive area charts and provides multi-dimensional data tables breaking down top-performing pages, search engine referrers, operating systems, and campaign UTM parameters. Developers can instrument custom click events and page attributes using simple HTML data attributes to measure conversions, document downloads, button interactions, and user subscription states. Administrators manage multiple websites from a single interface, configure curated anti-spam blocklists using Firehol and Tor exit node feeds, and monitor server CPU, memory, and disk usage in real time. Full OpenAPI specification endpoints allow teams to export analytics data directly into internal business intelligence pipelines and custom executive dashboards. Running on a dedicated VPS on RepoCloud with guaranteed CPU, RAM, and SSD, full root SSH access, and a browser serial console. Apache-2.0 licensed.