Knock-Knock
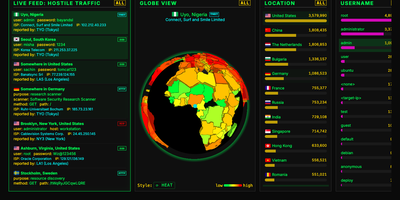
Bots that knock on your server's login ports are always turned away by Knock-Knock, a multi-protocol honeypot that shows every attempt on a live dashboard. Honeypots answer on the standard ports for SSH, Telnet, FTP, RDP, SMB, SIP, HTTP, and SMTP, with MQTT, Node-RED, Modbus, S7, and SNMP as optional extras. Authentication is always rejected, so no bot ever gets a shell. Who is knocking? The live feed shows each attempt's country, username, password, ISP, IP, and protocol. From where? A 3D globe marks the origin in one of six styles, including an extruded country heat map. Trying what? Leaderboards rank countries, usernames, passwords, ISPs, and IP addresses, and a trivia panel explains why bots favor certain credentials. A protocol filter re-slices the feed, globe, and leaderboards together; SIP shows dialed numbers and toll-call destinations, and RDP shows hostnames and accounts. Too fast? Press the space bar to pause, right-click any knock for details, or switch on a virtual Geiger counter that clicks as attacks arrive. Want to fight back? Download hourly 30-day and 365-day blocklists with recipes for CSF, CrowdSec, ipset, nftables, and pfSense, or query the optional API for any IP, CIDR range, or ASN. Several honeypot servers can stream into one aggregated dashboard. Running on a dedicated VPS on RepoCloud with guaranteed CPU, RAM, and SSD, full root SSH access, and a browser serial console. MIT licensed.
Measure
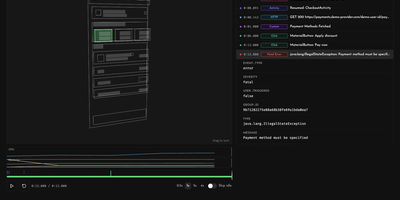
Measure is an open-source mobile monitoring platform that shows mobile teams what broke, how often, and what the user did right before it happened. Crashes, ANRs, and app hangs are grouped into single issues, and each fatal error arrives with a session replay: an ordered timeline of screens opened, taps, network calls, logs, and lifecycle events, with CPU and memory charts alongside screenshots and wireframe layout snapshots. Bug reports can be filed with a device shake or an SDK call and carry the same history of user actions. Performance traces and spans break slow startups and screens into steps, and network monitoring ranks the slowest and most error-prone endpoints. Funnels built from custom events show conversion and drop-off at each step, with a Friction view that ties every step to the crashes, errors, slow traces, and network requests users hit there. User journeys chart how people move between screens, and Adaptive Capture changes sampling, replay length, and screenshot masking remotely, with no new app build. SDKs cover Android, iOS, Flutter, React Native, and Kotlin Multiplatform. Teams sign in with Google or GitHub, invite colleagues by email, and send alerts to Slack, and an optional Measure Agent lets a coding agent or Slack help debug production issues. Running on a dedicated VPS on RepoCloud with guaranteed CPU, RAM, and SSD, full root SSH access, and a browser serial console. Apache-2.0 licensed.
Jellydash
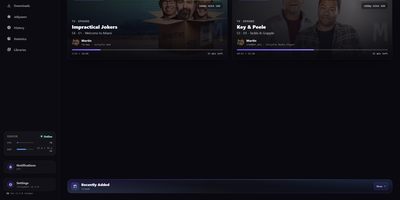
Jellydash answers the questions every Jellyfin admin asks, starting with who is watching right now and whether that stream is transcoding. Live cards show each session's artwork, user, quality, progress, and playback method, including the reason a transcode was needed, and live TV channels appear with real program progress. Behind the scenes, a background poller records every play even when nobody has the dashboard open, building a history you can search, filter by user or library, and export to CSV with poster art intact. Older Jellyfin or Emby Playback Reporting backups import in seconds, so years of viewing are not lost when you switch. Statistics turn that history into watch-time trends, top users, device and client activity, codec breakdowns, and transcode reasons, and clicking a chart opens the exact plays behind it. A monthly recap looks back at a finished month with rankings and daily activity, while trending and all-time most-watched strips show what your household actually loves. Optional pages follow Jellyseerr requests as they arrive and read the status of SABnzbd, qBittorrent, Transmission, Deluge, and NZBGet clients without ever touching their queues. Server activity, maintenance tasks, and system status stay one click away, and selected users can be excluded from monitoring entirely. When someone presses play, a notification can reach your phone through Telegram, Pushover, Discord, ntfy, Gotify, or Web Push. Running on a dedicated VPS on RepoCloud with guaranteed CPU, RAM, and SSD, full root SSH access, and a browser serial console. MIT licensed.
Swetrix
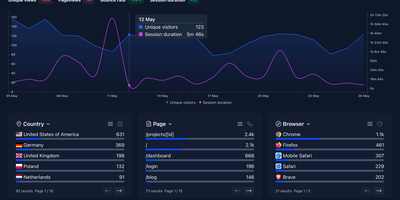
Traffic analytics, real-user performance monitoring, and client-side error tracking - normally three tools - in one cookieless, privacy-first dashboard: Swetrix. The Community Edition ships the same core engine as the cloud product - a NestJS API with ClickHouse for high-volume event storage, MySQL for relational data, and Redis for caching, fronted by a React dashboard and a ~5 KB tracking script with official packages for 20+ frameworks including Next.js, WordPress, and Shopify. Traffic analytics cover pageviews, referrers, UTM campaigns, geolocation, sessions with page flows, funnels, and custom events - all anonymized server-side with no cookies, no cross-device tracking, and no consent banner required for GDPR compliance. Performance monitoring records real-user metrics per pageview: TTFB, DNS and TLS timing, and render times, so regressions surface in the same place as traffic. Error tracking captures unhandled JavaScript exceptions automatically with formatted stack traces, filename/line metadata, affected browsers and pages, first/last-seen timestamps, and a resolve workflow - replacing a separate error monitoring subscription for many teams. Alerts fire to email, Slack, Telegram, Discord, or webhooks on traffic spikes, new errors, and custom events. If Plausible covers your traffic questions but you also want to know why the site broke, Swetrix answers both.
KubeSphere
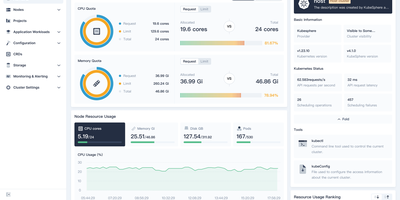
Managing Kubernetes shouldn't require every developer to become a Kubernetes expert — KubeSphere wraps cluster operations, CI/CD, service mesh, and observability into guided web workflows that operations teams configure once and developers consume without kubectl. The LuBan extensible architecture treats each capability as an independently installable extension plugging into a lightweight microkernel: enable DevOps without service mesh, add monitoring without the app store, compose exactly what your organization needs. Multi-cluster management provides a centralized control plane for provisioning and operating clusters across cloud providers, data centers, and edge locations with unified identity and resource quotas. The DevOps extension integrates Jenkins for graphical pipeline creation with S2I and B2I workflows, while Argo CD powers GitOps continuous deployment with real-time sync status. Istio-based service mesh provides traffic management, canary deployments, circuit breaking, and distributed tracing through the console without CLI knowledge. Prometheus monitoring with custom dashboards, Fluentd log collection with multi-tenant search, and alerting via Slack and email complete the observability stack. Multi-tenant workspace hierarchy enforces resource quotas and fine-grained RBAC roles across teams. A built-in Helm-based app store handles lifecycle management across clusters. KubeKey deploys production-grade clusters on bare metal or VMs with air-gapped support. Running on a dedicated VPS on RepoCloud with guaranteed CPU, RAM, and SSD, full root SSH access, and a browser serial console. Apache-2.0 licensed.
Highlight
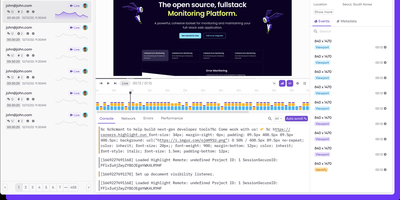
With over 9,000 GitHub stars and a focus on developer experience over legacy monitoring complexity, Highlight.io delivers a unified observability platform that correlates frontend user behavior with backend performance data in a single interface. The session replay engine captures high-fidelity DOM recordings showing exactly what users experienced, including console logs, network requests, page transitions, and user interactions, with configurable privacy redaction for sensitive content. Error monitoring automatically groups and deduplicates errors, surfaces affected user sessions, and provides full stack traces with source map support for minified production code. The logging pipeline ingests structured and unstructured logs from any backend service with automatic property extraction, full-text search, and configurable alerting thresholds. Distributed tracing tracks request flows across microservices with embedded links to associated sessions, errors, and logs for complete request lifecycle visibility. The metrics system collects custom application metrics alongside built-in web vitals and performance data for trend analysis and anomaly detection. Search across all telemetry types uses a unified query language with automatic attribute discovery and saved views for recurring investigations. Integrations connect with Slack, Discord, Linear, Jira, Vercel, and dozens of other developer tools for notification routing and workflow automation. SDKs cover React, Next.js, Vue, Angular, Python, Go, Ruby, Java, PHP, and Elixir with framework-specific instrumentation. Self-hosted deployment runs via Docker Compose with ClickHouse for analytics storage. Running on a dedicated VPS on RepoCloud with guaranteed CPU, RAM, and SSD, full root SSH access, and a browser serial console. Apache 2.0 licensed.
Lab Dash
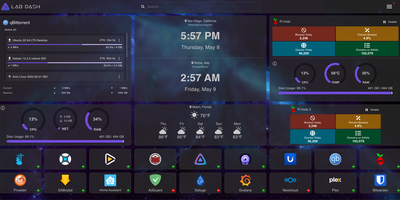
Every homelab deserves a control center that looks as good as the services it manages. Lab Dash gives you a customizable, drag-and-drop dashboard where every tile earns its spot. Add shortcut widgets linking to your Plex, Grafana, Nextcloud, or any service with automatic health check indicators showing green or red status at a glance. The system monitoring widget displays real-time CPU usage, memory consumption, network throughput, disk utilization, and temperature readings by mounting the host /sys directory as a read-only volume. Integrate Pi-hole stats, qBittorrent download progress, and media server widgets for Jellyfin, Plex, or Emby directly on your grid. Multiple pages let you organize services by category, and the search bar finds any tile instantly. Customize the background image from a local upload or URL, set a custom title and tab name, and choose your preferred search provider including self-hosted options like SearXNG. All sensitive configuration data is encrypted locally with AES-256-CBC, and only administrator accounts can modify the layout. Install Lab Dash as a Progressive Web App on desktop, phone, or tablet for a native app experience with offline capability. Configurations export as backup files for easy migration between instances. On RepoCloud, deploy Lab Dash on a dedicated VPS with root SSH access and Docker socket connectivity under the GPL-3.0 license.
Vigil
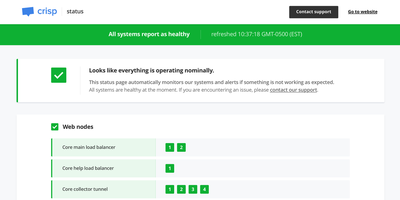
Vigil monitors your entire distributed infrastructure and generates a public status page from a single Rust binary small enough to run on a Raspberry Pi, consuming minimal CPU and memory while providing crash-free reliability. Four distinct monitoring modes cover every topology: poll probes check HTTP, TCP, SSH, and ICMP endpoints for reachability with configurable intervals and thresholds; push probes receive health reports from Vigil Reporter libraries embedded in your application code across Node.js, Python, Golang, Rust, TypeScript, Dart, and C#; local probes delegate monitoring to Vigil Local slave daemons running behind firewalls on separate LANs; and script probes execute custom shell commands for specialized health checks. Each monitored service transitions through healthy, sick, and dead states based on consecutive probe failures, with configurable thresholds controlling state transition sensitivity. When services change state, Vigil dispatches notifications through twelve alert channels including Slack, Email, Twilio SMS, Telegram, Pushover, Gotify, XMPP, Matrix, Zulip, Cisco Webex, and generic webhooks. The generated status page displays service groups organized by category with real-time replica status, system load metrics from reporter probes, and a maintenance announcement system for communicating planned downtime through the Manager HTTP API. Configuration uses a single TOML file defining all probes, services, and notification channels with no database dependency. Docker deployment pulls the official image with volume-mounted configuration. Running on a dedicated VPS on RepoCloud with guaranteed CPU, RAM, and SSD, full root SSH access, and a browser serial console. MPL-2.0 licensed.
Nimbus
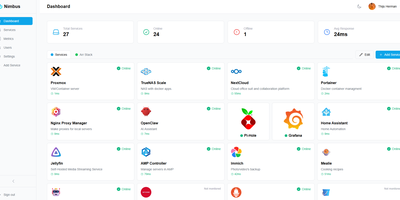
Nimbus is a self-hosted homelab dashboard that turns your scattered pile of services into a polished, organized command center with real-time health monitoring for every endpoint you care about. The dashboard displays live status cards for each registered service, tracking response times down to the millisecond and graphing uptime history so you can spot degradation before it becomes an outage. Health checks run on configurable intervals with smart self-signed certificate handling, meaning your internal services with self-issued TLS do not trigger false alarms. Multi-user support comes standard: local accounts authenticate via JWT, while OAuth2 integration with Google, GitHub, and Discord lets team members sign in with existing credentials. Role-based access control and a built-in admin panel give you granular authority over who sees what. Each user personalizes their view with custom backgrounds, light or dark mode, accent color themes, and drag-and-drop service tile arrangement. Services group into named categories and cards resize to fit your preferred layout, with both grid and list view modes available. Prometheus metrics export feeds your existing Grafana stack, and webhook notifications alert you instantly when a service goes offline. Custom service icons upload directly or auto-fetch from the Dashboard Icons collection. Zero-config Docker deployment gets you running in under 30 seconds with a single docker-compose command. Running on a dedicated VPS on RepoCloud with guaranteed CPU, RAM, and SSD, full root SSH access, and a browser serial console. AGPL-3.0 licensed.
Maintenant
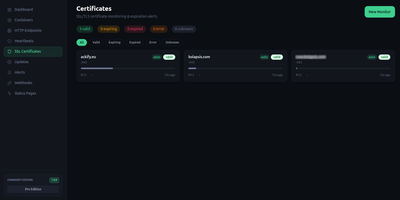
Maintenant replaces three to five separate monitoring tools with a single Go binary that consolidates container discovery, endpoint monitoring, SSL tracking, resource metrics, and public status pages without requiring any external database. The embedded Vue 3 frontend serves on port 8080 immediately after deployment, auto-discovering Docker containers and Kubernetes pods through direct socket and API access without configuration. HTTP and TCP endpoint monitoring validates availability with configurable intervals, while TLS certificate tracking alerts before expiration across all monitored domains. Resource metrics collect CPU, RAM, network throughput, and disk usage per container with real-time Server-Sent Events streaming to the dashboard. Heartbeat and cron monitoring accepts pings from external scheduled jobs, triggering alerts on missed check-ins via webhook callbacks and Discord notifications. The built-in alert engine supports escalation rules and notification batching. Public status pages expose component health to end users without authentication, customizable per monitored service. Network security insights analyze exposed ports, container privilege levels, and host configuration to produce a posture score. Update intelligence scans OCI registries to detect available container image updates with digest comparison. The REST API with SSE broker enables automation, and the integrated MCP server provides tooling for AI assistant integration. SQLite in WAL mode stores all data with zero operational overhead. Running on a dedicated VPS on RepoCloud with guaranteed CPU, RAM, and SSD, full root SSH access, and a browser serial console. AGPL-3.0 licensed.
LaraOwl
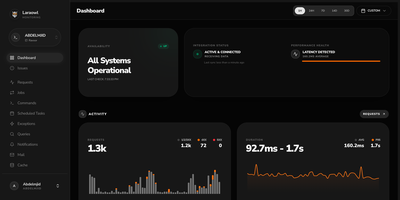
LaraOwl watches your Laravel applications from your own server, streaming every request, exception, slow query, and attack attempt into one live dashboard. Install one Composer package in each app, point it at your LaraOwl server, and requests arrive with method, path, status, duration, and middleware timing attached. Exceptions group themselves by fingerprint with stack traces, occurrence counts, and first and last seen times, so a resolved bug that comes back announces itself. Slow queries and N+1 patterns are flagged with execution times, jobs report failures and retries, and scheduled tasks check in like heartbeats that complain when they stop. A built-in security lens scores threats such as SQL injection, cross-site scripting, and path traversal, tracks hostile IPs, and can push a block into your Cloudflare firewall in one click. Uptime checks run every thirty seconds, alerts fan out to Slack, Discord, Telegram, email, or any webhook, and throttles keep a bad night from becoming a thousand messages. Teams organize multiple projects with their own tokens, thresholds, and retention policies, and daily pruning keeps last quarter's noise from filling the disk. Running on a dedicated VPS on RepoCloud with guaranteed CPU, RAM, and SSD, full root SSH access, and a browser serial console. Apache-2.0 licensed.
LobsterBoard
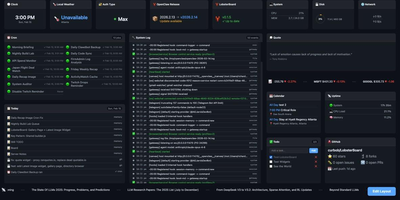
LobsterBoard lets you assemble custom monitoring dashboards from 50 pre-built widgets using a visual drag-and-drop editor, covering everything from CPU and memory gauges to AI subscription trackers, stock tickers, and camera feeds on your own server with zero cloud dependencies. The snap-grid editor handles layout composition with resize handles and a property panel, so you drag widgets onto a canvas, configure their data sources, and the dashboard is live. Real-time system statistics flow through Server-Sent Events, updating CPU load, memory pressure, disk usage, network throughput, and Docker container status without page refreshes. Five built-in themes range from a dark default to a retro CRT terminal aesthetic, a warm sepia paper look, and pastel options for different display environments. The template gallery lets you export complete dashboard layouts with auto-captured screenshot previews, share them with other users, and import configurations as a full replacement or selective merge. Custom pages extend beyond dashboards into notes, kanban boards, or any free-form layout you need. Built-in widgets connect to iCal feeds for calendar events, RSS sources for news aggregation, weather APIs for local conditions, and financial data providers for cryptocurrency and stock prices. The whole system runs from a single server.cjs file with zero cloud dependencies or external frameworks. Running on a dedicated VPS on RepoCloud with guaranteed CPU, RAM, and SSD, full root SSH access, and a browser serial console. BSL-1.1 licensed (free for non-commercial use; converts to MIT in 2030).
Usulnet
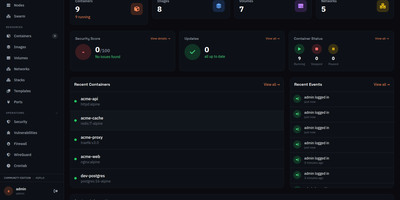
Usulnet packs container management, Trivy security scanning, Nginx reverse proxy, scheduled backups, WireGuard VPN, firewall rules, and multi-node orchestration into a single 70MB Go binary with zero external runtime dependencies. Every module ships in one download with no paid tiers, no telemetry, and no edition gating. Container lifecycle management covers creation, start, stop, restart, pause, kill, and removal with bulk operations, real-time resource statistics, filesystem browsing, and settings editing. Trivy integration scans images and running containers for CVEs with severity scoring, generates SBOMs, and validates CIS benchmarks. The multi-node architecture supports standalone, master, or agent modes where agents connect over NATS JetStream with mTLS encryption, enabling remote Docker host management from a central dashboard. Reverse proxy configuration handles Nginx with automatic Let's Encrypt certificates, TCP/UDP stream proxying, access lists, and dead host detection. Backup operations capture container volumes and Compose stacks on configurable schedules with retention policies and full restore capabilities. A built-in application catalog provides 60+ one-click templates for common services. JWT license validation uses an RSA-4096 public key embedded in the binary, requiring no call-home and working entirely offline. For teams tired of maintaining separate tools for each infrastructure concern, Usulnet collapses the entire stack into a single point of management with Docker Compose deployment alongside PostgreSQL, Redis, and NATS.

Cited
Buyers now ask an AI assistant before they ever visit your website, and Cited tells you whether your brand made it into the answer. Verify your domain with a DNS record, choose the buyer-like prompts worth watching, and Cited checks them on schedule across ChatGPT, Claude, Gemini, Perplexity, Google AI Mode, and Google AI Overviews. Every meaningful appearance becomes a durable evidence note in your citation inbox: open one to see the exact prompt, the response snapshot, where your domain appeared, and the first-seen history. It distinguishes a true source citation from a brand mention without a link, an explicit recommendation, and the uncomfortable one, a missed opportunity where a competitor got cited and you did not. Competitor tracking runs continuously, so you see rivals earning answers in your category while there is still time to respond. Notes can be annotated, organized through new, seen, saved, and resolved states, and exported for reporting. Email alerts flag meaningful new events and a weekly digest summarizes what changed, so checking becomes a habit instead of another dashboard to babysit. Workspace roles and local credentials keep a small marketing team organized on your own PostgreSQL database. Running on a dedicated VPS on RepoCloud with guaranteed CPU, RAM, and SSD, full root SSH access, and a browser serial console. AGPL-3.0 licensed.
Grafana OnCall
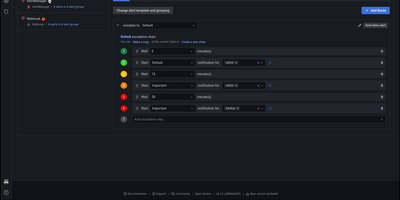
With 3,900 GitHub stars, 140 contributors, and 380 releases since its 2022 launch, Grafana OnCall delivers developer-friendly incident response that routes alerts from any monitoring system to the right engineer at the right time through the right channel. The platform accepts alerts via unique API URLs from Alertmanager, Grafana Alerting, Zabbix, Datadog, Pagerduty-compatible sources, Jira, inbound email, and generic HTTP webhooks, then applies routing templates to direct each alert to the appropriate escalation chain. Escalation chains define notification sequences — notify the primary on-call via Slack, wait 5 minutes, escalate to SMS and phone, wait 10 minutes, page the secondary on-call and notify the engineering manager — continuing until acknowledgment or resolution. On-call schedules support multi-layer rotations with overrides, shift swaps, and timezone-aware handoffs rendered directly inside Grafana dashboards. ChatOps integration publishes alert groups to Slack channels and Telegram groups with interactive buttons for acknowledge, resolve, and silence actions. Template engines based on Jinja2 control alert grouping, appearance rendering, and behavioral automation. The REST API enables programmatic management of integrations, schedules, and escalation policies. Deploy via Docker Compose with PostgreSQL, Redis, and Celery workers alongside your existing Grafana instance. Running on a dedicated VPS on RepoCloud with guaranteed CPU, RAM, and SSD, full root SSH access, and a browser serial console. GNU AGPL v3 licensed.
Statainer
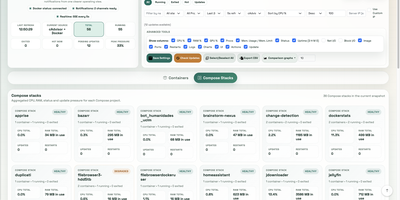
Monitoring and safeguarding Docker infrastructure without heavy enterprise software overhead is the primary mission of Statainer, an open-source management control center for container hosts. System operators inspect live CPU loads, memory consumption, network throughput, and disk I/O metrics across individual containers or comparative top-ranking charts. The interface groups containers by Compose projects, enabling administrators to start, stop, or restart entire application stacks and inspect real-time log streams without opening SSH sessions. The built-in Update Manager detects available image tags, executes single-click container updates, and maintains persistent deployment history with automated rollback capabilities for failed recreations. Custom alert configurations trigger instant notifications to Telegram, Discord, Slack, Pushover, or generic webhook endpoints whenever resource thresholds are breached or container health states change. Developers can provision scoped API keys with token authentication to automate container state transitions and export performance telemetry into custom monitoring workflows. Running on a dedicated VPS on RepoCloud with guaranteed CPU, RAM, and SSD, full root SSH access, and a browser serial console. MIT licensed.
PRISM
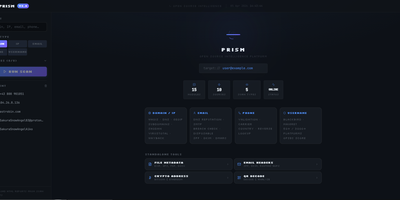
PRISM consolidates passive reconnaissance, credential leak detection, and network asset mapping into a unified operational dashboard to replace fragmented command-line security tools. Analysts can launch simultaneous multi-source investigations against domains, internet protocol addresses, email mailboxes, phone numbers, and online handles to uncover domain registrations, open network ports, cryptographic certificates, and historical web archives. The platform interrogates threat feeds and leak repositories to expose credential leaks, dark web mirrors, and email routing anomalies with automated SMTP mailbox verification. Cross-platform identity engines crawl thousands of social networks and public registries to correlate aliases, discover leaked commit identities, and trace digital footprints across the web. Discovered assets render into interactive entity relationship graphs alongside geographic internet protocol maps to help investigators visualize infrastructure clusters and ownership links. An automated operational security calculator evaluates exposure vulnerabilities across identity, web, and infrastructure vectors, producing an aggregated risk score with granular hardening recommendations. Scheduled watchlists continually monitor target infrastructure, dispatching webhook notifications to chat channels whenever new subdomains, ports, or credential leaks appear. Investigators can export comprehensive audit dossiers as self-contained HTML files, styled PDF documents, or structured spreadsheets. Running on a dedicated VPS on RepoCloud with guaranteed CPU, RAM, and SSD, full root SSH access, and a browser serial console. MIT licensed.
ContainerFlow
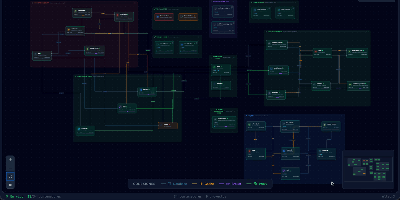
Your database container is probably not at 98 percent memory, whatever docker stats claims, because most of that figure is reclaimable page cache; ContainerFlow subtracts the full cache and shows the memory your containers actually hold. Point it at a Docker socket and it draws the whole estate as a living map: every Compose project discovered automatically, services grouped and colour coded, and the connections between them inferred, app to database, proxy to app, worker to broker. CPU and memory refresh every three seconds, the graph flashes when a container starts, stops, or restarts, and seven days of metric history wait in a local store when you need to know what happened overnight. Click any node and a detail panel opens with live logs you can filter by stream, an inline terminal that runs commands inside the container, and buttons to start, stop, restart, rebuild, recreate, or remove it. The same panel teaches as it works, flagging containers that run with no memory limit, no CPU limit, or no restart policy, while Discord webhooks fire when a container you care about crosses a threshold you set. Running on a dedicated VPS on RepoCloud with guaranteed CPU, RAM, and SSD, full root SSH access, and a browser serial console. AGPL-3.0 licensed.