LAN-Orangutan
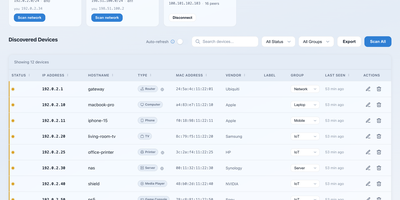
Most home and office networks quietly accumulate dozens of devices nobody can name, and LAN Orangutan answers the basic questions about all of them: what is connected, what changed since yesterday, and what should not be there at all. It scans one or several networks with nmap and merges in the host ARP table, resolving MAC addresses, manufacturers, hostnames, and device types so a phone, printer, TV, and server each show up as themselves rather than as bare IP addresses. You label devices, file them into your own groups and locations, and attach notes that survive every rescan, turning a one-off scan into a maintained inventory. Snapshots freeze the network at a moment in time, and comparing two of them shows exactly which devices appeared, vanished, or moved to a new address. Mark the devices you expect, and the dashboard flags newcomers and missing hardware, with webhook notifications to Telegram, Discord, Slack, ntfy, or Home Assistant when something changes. Tailscale peers appear next to local devices, so the laptop on your tailnet and the printer downstairs live in the same list. Risky exposures such as Telnet or FTP get flagged, scans show live progress you can cancel, and a password you create on first open guards the whole dashboard. Running on a dedicated VPS on RepoCloud with guaranteed CPU, RAM, and SSD, full root SSH access, and a browser serial console. MIT licensed.
openITCOCKPIT
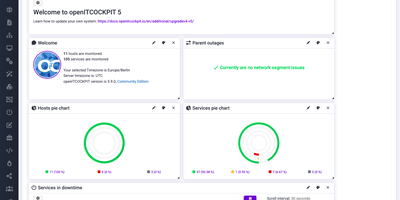
Point a browser at openITCOCKPIT, and templates and wizards create the monitoring checks that watch servers, network devices, containers, and applications. Wizards for Linux, Windows, macOS, MySQL, and network gear create hosts and services. A JSON API exposes the same configuration to scripts. A single-binary agent for Linux, macOS, and Windows reports CPU, memory, disks, services, processes, temperatures, and Docker containers over encrypted pull or push connections. Prometheus exporters, alert rules, and PromQL metrics sit beside classic Naemon checks and feed the same reports. Teams share dashboards with traffic lights, tachometers, and tables and show them on big screens, and Grafana boards are generated for every host. A WYSIWYG map editor places hosts, gauges, and charts on uploaded backgrounds like site plans or server racks, and a status map draws parent-child links automatically. Event correlation joins checks with logical operators into business services, so one cluster state replaces a flood of single alerts. Instant, downtime, and scheduled auto reports summarize availability, and a timeline records state changes, downtimes, and notifications. Alerts reach people by email, Mattermost, Pushover, or Telegram and can be acknowledged from the chat, and recurring downtimes silence planned maintenance. Multi-tenancy, role-based permissions, LDAP or Active Directory login, and single sign-on scope what each team sees. Running on a dedicated VPS on RepoCloud with guaranteed CPU, RAM, and SSD, full root SSH access, and a browser serial console. GPL-3.0 licensed.
Neko Master
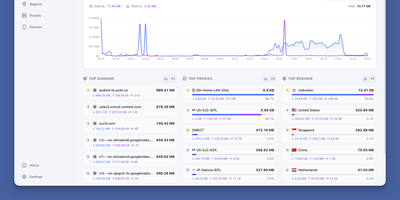
Neko Master watches every connection flowing through your Clash, Mihomo, or Surge gateway and turns the stream into a live map of devices, domains, countries, and proxy nodes, so questions that once needed packet captures get answered at a glance. The dashboard refreshes over WebSocket as traffic moves, charting upload and download trends across thirty minutes, one hour, or a full day. Domain views rank every host your network contacts by traffic and connection count, and IP views add ASN and geographic detail, so an unfamiliar endpoint explains itself instead of raising an alarm. Proxy statistics break traffic down per node and per rule, which makes a saturated exit, a misrouted application, or an underused subscription obvious in seconds. One panel watches several gateways at once: add OpenClash backends directly, or install the one-command agent on OpenWrt, Linux, or macOS machines beside remote gateways and let each agent report home. Because agents open the connection outward, gateways behind NAT still report in, and the panel never reaches into your network uninvited. History persists in SQLite by default, and busy networks can dual-write traffic statistics to ClickHouse for larger histories while configuration stays in SQLite. Token-based access control protects the dashboard, dark mode and an installable PWA keep it comfortable on a phone, and the interface switches between English and Chinese. Running on a dedicated VPS on RepoCloud with guaranteed CPU, RAM, and SSD, full root SSH access, and a browser serial console. MIT licensed.
Icinga Web 2
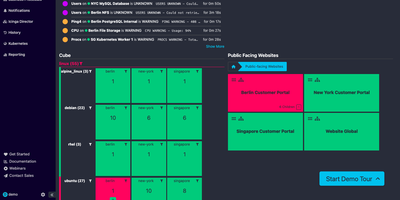
Icinga Web 2 is the browser interface for Icinga monitoring, giving operations teams one place to see which hosts and services are failing, how long they have been down, and what to fix first. Service problems, host problems, and summary tiles share a single dashboard page, and any filtered view can be added to a dashboard or the menu. Host and service lists switch between minimal, common, detailed, and table layouts, sort by severity, and filter through a search bar that autocompletes and accepts wildcards. A click on a service opens details beside the list, with plugin output, check statistics, performance data, comments, downtimes, and custom variables, plus buttons for Check Now, Comment, Downtime, and Reschedule. Modal dialogs keep acknowledgements and scheduled downtimes in context, and bulk operations act on a whole filtered list. The Tactical Overview condenses host and service states into two donut charts, and the Event Overview lists state changes and recoveries with their check output. Modules add Business Processes that group hosts and services into AND and OR trees, plus Cube, Director, Reporting, Notifications, and Kubernetes views. Roles combine permissions, refusals, and restrictions so each team sees only its own hosts, and logins run through Active Directory, LDAP, a database, or the web server. Language, time zone, and light or dark mode are set per user. Running on a dedicated VPS on RepoCloud with guaranteed CPU, RAM, and SSD, full root SSH access, and a browser serial console. GPL-3.0 licensed.
TapMap
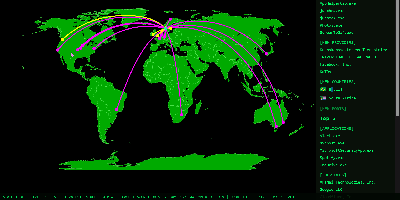
TapMap draws a computer's live network connections on an interactive world map, so you can watch which applications are talking to which services, where those services sit, and what normal looks like for that machine. A local pipeline scans active sockets, extracts the remote addresses, and enriches them with geolocation from databases stored on the machine itself. Every connection carries the owning application or process, its network operator, and the operating system's verification status for that app, and places that share a location are highlighted when connections overlap. The same view lists local open ports, both TCP listeners and bound UDP sockets, established services on your LAN, and public services whose location could not be mapped. A rolling 30-day history turns raw connections into awareness: an Insights panel surfaces new applications, providers, countries, and ports, plus the most frequent activity, while a Significant Connections log records first sightings and failed verifications. A Daily Activity Report goes further, sorting applications into seen-once, occasional, recurring, and stable patterns, analyzing provider concentration, and charting country activity with detailed timelines. New significant connections can raise a desktop notification or publish to an MQTT broker you configure. Nothing is sent anywhere by default: processing happens locally, with no telemetry. Running on a dedicated VPS on RepoCloud with guaranteed CPU, RAM, and SSD, full root SSH access, and a browser serial console. MIT licensed.
Netdata
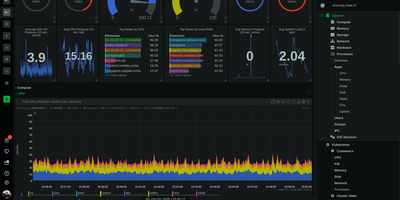
Trusted by millions of engineers and deployed on over 80,000 GitHub stars worth of community confidence, Netdata delivers true real-time monitoring at per-second granularity — 10-60x faster than Prometheus, Datadog, or any conventional monitoring stack that averages away the transient anomalies lasting 2-10 seconds where most production incidents originate. A single installation command deploys the agent with zero configuration, automatically discovering every running process, container, systemd service, network connection, disk, and application on the host within seconds. Unsupervised machine learning trains multiple models per metric directly at the edge, detecting anomalies without thresholds, baselines, or manual tuning. The distributed Parent-Child architecture scales horizontally from a single Raspberry Pi to fleets exceeding 100,000 nodes while maintaining sub-2-second visualization latency and storing metrics at approximately 0.5 bytes per sample through tiered compression. Native network monitoring provides live topology maps, NetFlow and sFlow analytics, SNMP device polling across 200+ profiles, and trap handling — capabilities that typically require a separate NPM product. Hundreds of pre-configured alerts cover systems and applications out of the box, with AI-powered root cause analysis surfacing correlated metrics through natural language via MCP-compatible AI assistants. The agent supports Linux, macOS, FreeBSD, Kubernetes, and Docker with eBPF-based kernel observability requiring no application instrumentation. Running on a dedicated VPS on RepoCloud with guaranteed CPU, RAM, and SSD, full root SSH access, and a browser serial console. GPL v3+ licensed.
NetPulse
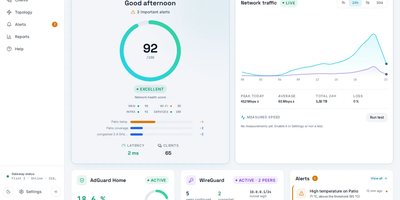
NetPulse is a self-hosted dashboard that turns a pile of routers, switches, and clients into one live picture of how your network is doing. A single score from 0 to 100 condenses latency, loss, uptime, and temperature, and updates every few seconds. The topology map draws itself from bridge and LLDP data, placing wired and wireless clients under the router and port they actually use. Every device is classified by type, with signal strength, band, and first-seen time. Router cards show model, firmware, CPU, memory, temperature, and live traffic. Scheduled WAN speed tests compare results against your contracted plan, and panels for WireGuard peers and AdGuard Home keep VPN and DNS activity in view. Alerts for overheating, new devices, firmware updates, and WAN outages reach you through push notifications, ntfy, Telegram, or webhooks. Admin and viewer accounts share access, a Wi-Fi channel analyzer scores congestion, and OpenWrt firmware upgrades can be started from the browser. MQTT publishing feeds Home Assistant, and an optional read-only MCP endpoint answers questions from your AI assistant. The interface installs as a phone app and speaks English and Spanish. Running on a dedicated VPS on RepoCloud with guaranteed CPU, RAM, and SSD, full root SSH access, and a browser serial console. AGPL-3.0 licensed.
ServiceRadar
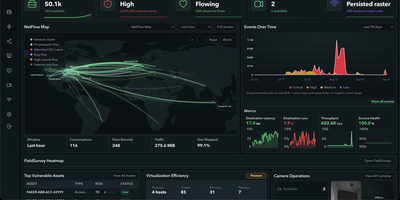
Most teams juggle five consoles to watch one network, and ServiceRadar replaces them with a single operations dashboard for flows, topology, logs, metrics, and alerts. Agents deployed at remote sites keep collecting checks even when the link drops, then deliver their stored records once the connection returns. Discovery over SNMP, LLDP, and CDP builds a topology map that shows traffic between devices, and a NetFlow map traces conversations across the world. Telemetry arrives from OpenTelemetry, syslog, GELF, SNMP polling and traps, BGP, and NetFlow or IPFIX exporters, and a short key:value query language filters any of it. An anomaly engine groups spikes and drift into episodes, so operators get one durable alert instead of a hundred noisy ones. Notification routes with escalation policies page people through Slack, Discord, email, or webhooks, and a delivery log records every attempt. Security views gather scanner findings, threat intelligence matches, and DNS activity, and Ansible playbooks run against inventory devices with live per-host results. Custom checks run as sandboxed plugins, and teams can publish their own dashboards. Managed service providers, multi-site businesses, remote field operations, and homelabs that outgrew a status page are the natural fit. Running on a dedicated VPS on RepoCloud with guaranteed CPU, RAM, and SSD, full root SSH access, and a browser serial console. Apache-2.0 licensed.
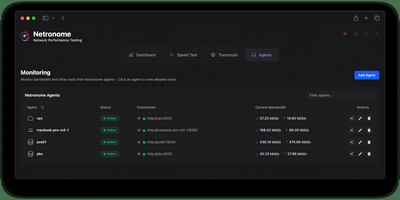
Netronome
Netronome is a self-hosted network monitoring platform that runs scheduled internet speed tests, watches packet loss and DNS resolvers, and reports bandwidth and health data from every server you point it at. Run tests against Speedtest.net, your own iperf3 servers, or public and custom LibreSpeed servers, choosing the exact endpoint from a list sorted with the nearest first. Put tests on a recurring schedule and read the history charts to catch an ISP that sags every evening or a connection that never delivers the speed on the invoice. Install the companion agent on each machine and watch live upload and download rates, traffic by hour, day, and month, processor and memory load, disk space, and temperatures in one place. Trace routes hop by hop, keep packet loss percentages in view, and confirm your DNS resolvers answer fast and return the records you expect. Set thresholds for download and upload speed, ping, packet loss, disk space, CPU, memory, and temperature, and route alerts to Discord, Telegram, Slack, email, ntfy, Gotify, Pushover, or a webhook. The server, the web interface, and the agent ship as one program, and agents connect over HTTP with an optional API key or inside a Tailscale network. Running on a dedicated VPS on RepoCloud with guaranteed CPU, RAM, and SSD, full root SSH access, and a browser serial console. GPL-2.0 licensed.
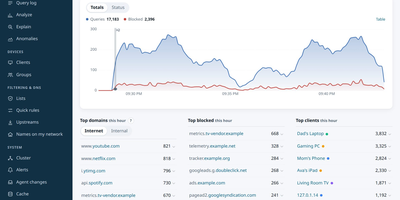
TelltaleDNS
Every connection your devices make starts with a DNS lookup, and TelltaleDNS is the resolver that answers it, filters it per device, and explains exactly why it answered that way. The query log ties each question to a named device, using names from your router's leases, mDNS, or the UI, times every stage, and a Why panel shows the list and rule behind each block. Groups per network or VLAN carry their own blocklists, schedules, safe search, blocked services, and rewrites, and a new rule can be previewed against yesterday's real traffic before you save it. Serve devices over DoT, DoH, or DoQ, give each one a client ID that follows it onto mobile data, forward to encrypted upstreams, validate DNSSEC, or resolve recursively from the root servers. The dashboard adds a traffic map, a heatmap of when your network asks, a flow diagram from groups to answers, and anomaly alerts, with Prometheus metrics, OpenTelemetry, and dnstap for your SIEM. A Raspberry Pi and Kubernetes nodes can share one configuration, with canary rollouts, automatic failover, and failover drills. It answers queries only from private and Tailscale address ranges unless you widen that, and it imports Pi-hole and Technitium setups. A REST API, command line, and MCP tools with approval serve scripts and agents. Running on a dedicated VPS on RepoCloud with guaranteed CPU, RAM, and SSD, full root SSH access, and a browser serial console. Apache-2.0 or MIT licensed.
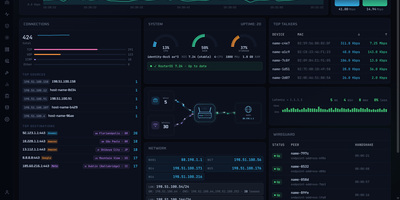
MikroDash
Watching a MikroTik RouterOS v7 router in real time is what MikroDash is for: live traffic, connections, Wi-Fi clients, DHCP leases, and WireGuard peers reach the browser the moment anything changes. Cards drag into any layout, and the arrangement follows your account to every browser. Managing a fleet happens on the Devices page, which shows routers as cards, a list, or a world map with 24-hour connectivity, last backup, open alerts, and pending updates. Rolling out a change starts in Config Management: choose one of 20 ready-made templates or capture your own, then deploy to one router or the fleet with a restore point, a canary router, and an automatic revert if a change cuts MikroDash off. Scheduled backups are kept only when something changed, with a diff and a guarded restore. New sites join through a generated script that calls home over a built-in WireGuard tunnel, even from behind NAT. Alerts reach SMTP, Telegram, ntfy, Discord, Slack, Gotify, Pushover, and Apprise. Troubleshooting stays in the browser with ping, traceroute, torch, bandwidth tests, a packet sniffer, and a RouterOS terminal. Read-only API access covers every page and alert, while roles, OpenID Connect sign-in, and an audit trail of every write govern shared use. Off by default, an optional assistant answers from live router data and asks before changing anything. Running on a dedicated VPS on RepoCloud with guaranteed CPU, RAM, and SSD, full root SSH access, and a browser serial console. MIT licensed.
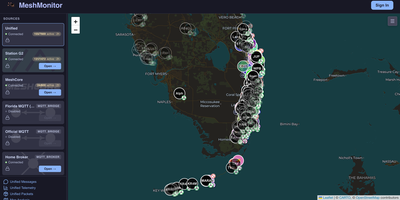
MeshMonitor
Off-grid radio networks are wonderful until you need to see all of them at once, and MeshMonitor puts every Meshtastic node, MeshCore companion, and MQTT broker on one shared dashboard. Each source keeps its own map, messages, telemetry, and traceroutes, and unified views merge them so a node heard by three radios appears once. Nodes plot on an interactive map with signal colors, clustering, topology overlays, and imported GeoJSON, KML, or KMZ zones. Channel chat supports replies, tapback reactions, and full-text search, and telemetry widgets chart battery, voltage, signal strength, and hop distribution over windows from 15 minutes to 7 days. Automation covers auto-responders, scheduled messages, auto-traceroute, and geofence triggers, with custom Node.js, Python, or shell scripts for anything else. A built-in MQTT broker and bridges filter traffic by topic, channel, or bounding box so a local mesh stays tidy. Security checks flag weak or duplicate encryption keys, and an audit log records every privileged action. Admins grant each person access to specific sources, using local accounts, OIDC sign-in, and MFA, and push alerts reach phones and chat apps through Apprise. Use it for a community mesh club, an emergency preparedness network, a fleet of solar-powered relays, or a neighborhood radio project. Running on a dedicated VPS on RepoCloud with guaranteed CPU, RAM, and SSD, full root SSH access, and a browser serial console. BSD-3-Clause licensed.
Munin
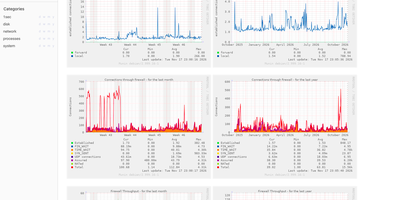
Point Munin at your computers, and this plug-and-play monitoring tool graphs what they are doing, keeps the history, and serves it all in a web interface. A central master polls a small agent on every host every five minutes. That works for a home Raspberry Pi and for a cluster of more than 100 nodes. A default install switches on a large set of plugins on its own. Load, disk, network, and process graphs start filling in with no setup per metric. Plugins are standalone executables that answer a config call with metadata and a plain call with values. Plain shell scripts count. Computers, networks, SANs, applications, even weather measurements: all graphable. The project gallery lists more than a thousand community-supported plugins. No agent on a device? SNMP plugins fetch its values remotely. With supersampling, selected plugins record readings every ten seconds. Every data field can carry warning and critical ranges. Cross one, and Munin can send email, write to syslog, run any script, or notify Nagios or Icinga. Graphs are drawn on demand through CGI or FastCGI. They are grouped by host and category, with hour, day, week, month, and year views side by side. Several masters can watch the same nodes, each keeping its own data. A rewritten node agent covers machines that cannot run the standard one. Running on a dedicated VPS on RepoCloud with guaranteed CPU, RAM, and SSD, full root SSH access, and a browser serial console. GPL-2.0 licensed.
ntopng
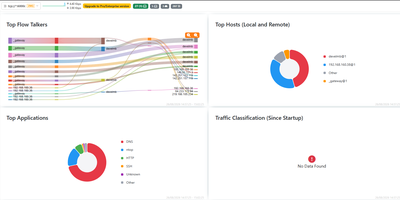
Network traffic stops being a mystery once ntopng names the hosts, applications, and protocols behind every flow, live in your browser. To find the host saturating an uplink, open the dashboard, which ranks top talkers, countries, autonomous systems, and protocols beside historical charts. To see what a suspicious host is contacting, open its page for traffic, ports, DNS queries, TLS details, and visited sites, plus a map of its conversations. Deep packet inspection recognizes applications such as Facebook, YouTube, and BitTorrent, so charts name the app behind the bytes instead of relying on port numbers alone. The console reads packets from a SPAN port or TAP and NetFlow, sFlow, or IPFIX records from routers and switches through nProbe, so it can cover a single switch or many remote sites. Behavioural checks raise alerts for flows, hosts, and interfaces and send them to email, Discord, Telegram, or webhooks. Active monitoring probes remote hosts over ICMP and HTTP/S, and network discovery lists the devices on your local network. A REST API and Lua scripting pull statistics into your own tools and add custom checks. Running on a dedicated VPS on RepoCloud with guaranteed CPU, RAM, and SSD, full root SSH access, and a browser serial console. GPL-3.0 licensed.

PH Intercept
A blocklist working silently in the background is hard to appreciate, so PH Intercept turns your DNS traffic into a live arcade battle: every allowed query flies by as a friendly ship, and every blocked query spawns as an invader your interceptor shoots down. It streams query events live from the API of your existing Pi-hole v6, AdGuard Home, or Technitium server, so the battle on screen is your network's real traffic the moment it happens. Repeat domains level up on screen: friendly shuttles grow into heavy transports and gold capital ships, while blocked domains mutate from crab invaders into orange drones and purple bosses. The interceptor hunts by itself, launching a support drone at five on-screen threats and a second at ten, and it swaps among seven selectable ships, from the Falcon and the Enterprise to the Normandy. The bottom HUD doubles as a control panel: pause blocking for ten seconds, thirty seconds, or five minutes with a synced countdown, watch totals climb, and trigger a gravity list update in place. Client and domain labels can ride beneath each entity, noisy domains disappear through regex ignore patterns, a second DNS server can join in split-screen two-player mode, and viewer settings persist per browser. The backdrop ranges from a starfield plotted from about 12,200 real stars to nebula, synthwave, and custom image modes. Running on a dedicated VPS on RepoCloud with guaranteed CPU, RAM, and SSD, full root SSH access, and a browser serial console. MIT licensed.
Pi.Alert
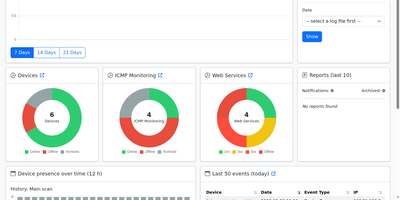
When an unknown phone joins your Wi-Fi or a camera drops offline, Pi.Alert raises an alert and keeps a running inventory of every device on your network. Home labs and small offices use it to see who is connected and whether cameras, printers, and internal services still answer. Device records are editable and hold owner, location, group, notes, and type, alongside session history, presence tracking, and an event log. Discovery layers arp-scan, Nmap, and ping, then merges imports from Pi-hole, FRITZ!Box, MikroTik, UniFi, OpenWrt, AsusWRT, pfSense, OPNsense, and AdGuard Home. Flag a machine as always-on and its silence becomes an alert too. Alerts arrive by email, Pushover, Pushsafer, ntfy, Telegram, or the web interface. Web service checks run every ten minutes, record HTTP status and response time, and log an event when a certificate's subject, issuer, or validity dates change. A relationships page maps devices onto routers, switches, and access points, ICMP checks reach hosts beyond your subnet, and a rogue DHCP check flags unwanted servers. Manual Nmap scans and Wake-on-LAN commands are built in. Satellites scan other network segments and report back to the main instance. A key-protected API feeds Home Assistant and Homepage, and optional MQTT publishing exposes overall and per-device status. Choose Standard, Glass, Piano, or Console themes, bulk-edit devices, and read the interface in 15 languages. Running on a dedicated VPS on RepoCloud with guaranteed CPU, RAM, and SSD, full root SSH access, and a browser serial console. GPL-3.0 licensed.
LAN Sheriff
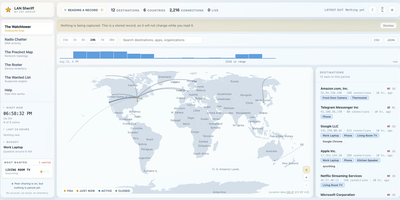
Self-hosted and account-free, LAN Sheriff watches where your devices send their traffic, plots each destination on a live world map, and flags anything that looks suspicious. Click a destination on the Watchtower for its country and city, owning organization, reverse DNS, protocol, port, byte counts, duration, and responsible app or device; filter by device, app, country, organization, or protocol, or scrub back through history. Radio Chatter streams the DNS lookups it can see, surfaces first-seen domains, and labels tracker, ad, telemetry, and malware domains without ever blocking them. The Precinct Map diagrams observed traffic, while the Roster inventories every device by IP, MAC, manufacturer, hostname, inferred type, and services, and alerts you when an unrecognized one joins. The Wanted List applies eight rules, including beaconing, machine-generated domains, port scans, plaintext credentials, and volume anomalies, and explains each finding in a plain sentence rather than a mystery score. Deputy Mode needs no privileges and names the application behind each connection, while Patrol Mode adds packet capture for DNS lookups and traffic volumes. Pair installations with a code to widen your view, export any view as CSV or JSON, and send alerts to webhook, ntfy, Discord, or Slack. Running on a dedicated VPS on RepoCloud with guaranteed CPU, RAM, and SSD, full root SSH access, and a browser serial console. AGPL-3.0 licensed.
Zabbix
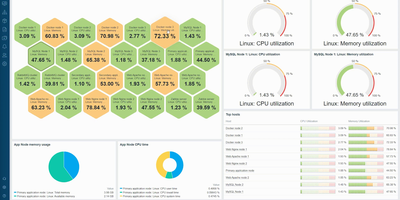
Monitoring everything from network switches to Kubernetes clusters since 2001 with over 6,200 GitHub stars and deployments exceeding 100,000 devices per installation, Zabbix has established itself as one of the most mature and feature-rich open-source monitoring platforms available, trusted by organizations including Dell, Salesforce, ICANN, and T-Mobile. The platform collects metrics from virtually any source using Zabbix Agent written in C, Zabbix Agent 2 written in Go with native plugin support, SNMP v1/v2c/v3 polling and trapping, IPMI for hardware health, JMX for Java applications, SSH and Telnet checks, HTTP/HTTPS polling, and ODBC database queries. Version 7.0 LTS introduced synthetic browser monitoring that executes user-defined JavaScript via WebDriver to simulate multi-step user interactions on websites, proxy load balancing with automatic host redistribution across proxy groups for high availability, in-memory proxy data buffering delivering up to 100x performance improvement, native multi-factor authentication with TOTP and Duo support, and just-in-time user provisioning from SAML and LDAP. Low-level discovery automatically detects file systems, network interfaces, SNMP OIDs, VMware resources, and Kubernetes pods, creating monitoring items and triggers dynamically. The alerting engine correlates events with configurable escalation chains, sending notifications through Slack, Microsoft Teams, PagerDuty, Jira, email, and SMS with customizable message templates. Over 1,000 official templates provide instant monitoring for Linux, Windows, VMware, AWS, Azure, Docker, PostgreSQL, MySQL, Apache, Nginx, and hundreds more. Running on a dedicated VPS on RepoCloud with guaranteed CPU, RAM, and SSD, full root SSH access, and a browser serial console. AGPL-3.0 licensed.