Quickwit
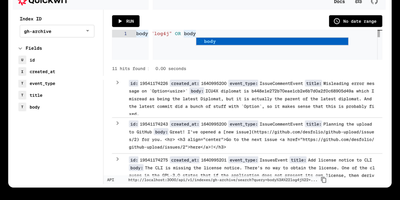
With over 11,000 GitHub stars and now backed by Datadog while remaining fully Apache 2.0 licensed, Quickwit delivers the search performance Elasticsearch users expect at a fraction of the infrastructure cost by moving the index to object storage instead of expensive local SSDs. The Rust-based engine, built on the Tantivy search library with SIMD-accelerated vectorized processing and zero garbage collection overhead, achieves sub-second search latency directly against Amazon S3, Azure Blob Storage, Google Cloud Storage, or any S3-compatible backend like MinIO and Ceph. The Elasticsearch-compatible REST API covers ingest, search, query DSL, and aggregations, enabling existing log shippers including Vector, Fluent Bit, and Syslog to migrate without rewriting configurations. Native OpenTelemetry Protocol endpoints accept logs and traces via gRPC, while Jaeger integration provides a drop-in distributed tracing backend. Ingestion from Apache Kafka, Amazon Kinesis, and Apache Pulsar supports streaming pipelines with multi-index partitioning, and the schemaless JSON indexing mode eliminates the need for upfront schema definitions. Stateless searchers and indexers scale horizontally on Kubernetes or bare metal, with a control plane that distributes indexing tasks and a janitor that manages retention policies and GDPR-compliant deletions. The built-in web UI displays search results and cluster state, while the official Grafana data source enables log exploration dashboards. Running on a dedicated VPS on RepoCloud with guaranteed CPU, RAM, and SSD, full root SSH access, and a browser serial console. Apache 2.0 licensed.
Rootprint
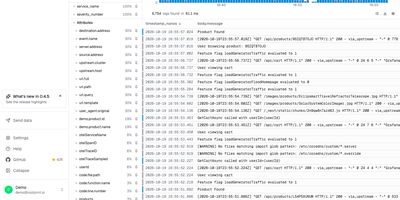
A year of searchable logs and traces no longer needs a metered logging service, because Rootprint keeps the whole index in a storage bucket you already own. A search matches any word on any line, since every log is indexed in full and no service name, stream, or label is needed first. A frequency histogram, one-click field filters, and saved views narrow the results, a fold mode collapses repeated lines, and exports arrive as NDJSON, CSV, or plain text, or as a share link. Open a trace from the log that emitted it, or paste a trace ID, and a waterfall shows per-span timing, attributes, events, and database calls grouped by query, with each span linking back to its logs. The trace explorer charts span volume, error rate, and p50, p95, and p99 latency, ranks the busiest operations, and filters spans by service, duration, and status. Every service gets its own page with request rate, error rate, operations, dependencies, and errors. Data arrives over OpenTelemetry from the Collector, Vector, or Fluent Bit, through a plain HTTP gateway, or by pulling from Kafka, Kinesis, or SQS, with guided setup for nine integrations. Indexes can live in S3, Google Cloud Storage, R2, MinIO, or Azure Blob. Teammates sign in with Google, GitHub, or any OpenID Connect provider, and scoped API keys serve scripts. Running on a dedicated VPS on RepoCloud with guaranteed CPU, RAM, and SSD, full root SSH access, and a browser serial console. Apache-2.0 licensed.
DataHub
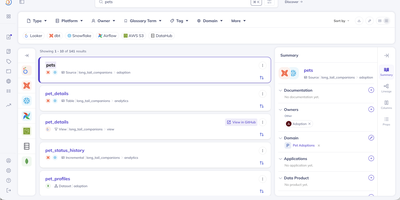
DataHub maps your entire data ecosystem into a searchable, governed catalog where every table, pipeline, dashboard, and metric is discoverable and traceable from source to consumer. Originally built at LinkedIn to manage metadata at hyperscale and proven to handle 10 million+ assets and billions of relationships in production, the platform is now trusted by 3,000+ organizations including Netflix, Visa, Slack, and Pinterest. The Spring Java backend (GMS) exposes both GraphQL and OpenAPI REST endpoints, while the React frontend delivers an intuitive interface for searching, browsing, and governing data assets. The Python-based ingestion framework provides 80+ production-grade connectors extracting deep metadata from Snowflake, BigQuery, Redshift, Databricks, dbt, Airflow, Spark, Kafka, Looker, Tableau, Power BI, Superset, PostgreSQL, MySQL, Hive, Glue, S3, Iceberg, and Unity Catalog through pull-based scheduled crawls and push-based emission via Python and Java SDKs. Automatic table-level and column-level lineage detection uses SQL parsing with 97-99% accuracy, tracing data flows from ingestion pipelines through warehouses to BI dashboards. Real-time metadata streaming via Kafka keeps the catalog continuously synchronized as schemas evolve and pipelines execute. The governance layer provides business glossary management, tag propagation along lineage graphs, domain-based organization, and fine-grained access control policies. DataHub Actions triggers automated responses to metadata changes, enabling notifications, quality checks, and downstream workflows. Elasticsearch powers full-text search with faceted filtering across entities. Running on a dedicated VPS on RepoCloud with guaranteed CPU, RAM, and SSD, full root SSH access, and a browser serial console. Apache 2.0 licensed.
Tianji
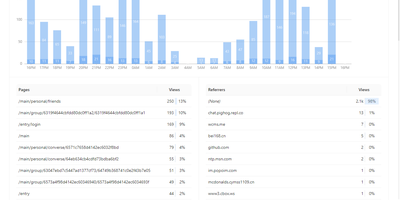
Website analytics, uptime monitoring, and server status - three tools most teams run separately - combined in Tianji, an open-source observability platform. The analytics layer tracks page views, unique visitors, referrers, and UTM parameters with a lightweight cookie-less script, which keeps collection GDPR and CCPA friendly. The uptime monitor checks availability and latency on configurable intervals, accepts passively reported results, and publishes public status pages for incident communication. Server status agents report CPU, memory, disk, and network metrics with threshold-based alerts, and notifications route through webhooks, Slack, Telegram, and other channels with noise control. It also includes anonymous telemetry for tracking deployments of your own open-source projects, surveys, waitlists, team collaboration, and an OpenAPI interface for integrations and exports. The consolidation is the point: traffic analytics, uptime checks, and server metrics share one interface and one alerting layer, so diagnosing an incident does not mean hopping between Google Analytics, Uptime Kuma, and Prometheus - and the built-in public status pages replace a separate paid Statuspage-style subscription. Because collection uses no cookies with IP truncation and aggregation by default, basic traffic measurement requires no consent banner. Built in TypeScript under the Apache 2.0 license and inspired by Umami and Uptime Kuma, it is deliberately right-sized for independent developers and small SaaS teams whose monitoring needs are real but lightweight.
Supercheck
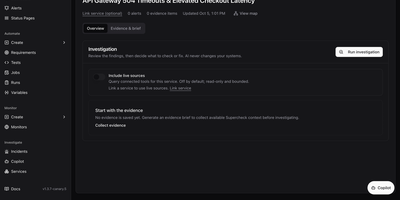
Browser tests, load tests, uptime checks, public status pages, and an AI incident investigator all live in one self-hosted dashboard called Supercheck. Write browser, API, database, custom, and k6 performance tests in a built-in code editor, or record a flow with the Chrome and Edge Recorder extension and save it as a Playwright script. Group tests into scheduled jobs, trigger them from CI with trigger keys, and review run logs, screenshots, traces, and reports. Five monitor types cover HTTP endpoints, website SSL expiry, ping, TCP and UDP ports, and scheduled synthetic browser journeys, with administrator-defined check locations and alerts to email, Slack, Discord, Telegram, Microsoft Teams, or webhooks. Status pages publish component health with 90-day uptime, incidents, scheduled maintenance, badges, and subscriber notifications under a subdomain or custom domain. When something breaks, the incident workspace collects evidence, drafts an evidence brief, and runs a read-only AI investigation across connectors such as GitHub, Prometheus, Grafana, and Kubernetes, while Copilot answers questions about that evidence. Requirements link expectations to tests and show coverage, and AI can extract them from a PRD. Organizations, projects, six roles, API keys, and audit trails keep teams in their lanes, and the CLI pulls, diffs, and deploys resources as code. Running on a dedicated VPS on RepoCloud with guaranteed CPU, RAM, and SSD, full root SSH access, and a browser serial console. AGPL-3.0 licensed.
Parseable
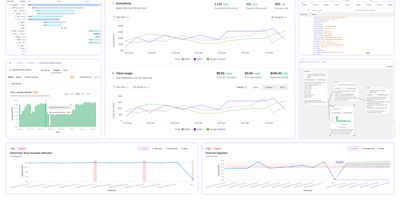
Parseable replaces expensive Elasticsearch clusters and fragmented monitoring stacks with a single Rust binary that ingests, queries, and stores logs, metrics, and traces on commodity object storage at a fraction of the cost. The data lake architecture decouples stateless compute from S3-compatible storage, enabling independent scaling of ingestion throughput and query capacity while cutting storage costs by up to 90% compared to indexed alternatives. OpenTelemetry-native OTLP ingestion accepts telemetry from existing OTel collector pipelines, Prometheus Remote Write endpoints, Kafka consumers, eBPF probes, and popular logging agents including Fluentd, Fluent Bit, and Vector without proprietary format conversions. The SQL-first query interface enables cross-signal analysis across all telemetry types, while native PromQL support with 50+ functions and 12 aggregation operators provides Prometheus-compatible metrics querying that works directly with Grafana dashboards. Built-in features include customizable dashboards, real-time alerting with Webhook, Slack, and Alertmanager targets, role-based access control, OpenID single sign-on integration, LogIQ automatic unstructured-to-structured log transformation, smart caching for frequently accessed data, and retention policies for lifecycle management. AI-powered Keystone Q&A provides natural language to SQL conversion and dataset summarization. All data stored as standard Apache Parquet on object storage remains accessible to any Parquet-compatible engine (DuckDB, Spark, Trino), ensuring zero vendor lock-in. Deploys on AWS S3, Azure Blob, Google Cloud Storage, MinIO, Wasabi, and DigitalOcean Spaces. Running on a dedicated VPS on RepoCloud with guaranteed CPU, RAM, and SSD, full root SSH access, and a browser serial console. Apache 2.0 licensed.

RocketplaneIO
RocketplaneIO is a self-hosted AI SRE platform that gives Kubernetes clusters zero-instrumentation eBPF observability plus a copilot capable of safely diagnosing and fixing issues without your telemetry ever leaving your infrastructure. Point it at any cluster, and an eBPF DaemonSet starts capturing HTTP, gRPC, SQL, Redis, and Kafka spans across every service, including compiled binaries, with cross-service context propagation and no code changes required. The live service map draws itself from actual network traffic, matching technology logos from container images and coloring each node's health from RED metrics. Every log line sits two clicks from its parent distributed trace, and a PromQL query engine, embedded from the real Prometheus evaluator, runs over ClickHouse for long-term metric retention. The complete Kubernetes inventory (Services, Ingress, ConfigMaps, network policies, persistent volumes, CRDs) syncs continuously and is searchable alongside traces and logs. When the copilot identifies a problem, it picks from a catalog of roughly 30 risk-classified safe actions; each action verifies its preconditions, captures a before-state snapshot, executes, checks the result, and rolls back automatically on failure. Disruptive operations pause for explicit human approval before proceeding. An MCP endpoint exposes the identical guardrailed toolbox to external AI agents, so Claude Code or Cursor can operate the cluster through the same safety boundary the browser copilot uses. Complex remediations compose as searchable, forkable Starlark workflows that compile deterministically at save. Running on a dedicated VPS on RepoCloud with guaranteed CPU, RAM, and SSD, full root SSH access, and a browser serial console. Apache-2.0 licensed.
BitRouter
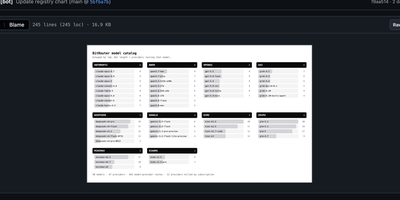
BitRouter is a context-aware LLM router that learns which model delivers the cheapest successful outcome per workflow step, cutting agent costs by up to 80% while maintaining 96% quality versus all-frontier baselines. Point any agent runtime at http://localhost:4356 with a one-line OPENAI_BASE_URL change and BitRouter routes to OpenAI, Anthropic, Google, Groq, DeepSeek, Mistral, Moonshot, MiniMax, Nvidia, and any OpenAI-compatible endpoint simultaneously, normalizing authentication, streaming, and cross-protocol translation between wire formats. The act-observe-evaluate-learn loop traces every hop with cost, tokens, and latency attribution, scores each decision against a versioned policy-lock.yaml, then tightens routes automatically with no LLM judge in the path. Native MCP gateway auto-discovers tools from connected servers and makes them routable and governed alongside model calls. Agent Client Protocol integration enables the TUI to manage Claude Code, Codex, OpenCode, OpenClaw, Gemini, and Copilot sessions in real time with inline tool-call approval and live streaming. Built-in guardrails inspect, redact, or block risky content before requests leave your network. Virtual keys scope API access per agent or user without exposing upstream credentials. Per-agent spend caps and loop guards contain runaway cost automatically. Multi-account failover reroutes mid-run so rate limits never re-pay completed work. Ships as a single Rust binary via npm or Cargo. Running on a dedicated VPS on RepoCloud with guaranteed CPU, RAM, and SSD, full root SSH access, and a browser serial console. Apache 2.0 licensed.
Icinga 2
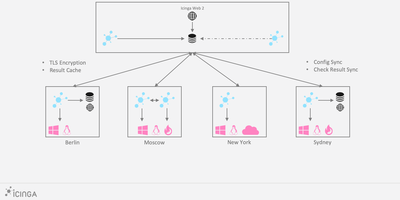
Servers, services, and network gear report their health to Icinga 2, the open-source monitoring core that runs checks, evaluates thresholds, and decides who gets woken up. A distributed hierarchy of master, satellite, and agent zones scales from a single box to global estates: satellites execute checks in remote regions and keep working when the master is unreachable, while agents run local checks under TLS-secured, certificate-based trust. The object-based configuration language defines hosts, services, dependencies, and notification rules as code, with apply rules generating checks across whole groups automatically. Performance data streams into Graphite, InfluxDB, or Elasticsearch writers, and Icinga DB carries runtime state and history into Redis and SQL for the web frontends. The REST API drives acknowledgements, downtimes, and check scheduling from scripts and chat tools, with fine-grained permissions down to diagnostic information. The 2.16 line hardens API security, streams richer runtime updates to Icinga DB for the new Icinga Notifications 1.0 incident workflows, and lets operators set exact acknowledgement times through the API. Running on a dedicated VPS on RepoCloud with guaranteed CPU, RAM, and SSD, full root SSH access, and a browser serial console. GPL-3.0-or-later licensed.
LaraOwl
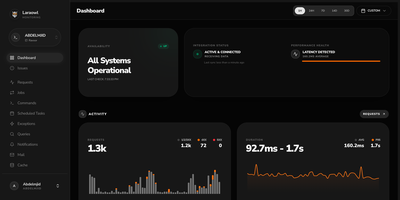
LaraOwl watches your Laravel applications from your own server, streaming every request, exception, slow query, and attack attempt into one live dashboard. Install one Composer package in each app, point it at your LaraOwl server, and requests arrive with method, path, status, duration, and middleware timing attached. Exceptions group themselves by fingerprint with stack traces, occurrence counts, and first and last seen times, so a resolved bug that comes back announces itself. Slow queries and N+1 patterns are flagged with execution times, jobs report failures and retries, and scheduled tasks check in like heartbeats that complain when they stop. A built-in security lens scores threats such as SQL injection, cross-site scripting, and path traversal, tracks hostile IPs, and can push a block into your Cloudflare firewall in one click. Uptime checks run every thirty seconds, alerts fan out to Slack, Discord, Telegram, email, or any webhook, and throttles keep a bad night from becoming a thousand messages. Teams organize multiple projects with their own tokens, thresholds, and retention policies, and daily pruning keeps last quarter's noise from filling the disk. Running on a dedicated VPS on RepoCloud with guaranteed CPU, RAM, and SSD, full root SSH access, and a browser serial console. Apache-2.0 licensed.
Grafana OnCall
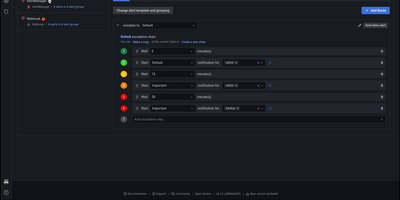
With 3,900 GitHub stars, 140 contributors, and 380 releases since its 2022 launch, Grafana OnCall delivers developer-friendly incident response that routes alerts from any monitoring system to the right engineer at the right time through the right channel. The platform accepts alerts via unique API URLs from Alertmanager, Grafana Alerting, Zabbix, Datadog, Pagerduty-compatible sources, Jira, inbound email, and generic HTTP webhooks, then applies routing templates to direct each alert to the appropriate escalation chain. Escalation chains define notification sequences — notify the primary on-call via Slack, wait 5 minutes, escalate to SMS and phone, wait 10 minutes, page the secondary on-call and notify the engineering manager — continuing until acknowledgment or resolution. On-call schedules support multi-layer rotations with overrides, shift swaps, and timezone-aware handoffs rendered directly inside Grafana dashboards. ChatOps integration publishes alert groups to Slack channels and Telegram groups with interactive buttons for acknowledge, resolve, and silence actions. Template engines based on Jinja2 control alert grouping, appearance rendering, and behavioral automation. The REST API enables programmatic management of integrations, schedules, and escalation policies. Deploy via Docker Compose with PostgreSQL, Redis, and Celery workers alongside your existing Grafana instance. Running on a dedicated VPS on RepoCloud with guaranteed CPU, RAM, and SSD, full root SSH access, and a browser serial console. GNU AGPL v3 licensed.
Netra
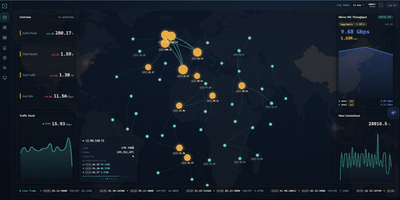
Netra watches your network from the side, plugged into a switch mirror port, and turns everything it sees into a live picture of your traffic without ever sitting in the forwarding path. A single binary loads its eBPF collectors in the kernel, so aggregation happens before packets reach user space and multi-gigabit mirror feeds stay observable instead of dropping samples. The dashboard opens on totals, protocol share, and traffic trends, then lets you drill into flows by address, port, domain, or service, check which countries your traffic talks to on a world map, and read the internal topology as a live graph. Domains surface passively from TLS handshakes, public addresses are enriched with country and organization data, and heuristic detectors flag scanning, flooding, and single-host surges, pushing alerts to your team chat with an optional AI-written explanation. You can ask the built-in assistant questions about real recorded history, connect external MCP servers so it can call your own tools while it answers, and stream flows onward to Kafka for other consumers. History rolls into compressed columnar files on a schedule and stays queryable for a month by default. Running on a dedicated VPS on RepoCloud with guaranteed CPU, RAM, and SSD, full root SSH access, and a browser serial console. GPL-3.0 licensed.
ContainerFlow
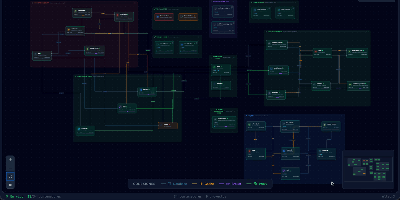
Your database container is probably not at 98 percent memory, whatever docker stats claims, because most of that figure is reclaimable page cache; ContainerFlow subtracts the full cache and shows the memory your containers actually hold. Point it at a Docker socket and it draws the whole estate as a living map: every Compose project discovered automatically, services grouped and colour coded, and the connections between them inferred, app to database, proxy to app, worker to broker. CPU and memory refresh every three seconds, the graph flashes when a container starts, stops, or restarts, and seven days of metric history wait in a local store when you need to know what happened overnight. Click any node and a detail panel opens with live logs you can filter by stream, an inline terminal that runs commands inside the container, and buttons to start, stop, restart, rebuild, recreate, or remove it. The same panel teaches as it works, flagging containers that run with no memory limit, no CPU limit, or no restart policy, while Discord webhooks fire when a container you care about crosses a threshold you set. Running on a dedicated VPS on RepoCloud with guaranteed CPU, RAM, and SSD, full root SSH access, and a browser serial console. AGPL-3.0 licensed.
Moneat
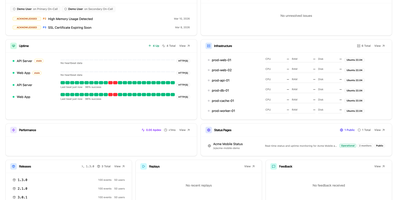
Moneat is the open-source observability platform that unifies error tracking, session replay, performance monitoring, logging, uptime checks, synthetics, product analytics, and AI observability into a single self-hosted application — replacing Sentry, Datadog, and Statuspage with one deployment. The Sentry SDK compatibility layer accepts data from @sentry/browser, @sentry/node, @sentry/react, @sentry/nextjs, sentry-sdk for Python, sentry-kotlin, sentry-java, sentry-android, sentry-cocoa, sentry-go, sentry-ruby, and Sentry.NET by updating one DSN endpoint. Datadog Agent compatibility redirects existing fleets by setting dd_url, and native OpenTelemetry OTLP ingestion accepts logs, traces, and metrics from any exporter or Collector. Error monitoring groups exceptions with smart deduplication, session replay records DOM-based user interactions linked to errors, distributed tracing visualizes transaction and span breakdowns with live service maps, and continuous profiling renders flamegraphs in pprof, JFR, and Sentry formats. Uptime monitoring runs HTTP, TCP, and ping checks with public status pages, while synthetics executes API tests, multi-step workflows, SSL checks, and DNS probes. Custom dashboards support drag-and-drop widgets with Grafana import, product analytics provides funnels and retention cohorts, release tracking surfaces crash-free rates with source map upload, and AI observability traces LLM calls end to end. Built on Kotlin and Java with ClickHouse for analytical storage, PostgreSQL for relational data, and Redis for caching, deployment uses Docker Compose with an interactive installer automating secrets and service orchestration. Running on a dedicated VPS on RepoCloud with guaranteed CPU, RAM, and SSD, full root SSH access, and a browser serial console. AGPL-3.0 licensed.
GlitchTip
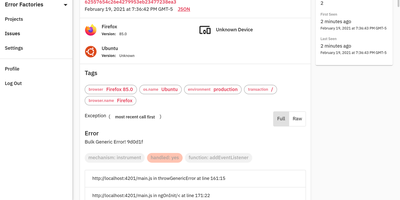
GlitchTip speaks Sentry's protocol without Sentry's operational weight - open-source error tracking that your existing SDKs already understand. The pitch is pragmatic: instrument your application with the official Sentry SDKs you already know - any language they cover - and point the DSN at your own GlitchTip instance instead. Errors, exceptions, log messages, and Content Security Policy violations flow into one place for triage, grouped into issues with stack traces, with alerts delivered by email or webhook the moment things break. Where self-hosted Sentry has ballooned into a docker-compose stack of twenty-plus containers, GlitchTip is a deliberately lean Django and PostgreSQL application a small team can actually run. Beyond errors, it bundles three more monitoring concerns: performance monitoring takes a works-out-of-the-box approach - no dashboard building, just your slowest web requests, database queries, and transactions surfaced automatically; uptime monitoring pings your sites and alerts on failures, or runs in reverse as a dead-man's-switch heartbeat for cron jobs that must check in on schedule; and log search puts application logs alongside errors for faster debugging. Unlimited projects and team members, MIT-licensed, built by Burke Software - your event volume is limited only by your own hardware.