Komodo
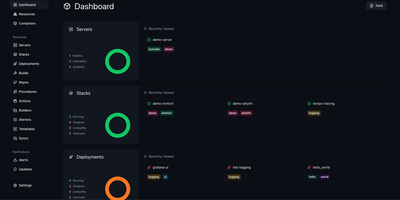
Komodo puts every server, container, and deployment pipeline behind a single dashboard where you build, ship, and monitor Docker workloads across unlimited hosts. Lightweight stateless agents install on each connected server and report CPU, memory, and disk metrics back to the Rust-powered core, giving you real-time visibility without heavyweight monitoring stacks. Docker Compose stacks deploy directly from the UI or link to Git repositories with webhook-triggered automatic redeploys on push. A built-in CI pipeline compiles versioned Docker images from source, with optional AWS spot instances for burst build capacity. For orchestration at scale, Docker Swarm management handles node configuration, service deployment, and multi-node stack orchestration from the same control plane. Browser terminal sessions open persistent named shells on servers and inside containers, complete with shared team access and scriptable Actions that chain executions into multi-stage procedures. Infrastructure-as-code support defines all resources declaratively in TOML files within a Git repository, keeping production state version-controlled and auditable. Granular role-based access control with user groups, per-resource permissions, and OAuth through GitHub and Google keeps teams operating within defined boundaries. A full OpenAPI specification, dedicated CLI, and typesafe client libraries for Rust and TypeScript make programmatic integration straightforward. With 12,000+ stars and active development, the community continues expanding multi-architecture builds and Swarm tooling.
xyOps
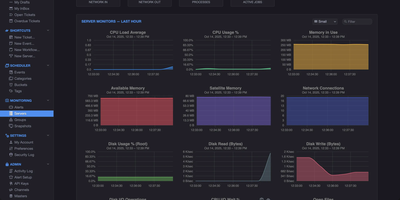
With 4,500+ GitHub stars and version 1.0.92 released August 2026, xyOps delivers a complete operations platform that unifies workflow automation, job scheduling, server monitoring, alerting, and incident response in one self-hosted system. The platform uses a distributed architecture where a central conductor coordinates lightweight xySat satellite agents running on Linux, macOS, or Windows worker nodes via persistent WebSocket connections. The visual workflow builder lets you chain events, triggers, actions, and monitors into multi-step pipelines with conditional logic, fan-out/fan-in parallelism, multiplex controllers for fleet-wide execution, and configurable resource limits. QuickMon provides per-second CPU, memory, disk, and network visibility streamed live to the web UI, while user-defined monitor plugins sample metrics every minute with time-series storage at hourly, daily, monthly, and yearly resolutions. Alert triggers evaluate expressions against live data and fire notifications via email, webhook, or custom actions, with full server snapshots attached showing every running process, network connection, and resource utilization at the moment of detection. Failed jobs and alerts automatically create tickets with linked logs, metrics history, and context for end-to-end incident tracking. The plugin marketplace supports extensions written in any language, and the Docker plugin enables container-based job execution. Deploy via Docker with persistent volumes on port 5522 for the web UI and 5523 for API access, running on a dedicated VPS on RepoCloud with guaranteed CPU, RAM, and SSD, full root SSH access, and a browser serial console. BSD-3-Clause licensed.
Checkcle
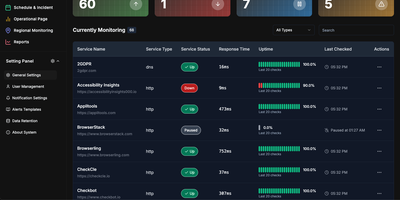
CheckCle provides a complete uptime monitoring and infrastructure observability platform that deploys with a single Docker container and stores all data in embedded SQLite via PocketBase. The Go backend runs three microservices — a service operation engine handling HTTP, HTTPS, DNS, Ping, and TCP checks at configurable intervals, a distributed regional check agent for multi-location network testing, and a server monitoring agent collecting CPU, RAM, disk usage, and network metrics via gRPC. The React frontend built with Vite, TypeScript, Tailwind CSS, and shadcn-ui subscribes to PocketBase WebSocket endpoints for real-time dashboard updates without polling. SSL and domain monitoring tracks certificate issuers, expiration dates, days remaining, and validation status. The incident management system records UP, DOWN, WARNING, and PAUSE states with full history, while scheduled maintenance windows prevent false alerts during planned downtime. Public status pages provide external stakeholders with live service health information. Health heatmaps visualize uptime performance and outage patterns over time. Notification channels include email, Telegram, Discord, and Slack, with multiple alert targets per monitored service. The one-click agent installation script supports Debian, Ubuntu, CentOS, Red Hat, Alpine, and Windows in beta. Docker deployment runs on port 8090 with a single persistent volume at /mnt/pb_data, requiring minimum 1 vCPU and 500MB RAM. On RepoCloud, deploy CheckCle on a dedicated VPS with root SSH access, persistent storage for your monitoring database, and complete control over agent endpoints and notification configurations, all under the MIT license.
CoreObs
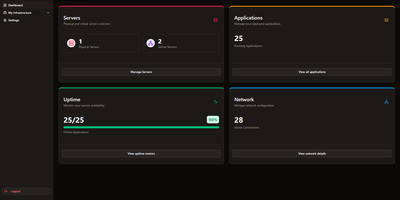
CoreObs delivers a unified self-hosted dashboard that replaces the typical combination of Uptime Kuma, Homer, and separate monitoring tools with a single interface for managing your entire server infrastructure. The Next.js frontend with shadcn components provides a modern dark-themed UI displaying server hardware metrics collected by a lightweight Go agent that leverages Glances for hardware abstraction — streaming real-time per-core CPU load, RAM utilization, NVIDIA GPU statistics, disk usage, system uptime, and load averages via WebSocket connections. The application registry tracks all self-hosted services with configurable uptime monitoring, availability history charts, and instant notifications through Discord, Telegram, Pushover, and email when services go down or recover. Quick-access links provide one-click navigation to each application's management panel directly from the dashboard. The network visualization module built on React Flow enables creating visual topology maps of your infrastructure with drag-and-drop nodes representing servers, switches, and services connected by labeled edges. Server data can be organized with tags, copied between entries, and monitored with configurable pagination and compact view modes. Deploy via Docker Compose with three containers — the Next.js web interface, the Go monitoring agent, and PostgreSQL 17 for persistent storage. Running on a dedicated VPS on RepoCloud with guaranteed CPU, RAM, and SSD, full root SSH access, and a browser serial console. MIT licensed.
ServerBee
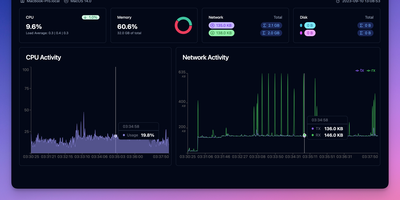
ServerBee delivers complete fleet monitoring from a single Rust binary that embeds both the server and web UI, requiring no external database or heavy runtime. Lightweight agents installed on each node stream CPU, memory, disk, network, load, temperature, GPU, and disk I/O metrics over persistent WebSocket connections to a central server backed by embedded SQLite. The real-time React dashboard presents 17 drag-and-drop widget types across custom layouts, with historical charts spanning one hour to 30 days and monthly traffic statistics with billing-cycle prediction and cost insights including burn rate and per-resource unit cost scoring. Network monitoring covers ICMP, TCP, and HTTP ping probes, service monitors for SSL certificates, DNS records, HTTP keyword matching, TCP ports, and WHOIS expiration, plus network-quality probing across 96 China 3-ISP and international presets with IP-quality and streaming-unlock detection. Remote management features include a web terminal with sandboxed file manager, Docker container stats with logs and events, firewall configuration, and agent auto-update capabilities. Public status pages display 90-day uptime timelines, while alerting supports email and webhook notifications with flexible trigger expressions. A native iOS companion app provides mobile monitoring access. Deploy via Docker or download the single binary for Linux, macOS, or Windows, running on a dedicated VPS on RepoCloud with guaranteed CPU, RAM, and SSD, full root SSH access, and a browser serial console. AGPL-3.0 licensed.