Metabase
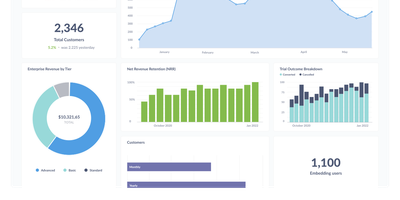
The most widely deployed open-source BI tool, Metabase is a visualization and query layer that sits on top of your existing databases without ingesting or copying data. Non-technical users ask questions through a visual query builder with drill-through menus that answer follow-ups like "broken down by month" without writing a new query, while analysts use the native SQL editor with variables and templates for complex work. Questions assemble into interactive dashboards with filters, auto-refresh, fullscreen mode, and custom click behavior, and dashboard subscriptions email or Slack scheduled reports to stakeholders. It connects to 20+ data sources including PostgreSQL, MySQL, MongoDB, SQL Server, BigQuery, Snowflake, Redshift, and ClickHouse - always querying in place, so there is no second data store to secure, sync, or pay for, and results are always current. Models and metrics let a data team define official, reusable starting points so self-service stays consistent, collections with permissions organize content, and alerts fire when a metric crosses a threshold. The practical effect is cutting the ad-hoc query queue that lands on the data team, since non-technical staff can answer their own questions. Written in Clojure, licensed AGPL, and shipped as a single JAR or Docker image with an embedded application database - a working BI instance runs before most tools finish their installer - the open-source edition has no limits on users, dashboards, or connected databases, where commercial BI platforms price per viewer as well as per creator.
Chartbrew
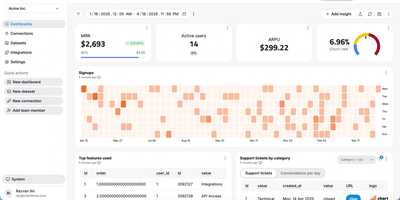
Chartbrew transforms raw database queries and API responses into polished, shareable dashboards without requiring a data engineering team. Connect to MySQL, PostgreSQL, MongoDB, Firestore, or any REST API, then build datasets using the visual query editor with syntax highlighting and auto-completion. Charts render through Chart.js with line, bar, pie, donut, radar, polar, KPI card, and table visualizations, each customizable with colors, legends, filters, and goal indicators. An AI assistant accelerates dashboard creation by generating queries and suggesting chart configurations from natural language descriptions of the metrics you want to track. Reusable datasets let teams prepare data transformations once and share them across multiple charts, while automatic scheduling through BullMQ and Redis refreshes data at intervals from every 10 minutes to monthly. The embed feature generates standalone chart URLs for insertion into external websites, internal tools, or customer portals, and the Reporting API enables programmatic dashboard management and automated report delivery. Team workspaces with role-based permissions control who can view, edit, or manage data connections. Nearly 4,000 GitHub stars reflect steady community adoption. The platform runs on Node.js with Express and Sequelize ORM, supporting MySQL or PostgreSQL as its application database. Running on a dedicated VPS on RepoCloud with guaranteed CPU, RAM, and SSD, full root SSH access, and a browser serial console. FSL-1.1-MIT licensed (converts to MIT two years after each release).
Pythia
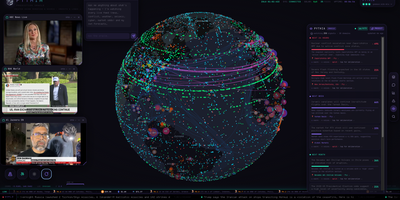
With over 400 GitHub stars and growing, Pythia transforms a local LLM into a self-calibrating geopolitical oracle that watches the entire planet and predicts what happens next — no API keys, no cloud, no cost. The Osiris-based Three.js globe frontend streams 30+ concurrent live feeds including GDELT geopolitics, armed conflict events, USGS earthquakes, NWS storm polygons, EONET disasters, FIRMS wildfires, Polymarket crowd odds, cryptocurrency and commodity prices, UNHCR displacement data, WHO disease outbreaks, and WFP food insecurity indicators. The FastAPI backend fuses these heterogeneous sources into a unified world brief, pipes it through Ollama, and generates located predictions across 24-hour, weekly, monthly, and yearly horizons — each carrying a probability, reasoning, and geocoordinates that fly the globe to the event. A council of four specialist swarm agents — Strategist, Economist, Naturalist, and Skeptic — re-scores every forecast, surfacing consensus, dissent, and splits through Brier-weighted voting where historically accurate personas earn louder votes. The engine maintains a persistent ledger graded by an LLM judge against archived world state, producing running Brier scores and calibration charts. Signal rules fire browser notifications and webhooks when conditions match, a morning brief digest summarizes overnight changes, and the agent API at port 8088 delivers the complete world view in a single JSON call compressed to approximately 50 tokens for AI agent consumption. Running on a dedicated VPS on RepoCloud with guaranteed CPU, RAM, and SSD, full root SSH access, and a browser serial console. MIT licensed.
WhoDB
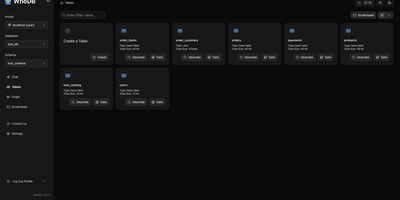
With nearly 5,000 GitHub stars earned in under two years, WhoDB has rapidly emerged as the lightweight alternative to heavyweight database clients like DBeaver and DataGrip by delivering a sub-50MB binary that starts in under a second and connects to 18+ database systems from a single interface. The Go backend serves the React and TypeScript frontend with table virtualization for efficient rendering of large result sets, lazy loading, and query result streaming that keeps the interface responsive even when browsing tables with millions of rows. The Community Edition connects to PostgreSQL, CockroachDB, YugabyteDB, MySQL, MariaDB, TiDB, SQLite, DuckDB, MongoDB, FerretDB, Redis, Valkey, Dragonfly, Elasticsearch, OpenSearch, ClickHouse, QuestDB, and Memcached through a unified credential selector that switches between databases with minimal configuration. Interactive schema diagrams render entity-relationship graphs showing table structures, foreign keys, and column types for visual database exploration. The Jupyter-style query scratchpad provides SQL autocomplete, syntax highlighting, and multi-statement execution with paginated results. AI integration optionally connects to Ollama, OpenAI, Anthropic, LM Studio, or any OpenAI-compatible provider for natural language database queries — ask questions in plain English and receive generated SQL. Data management includes inline row editing, CSV export, and filtered data views. Docker deployment runs a single container exposing port 8080. Running on a dedicated VPS on RepoCloud with guaranteed CPU, RAM, and SSD, full root SSH access, and a browser serial console. Apache-2.0 licensed.
LightDash
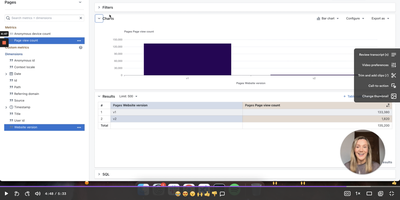
With 5,600+ GitHub stars and deep dbt integration, Lightdash is the open-source Agentic BI platform that treats analytics like software — defining metrics, dimensions, joins, permissions, and caching in a governed context layer that powers dashboards, AI agents, data apps, embedded analytics, and MCP server endpoints simultaneously. The dbt Write-Back feature lets business users create custom metrics and models in the UI, then automatically generates pull requests in GitHub or GitLab so every change flows through code review and CI validation before reaching production. Context-specific AI analysts automatically select relevant models and metrics, build queries, and present insights in plain English, while row-level security, user attributes, and customer-facing permissions ensure data governance at every layer. The platform connects to BigQuery, Snowflake, Redshift, Databricks, PostgreSQL, Trino, and ClickHouse through warehouse adapters, with the TypeScript monorepo built on React, Mantine, Vite, and TanStack Query on the frontend plus Node.js, Express, Knex, and PostgreSQL on the backend. Data teams build analytics with coding agents, preview changes from the CLI, validate in CI pipelines, and review charts and dashboards in pull requests — making the entire analytics lifecycle version-controlled and reproducible. Running on a dedicated VPS on RepoCloud with guaranteed CPU, RAM, and SSD, full root SSH access, and a browser serial console. MIT licensed.
Livebook
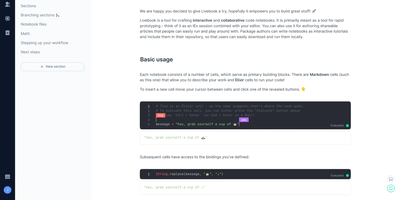
Livebook is an interactive notebook for Elixir where you write code alongside rich Markdown prose, execute it cell by cell with reactive dependency tracking, and deploy finished notebooks as standalone web applications with a single click. Nearly 6,000 GitHub stars reflect the Elixir core team's investment in a platform where code cells run on demand alongside Mermaid diagrams and KaTeX mathematical formulas. The Kino visualization library renders Vega-Lite charts, interactive data tables with sorting and pagination, Leaflet maps, and Mermaid diagrams directly within notebook output cells, while custom Kino components enable building interactive controls with sliders, text inputs, and buttons that feed values back into running code. Smart cells abstract high-level tasks into configurable UI widgets: query PostgreSQL, MySQL, SQLite, and BigQuery databases, train machine learning models with Axon, plot charts, and build map visualizations without writing boilerplate code. Real-time collaboration lets multiple users edit the same notebook simultaneously with cursor presence indicators and synchronized cell evaluation. Notebooks are stored as .livemd files, a Markdown-compatible format that renders cleanly on GitHub and integrates with standard version control workflows. Custom runtimes connect Livebook to existing Elixir applications for live introspection and documentation of running systems. The Docker image at ghcr.io/livebook-dev/livebook exposes ports 8080 and 8081 with password or token authentication. Running on a dedicated VPS on RepoCloud with guaranteed CPU, RAM, and SSD, full root SSH access, and a browser serial console. Apache 2.0 licensed.
Frappe Insights
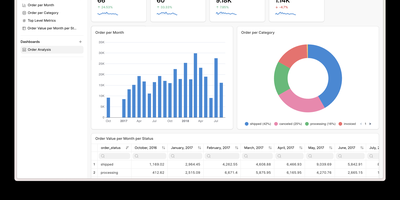
Frappe Insights delivers a self-hosted business intelligence platform where non-technical users build complex analytical queries without writing SQL. The visual query builder uses Ibis under the hood to compose optimized SQL from drag-and-drop column selections, filters, aggregations, and group-by operations — translating point-and-click interactions into performant database queries across MySQL, PostgreSQL, DuckDB, and BigQuery. The join editor provides a graphical interface for defining multi-table relationships, letting analysts connect data across schemas without understanding foreign keys or join types. The chart builder renders interactive visualizations using Apache eCharts with support for bar, line, area, pie, scatter, funnel, and pivot table chart types — each configurable with axes, colors, legends, and formatting options. Dashboards combine multiple charts into shareable views with layout customization, auto-refresh intervals, and filter propagation across widgets. Data source management handles connection pooling across multiple databases simultaneously, enabling cross-database analysis in single queries. Server scripts extend query capabilities with custom Python transformations for complex business logic that visual tools cannot express. Built on the Frappe Framework's full-stack architecture, deployment uses Docker via the official easy-install script that provisions the complete stack including MariaDB, Redis, and Nginx. Running on a dedicated VPS on RepoCloud with guaranteed CPU, RAM, and SSD, full root SSH access, and a browser serial console. AGPL-3.0 licensed.
Apache Superset
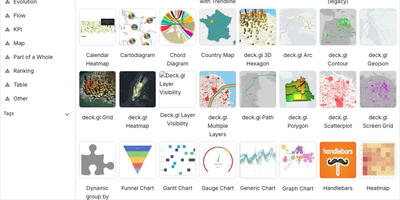
Powering data analytics at companies like Airbnb, Twitter, and Lyft where it originated, Apache Superset has become the leading open-source business intelligence platform with over 65,000 GitHub stars and an Apache Software Foundation top-level project designation. The platform ships with over forty visualization types out of the box including geographic maps, time-series charts, pivot tables, heatmaps, treemaps, and Sankey diagrams, all rendered with Apache ECharts for publication-quality output. Its SQL Lab provides a full-featured IDE experience with syntax highlighting, autocomplete, query history, and result caching for interactive data exploration. Superset connects natively to PostgreSQL, MySQL, ClickHouse, Trino, Presto, BigQuery, Snowflake, Apache Druid, Apache Hive, and dozens more databases through SQLAlchemy connectors, with support for custom database drivers via Python plugins. The semantic layer allows data teams to define calculated columns, metrics, and virtual datasets that business users can query without writing SQL. Role-based access control with row-level security enables fine-grained data governance, while the embedded analytics SDK lets you integrate dashboards directly into external applications via iframes with SSO pass-through. The caching layer supports Redis and Memcached for query result caching, and the asynchronous query execution engine powered by Celery handles long-running queries without blocking the UI. Alerts and reports can be scheduled via email or Slack with PNG or CSV attachments generated from any chart or dashboard. Running on a dedicated VPS on RepoCloud with guaranteed CPU, RAM, and SSD, full root SSH access, and a browser serial console. Apache 2.0 licensed.
CloudBeaver
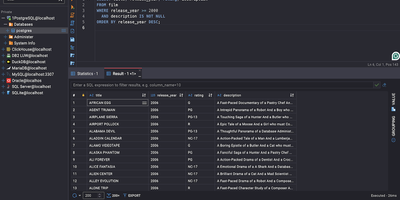
CloudBeaver puts a full-featured database management environment in your browser, connecting to PostgreSQL, MySQL, SQL Server, Oracle, ClickHouse, and over 100 additional engines through one unified interface that requires no desktop client installation. The Java server exposes a TypeScript/React frontend through a GraphQL API where teams can browse schemas, edit data, visualize relationships, and execute queries across all connected databases in a single workspace. The SQL Editor provides syntax highlighting, auto-completion with fuzzy search, AI-assisted SQL generation from natural language prompts, script management with save/download/upload capabilities, execution plan visualization, and multi-tab result display. The Data Editor enables direct cell editing, filtering, sorting, and bulk data modification with support for spatial GIS data rendering. Database administrators access a Navigator panel for browsing schemas, tables, views, foreign tables, triggers, dependencies, and stored procedures across all connected databases. ER Diagrams visualize table relationships and schema structure, while the Visual Query Builder constructs queries without hand-writing SQL. Multi-user administration provides role-based access control, connection sharing with configurable permissions, and session management. SSH tunneling secures remote database connections, and data can be exported or imported in multiple formats. Query History tracks all executed statements with timestamps and execution statistics. Running on a dedicated VPS on RepoCloud with guaranteed CPU, RAM, and SSD, full root SSH access, and a browser serial console. Apache 2.0 licensed.

Gods Eye View
God's Eye View turns your browser into a real-time spatial intelligence command center, rendering thousands of live aircraft, ships, satellites, earthquakes, traffic flows, and public cameras on a photorealistic 3D Earth powered by CesiumJS and Google Photorealistic 3D Tiles. Click any aircraft to see its transponder telemetry from OpenSky and adsb.lol, including route history, altitude, speed, and callsign; track live vessel positions worldwide through AIS beacon data from AISStream; or follow roughly 840 satellites color-coded by class using orbital elements from CelesTrak. A hands-free voice agent powered by the OpenAI Realtime API lets you ask the planet questions in natural language, and the globe annotates your answer directly in 3D space. Toggle FLIR mode for a thermal camera aesthetic, layer in NASA FIRMS wildfire data, switch between Google 3D, Bing aerial, and OpenStreetMap base layers, or tune into a geolocated world radio dial. Public CCTV cameras are projected into 3D city geometry with viewshed cones and direct-manipulation calibration. The cockpit mode provides a pilot-style briefing surface with mission-specific overlays. Entity inspection panels show detailed metadata for every tracked object, and shareable links let you send any scene configuration to a colleague. Ten of the thirteen live data layers work with zero API keys, while the required Google Maps key offers 1,000 free 3D tile sessions per month. Running on a dedicated VPS on RepoCloud with guaranteed CPU, RAM, and SSD, full root SSH access, and a browser serial console. MIT licensed.
ToolJet
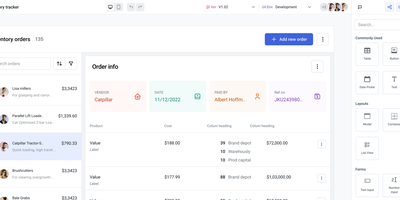
Retool's job, self-hosted: ToolJet is an open-source low-code platform for building internal tools, dashboards, and admin panels. Apps are assembled in a drag-and-drop visual builder with 60+ responsive components, including tables, charts, forms, and lists, and connected to 80+ data sources: PostgreSQL, MySQL, MongoDB, REST and GraphQL APIs, cloud storage, and common SaaS tools. When visual configuration is not enough, you can run JavaScript or Python inline for queries and transformations. A built-in no-code database (ToolJet Database) covers apps that need their own tables without provisioning an external database, Workflows add node-based automation for background jobs with dedicated worker containers and a Redis-backed queue, and multi-page apps with multiplayer editing, inline comments, and mentions support team development. Security is designed for internal data: credentials are AES-256-GCM encrypted, data flows proxy-only through your server so database contents never reach a third-party cloud, and granular per-app access control plus SSO gate each tool. Where Retool-style platforms bill per builder and sometimes per end user, the self-hosted Community Edition serves unlimited builders and users at hosting cost, and full source availability means the platform itself can be forked, audited, and extended. The stack is Node.js and React on PostgreSQL, deployed via Docker.
ChartDB
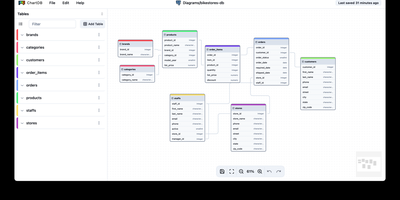
Paste one SQL query result into a browser and get an interactive entity-relationship diagram instantly, with no installations, no credentials, and no account required. ChartDB's "Smart Query" runs a single statement in your existing database client that exports table definitions, relationships, indexes, and column types as JSON metadata, meaning the application never touches your database passwords. The canvas renders draggable entities with cardinality markers, collapsible grouping areas, and sticky notes for documentation. AI-powered DDL export generates migration scripts between dialect pairs like PostgreSQL to MySQL or SQLite to CockroachDB, analyzing your schema to produce target-specific DDL with correct type mappings and constraint translations. Import paths cover Smart Query JSON, raw DDL scripts, and DBML files from tools like dbdiagram.io. The AI layer connects to OpenAI or any compatible inference server including local vLLM instances running models like Qwen2.5-32B. Database coverage includes PostgreSQL (with Supabase and Timescale extensions), MySQL, SQL Server, MariaDB, SQLite (with Cloudflare D1), CockroachDB, ClickHouse, and Oracle. Exports to SVG with inline styles or SQL DDL in any target dialect. Ships as a React/Vite frontend behind Nginx in Docker, deployable on RepoCloud with dedicated VPS resources under the AGPL-3.0 license.
Homelable
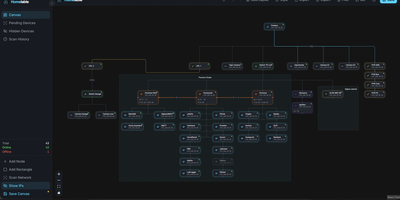
Homelable turns your entire homelab into a live, interactive network canvas where every device, link, and service shows its real-time status at a glance. Run an nmap-powered network scan against your subnets and the tool fingerprints services, queues unknown devices for review, and drops approved hosts onto a drag-and-drop canvas with 15 native node types covering routers, switches, hypervisors, NAS boxes, IoT sensors, and more. Import your full Zigbee2MQTT mesh (controllers, routers, end devices with link quality indicators) and Z-Wave JS device trees in one click, preserving the actual RF topology without manual wiring. Proxmox integration pulls in hosts, VMs, and LXC containers so you can nest virtual machines inside their parent hypervisor node on the canvas. The Rack Canvas mode documents the physical side of your lab: create racks with configurable U-height, mount gear into slots, and patch ports across devices to track your cabling. Health checks run every 60 seconds using ping, HTTP, HTTPS, TCP, SSH, or Prometheus scrape endpoints, with WebSocket push delivering green, red, or pending status pulses directly to the canvas. Split your infrastructure across multiple canvases organized by site, rack, or purpose, and share a read-only Live View URL with anyone on your network. A built-in Model Context Protocol server lets AI assistants like Claude query and modify your topology through natural language. Deploy on a dedicated VPS on RepoCloud with guaranteed CPU, RAM, and SSD, full root SSH access, and a browser serial console. MIT licensed.
Grafana
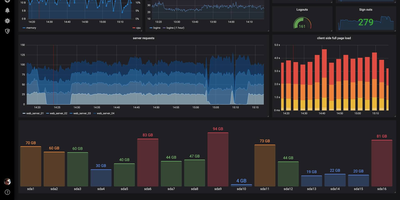
The de facto dashboard of observability: Grafana is the open-source frontend that turns the data stores you already run into interactive graphs. It does not store metrics itself; it connects to the data stores you already run and turns their contents into interactive dashboards. Supported sources number over 150 via plugins: Prometheus, Loki, Tempo, InfluxDB, Elasticsearch, MySQL, PostgreSQL, Microsoft SQL Server, AWS CloudWatch, Azure Monitor, Google Cloud Monitoring, and many more. Dashboards are built from a large library of panel types (time series, heatmaps, tables, gauges, logs) with template variables for reusable, parameterized views. Unified alerting evaluates rules against any connected data source, not just Prometheus, and routes notifications to Slack, PagerDuty, email, and other channels with grouping and silencing - unlike Prometheus Alertmanager, a single rule can combine a Loki log pattern, a PostgreSQL query result, and a CloudWatch metric. Dashboards serialize to JSON and data sources configure via provisioning files, so the entire observability setup can live in Git and deploy repeatably across environments. Explore mode adds ad-hoc querying outside dashboards, with split view for correlating a metric spike against the matching log lines, and access control spans organizations, teams, folder permissions, and OAuth, LDAP, and SAML integration. Written in Go and TypeScript, AGPL-licensed. Self-hosting gives you unlimited users, dashboards, and queries at flat hosting cost, without Grafana Cloud's usage-based pricing.
Redash
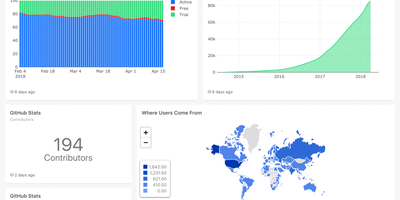
Used by millions of users at thousands of organizations worldwide and holding 29,000+ GitHub stars, Redash is the most established open-source SQL-first business intelligence tool — enabling anyone from analysts to executives to query databases, visualize results, and share dashboards without writing a single line of application code. The browser-based query editor supports SQL and NoSQL with schema browsing, auto-complete, query snippets, and parameterized queries that turn static reports into interactive data applications. Native connectors span 35+ data sources including PostgreSQL, MySQL, Amazon Redshift, Google BigQuery, Snowflake, ClickHouse, MongoDB, Elasticsearch, Databricks, Apache Presto, Microsoft SQL Server, and REST APIs — with an extensible data source API for custom integrations. Visualization types cover line, bar, area, pie, scatter, box plot, funnel, cohort, sankey, sunburst, choropleth map, and pivot tables, all draggable onto shared dashboards with cross-filtering parameters. Scheduled refreshes automatically update query results at configurable intervals, while threshold-based alerts notify teams via email, Slack, or webhook when metrics cross defined boundaries. SAML and Google OAuth SSO integration, role-based access control, API key management, and query-level permissions ensure enterprise-grade security for sensitive datasets. The self-hosted stack deploys via Docker Compose with PostgreSQL for metadata storage, Redis for job queuing, and Celery workers for background task execution. Running on a dedicated VPS on RepoCloud with guaranteed CPU, RAM, and SSD, full root SSH access, and a browser serial console. BSD 2-Clause licensed.
Bloomberg Terminal
With 1,450+ GitHub stars and a live demo on Vercel, this Bloomberg Terminal clone delivers a professional-grade financial dashboard without the $24,000 annual seat license. The Next.js 15 App Router with React 19 and TypeScript serves a single-page terminal interface optimized for constantly mutating financial data, with partial pre-rendering enabling sub-500ms initial loads even on data-heavy views. Upstash Redis caches AlphaVantage market data to minimize API calls while maintaining sub-second update latency through React Query polling with configurable refresh rates. OpenAI integration provides AI-powered market insights, sentiment analysis, and trend interpretation directly within the terminal interface. Multiple specialized views cover market data tables with bid/ask spreads, financial news aggregation with category filtering, market movers highlighting top gainers and losers, and volatility analysis with historical comparison charts. Jotai atoms manage local state for watchlists, layout preferences, and terminal sessions while React Query handles server-state synchronization with aggressive stale-while-revalidate caching. The shadcn/ui component library with Tailwind CSS delivers accessible, keyboard-navigable interface elements styled after Bloomberg's iconic dark terminal aesthetic. Security features include origin restriction, rate limiting via Redis, and Zod-based input validation on all API routes. Motion (formerly Framer Motion) animates transitions between views and data updates without layout shift. Running on a dedicated VPS on RepoCloud with guaranteed CPU, RAM, and SSD, full root SSH access, and a browser serial console. MIT licensed.
CoreObs
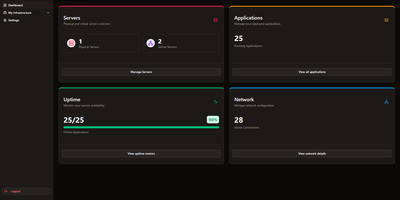
CoreObs delivers a unified self-hosted dashboard that replaces the typical combination of Uptime Kuma, Homer, and separate monitoring tools with a single interface for managing your entire server infrastructure. The Next.js frontend with shadcn components provides a modern dark-themed UI displaying server hardware metrics collected by a lightweight Go agent that leverages Glances for hardware abstraction — streaming real-time per-core CPU load, RAM utilization, NVIDIA GPU statistics, disk usage, system uptime, and load averages via WebSocket connections. The application registry tracks all self-hosted services with configurable uptime monitoring, availability history charts, and instant notifications through Discord, Telegram, Pushover, and email when services go down or recover. Quick-access links provide one-click navigation to each application's management panel directly from the dashboard. The network visualization module built on React Flow enables creating visual topology maps of your infrastructure with drag-and-drop nodes representing servers, switches, and services connected by labeled edges. Server data can be organized with tags, copied between entries, and monitored with configurable pagination and compact view modes. Deploy via Docker Compose with three containers — the Next.js web interface, the Go monitoring agent, and PostgreSQL 17 for persistent storage. Running on a dedicated VPS on RepoCloud with guaranteed CPU, RAM, and SSD, full root SSH access, and a browser serial console. MIT licensed.
DAC
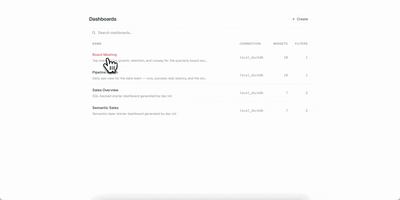
Your dashboards deserve version control, code review, and reproducible builds, just like the rest of your stack. DAC lets you define interactive data dashboards in YAML or TSX, validate them in CI, and serve them from a single Go binary that embeds a full React frontend. Choose from 21 chart types including line, bar, area, pie, scatter, bubble, funnel, sankey, heatmap, calendar, sparkline, waterfall, gauge, treemap, radar, and candlestick, plus metric cards, data tables, text blocks, and image widgets. The built-in semantic layer lets you define metrics and dimensions once in reusable model files, then reference them from any widget while DAC generates the SQL automatically. Connect to Postgres, MySQL, Snowflake, BigQuery, Redshift, Databricks, and DuckDB through standard Bruin connection configs. Interactive filters with date pickers, dropdowns, multiselects, and search inputs inject values via Jinja templating and re-execute only affected widgets. Live reload via Server-Sent Events refreshes connected browsers instantly when you save a file. Export dashboards as self-contained static HTML with baked-in query results for S3, GitHub Pages, or offline sharing, and render slide decks via the Google Slides export command. On RepoCloud, deploy DAC on a dedicated VPS with root SSH access and persistent storage for your dashboard definitions and database connections under the AGPL-3.0 license.