Akvorado
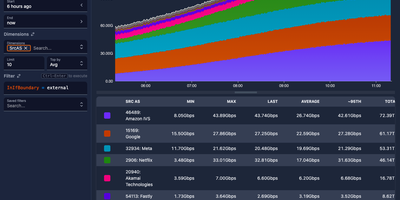
Point your routers at Akvorado and every NetFlow, IPFIX, and sFlow record crossing your network becomes a chart you can interrogate. The web console opens on a live summary of flows per second, exporter count, and traffic split by autonomous system, port, protocol, country, and address family. From there, the visualize page turns stored flows into stacked, line, grid, and heatmap time series, plus Sankey diagrams that show how traffic moves between networks, interfaces, and countries. Filters use a simple SQL-like syntax, so a question like which customers pulled traffic over a transit link last night becomes a query, not a support ticket to your future self. Because the outlet polls each exporter with SNMP or gNMI, flows arrive wearing real interface names, descriptions, and speeds instead of raw ifIndex numbers nobody can read. GeoIP lookups attach country and city to addresses, classification rules tag providers, peers, and connectivity types, and optional BMP sessions add AS paths and BGP communities to every flow. Retention is tiered: raw flows keep full detail for recent days while one-minute, five-minute, and hourly rollups stretch summaries across a year of history. A Grafana plugin is available too, so the same flow data can sit on the dashboards your team already watches. Running on a dedicated VPS on RepoCloud with guaranteed CPU, RAM, and SSD, full root SSH access, and a browser serial console. AGPL-3.0 licensed.
ntopng
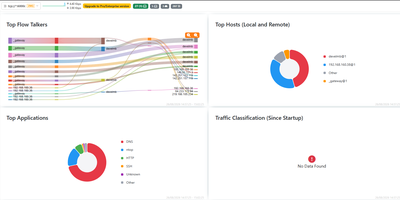
Network traffic stops being a mystery once ntopng names the hosts, applications, and protocols behind every flow, live in your browser. To find the host saturating an uplink, open the dashboard, which ranks top talkers, countries, autonomous systems, and protocols beside historical charts. To see what a suspicious host is contacting, open its page for traffic, ports, DNS queries, TLS details, and visited sites, plus a map of its conversations. Deep packet inspection recognizes applications such as Facebook, YouTube, and BitTorrent, so charts name the app behind the bytes instead of relying on port numbers alone. The console reads packets from a SPAN port or TAP and NetFlow, sFlow, or IPFIX records from routers and switches through nProbe, so it can cover a single switch or many remote sites. Behavioural checks raise alerts for flows, hosts, and interfaces and send them to email, Discord, Telegram, or webhooks. Active monitoring probes remote hosts over ICMP and HTTP/S, and network discovery lists the devices on your local network. A REST API and Lua scripting pull statistics into your own tools and add custom checks. Running on a dedicated VPS on RepoCloud with guaranteed CPU, RAM, and SSD, full root SSH access, and a browser serial console. GPL-3.0 licensed.
Nautobot
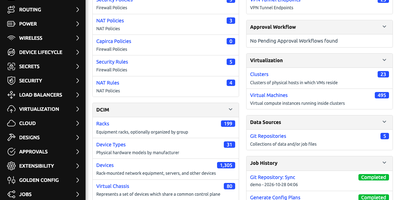
From the first rack to the last circuit, Nautobot is the open-source network source of truth that records what your network should look like and runs automation against it. Built-in models cover locations, racks, devices, interfaces, cables, VLANs, VRFs, IP prefixes, circuits, and contacts, so one searchable record replaces the spreadsheet and the wiki. Teams encode their own standards with custom fields, user-defined relationships, computed fields, and validation rules. Config contexts attach JSON or YAML data, such as syslog servers, to devices by location, role, platform, or tag. Jobs run your own automation code from the web UI, REST API, or command line, on a schedule, or through hooks when an object changes, with approvals and logs built in. Query the data over REST or GraphQL, and let the GraphiQL editor autocomplete a device and interface query you can save inside Nautobot. When an object is created, updated, or deleted, webhooks notify outside systems, with Jinja2-templated bodies and HMAC SHA-512 signatures. Git repositories can carry export templates, Jobs, and config contexts too, so YAML data and Jinja2 templates get pull request review before Nautobot syncs them. Open-source Apps add Golden Configuration for config backup, compliance, and remediation, Device Lifecycle for hardware tracking, SSoT for syncing other systems, and ChatOps. Object permissions and change logging keep a shared instance auditable. Running on a dedicated VPS on RepoCloud with guaranteed CPU, RAM, and SSD, full root SSH access, and a browser serial console. Apache-2.0 licensed.
Icinga 2
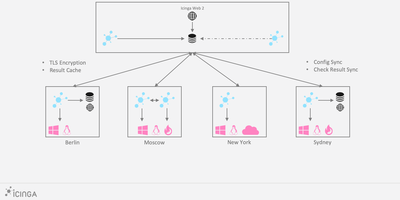
Servers, services, and network gear report their health to Icinga 2, the open-source monitoring core that runs checks, evaluates thresholds, and decides who gets woken up. A distributed hierarchy of master, satellite, and agent zones scales from a single box to global estates: satellites execute checks in remote regions and keep working when the master is unreachable, while agents run local checks under TLS-secured, certificate-based trust. The object-based configuration language defines hosts, services, dependencies, and notification rules as code, with apply rules generating checks across whole groups automatically. Performance data streams into Graphite, InfluxDB, or Elasticsearch writers, and Icinga DB carries runtime state and history into Redis and SQL for the web frontends. The REST API drives acknowledgements, downtimes, and check scheduling from scripts and chat tools, with fine-grained permissions down to diagnostic information. The 2.16 line hardens API security, streams richer runtime updates to Icinga DB for the new Icinga Notifications 1.0 incident workflows, and lets operators set exact acknowledgement times through the API. Running on a dedicated VPS on RepoCloud with guaranteed CPU, RAM, and SSD, full root SSH access, and a browser serial console. GPL-3.0-or-later licensed.
iTop
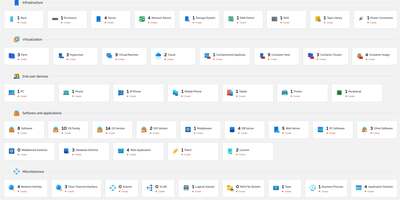
Keep every ticket tied to the servers, applications, and contracts it affects with iTop, an IT service management platform that joins a configuration management database (CMDB) to a helpdesk. Agents work user requests, incidents, problems, known errors, and changes through ITIL-style life cycles, and SLA targets for time to own and time to resolve move a ticket to an escalated status when a deadline passes. The CMDB models infrastructure, virtualization, end-user devices, software, and business applications, and its impact analysis graph shows what a failing server would take down. A service catalog of services and subcategories, backed by customer and provider contracts, feeds a user portal where employees and customers submit requests from a mosaic, tree, or list, follow progress, add comments and attachments, and reopen resolved tickets. Administrators bulk-load inventory from CSV, run consistency audits to catch data-quality problems, synchronize records from external sources, and connect other tools through REST web services. Sign-in works with local accounts, LDAP, or CAS, with optional two-factor authentication through authenticator apps, email codes, or recovery codes, and the console offers dark, high-contrast, and color-blind-friendly themes. Running on a dedicated VPS on RepoCloud with guaranteed CPU, RAM, and SSD, full root SSH access, and a browser serial console. AGPL-3.0 licensed.
Networking Toolbox
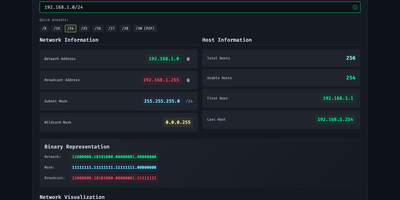
Subnet math, DNS lookups, DHCP options, and certificate checks share one browser tab in Networking Toolbox, a free toolkit for sysadmins and network engineers. Need to carve a /24 into departments? The VLSM planner fits named subnet requirements into a parent block, reports each subnet's efficiency and the leftover space, and exports the plan as CSV or JSON. Merging address lists? CIDR utilities summarize, split, compare, and deaggregate prefixes, with set operations for difference, overlap, and containment. Writing configs? Generators build DHCPv4 and DHCPv6 options, PXE profiles, Kea or ISC snippets, and SPF, DKIM, DMARC, CAA, TLSA, and SRV records, and DNSSEC helpers calculate key tags and DS records. Something broken? Diagnostics query DNS through Cloudflare, Google, Quad9, OpenDNS, or a resolver of your choice, read TLS certificate chains, grade HTTP security headers, trace redirects, check TCP ports, look up BGP routes and RDAP records, and test mail servers. Need a refresher? Reference guides explain private ranges, CGNAT, IPv6 address types, and common ports. A keyboard search palette puts any tool a few keystrokes away, and bookmarked tools stay available offline. Eighteen themes, four languages, custom branding, and accessibility switches make it feel like your own, and a keyless JSON API serves the subnet, CIDR, IP, and DNS utilities to scripts. Running on a dedicated VPS on RepoCloud with guaranteed CPU, RAM, and SSD, full root SSH access, and a browser serial console. MIT licensed.