Checkcle
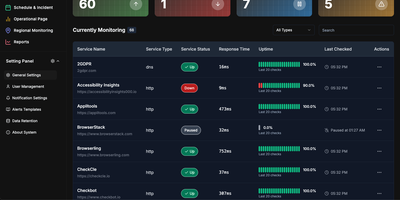
CheckCle provides a complete uptime monitoring and infrastructure observability platform that deploys with a single Docker container and stores all data in embedded SQLite via PocketBase. The Go backend runs three microservices — a service operation engine handling HTTP, HTTPS, DNS, Ping, and TCP checks at configurable intervals, a distributed regional check agent for multi-location network testing, and a server monitoring agent collecting CPU, RAM, disk usage, and network metrics via gRPC. The React frontend built with Vite, TypeScript, Tailwind CSS, and shadcn-ui subscribes to PocketBase WebSocket endpoints for real-time dashboard updates without polling. SSL and domain monitoring tracks certificate issuers, expiration dates, days remaining, and validation status. The incident management system records UP, DOWN, WARNING, and PAUSE states with full history, while scheduled maintenance windows prevent false alerts during planned downtime. Public status pages provide external stakeholders with live service health information. Health heatmaps visualize uptime performance and outage patterns over time. Notification channels include email, Telegram, Discord, and Slack, with multiple alert targets per monitored service. The one-click agent installation script supports Debian, Ubuntu, CentOS, Red Hat, Alpine, and Windows in beta. Docker deployment runs on port 8090 with a single persistent volume at /mnt/pb_data, requiring minimum 1 vCPU and 500MB RAM. On RepoCloud, deploy CheckCle on a dedicated VPS with root SSH access, persistent storage for your monitoring database, and complete control over agent endpoints and notification configurations, all under the MIT license.
UptimeKuma
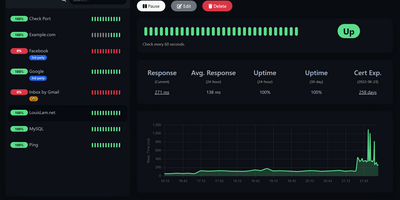
Sixty-thousand-plus GitHub stars make Uptime Kuma the most popular self-hosted monitoring tool - MIT-licensed, Node.js, and the standard replacement for UptimeRobot, Pingdom, and Freshping. It watches a dozen monitor types: HTTP(S) endpoints with keyword and JSON-query content validation, TCP ports, ICMP ping, DNS records, WebSockets, Docker containers via the socket, Steam game servers, MQTT brokers, gRPC services, and push-based heartbeats for cron jobs and internal workers. Checks run at intervals as tight as 20 seconds - versus UptimeRobot's 5-minute free tier - with unlimited monitors and unlimited data retention. When something fails, alerts fan out through 90+ notification channels: Slack, Discord, Telegram, email with LiquidJS templating, PagerDuty, OpsGenie, ntfy, Gotify, Matrix, and dozens more via native providers plus the Apprise library. Unlimited public or password-protected status pages - mappable to specific domains and organized into monitor groups - communicate health to customers, with maintenance windows that suppress alerts during planned work. The reactive dashboard graphs response times, tracks SSL certificate expiry with advance warnings, supports proxies and 2FA, and ships in dozens of languages. One Docker container with a SQLite volume covers an entire infrastructure.
Kener
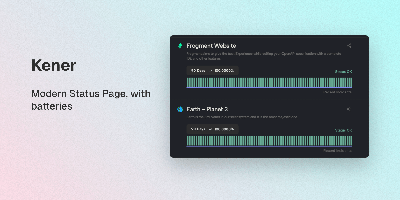
A polished public status page without Statuspage prices or a heavyweight observability suite: Kener is a status and uptime monitoring system built with SvelteKit and Node.js. It runs 11 monitor types - API, Ping, TCP, DNS, SSL certificate, SQL query, Heartbeat, gRPC, and GameDig game-server checks among them - each with configurable intervals and thresholds. Incident management covers the full lifecycle: structured timelines from investigation through resolution, acknowledgements, and subscriber-visible updates, plus maintenance windows with RRULE-based recurring schedules and automatic status transitions. Notifications reach email, Slack, Discord, and custom webhooks through trigger-based workflows with template-driven messaging. One instance can serve multiple branded status pages - per product, team, or region - with custom logos, colors, and CSS, localization into 21 languages, timezone-aware displays, and server-rendered pages that stay fast and SEO-friendly. Operations tooling includes role-based access for teams, API key management, a secrets vault, analytics integrations (Google Analytics, Plausible, Umami, and others), and a REST API with 17+ endpoints for automating incidents and monitors from CI/CD. MIT-licensed; Docker deployment with Redis, SQLite by default, PostgreSQL or MySQL for production.
Nimbus
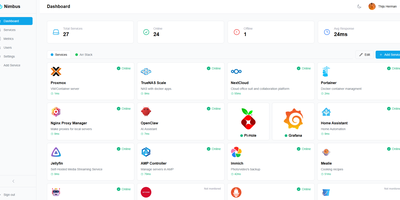
Nimbus is a self-hosted homelab dashboard that turns your scattered pile of services into a polished, organized command center with real-time health monitoring for every endpoint you care about. The dashboard displays live status cards for each registered service, tracking response times down to the millisecond and graphing uptime history so you can spot degradation before it becomes an outage. Health checks run on configurable intervals with smart self-signed certificate handling, meaning your internal services with self-issued TLS do not trigger false alarms. Multi-user support comes standard: local accounts authenticate via JWT, while OAuth2 integration with Google, GitHub, and Discord lets team members sign in with existing credentials. Role-based access control and a built-in admin panel give you granular authority over who sees what. Each user personalizes their view with custom backgrounds, light or dark mode, accent color themes, and drag-and-drop service tile arrangement. Services group into named categories and cards resize to fit your preferred layout, with both grid and list view modes available. Prometheus metrics export feeds your existing Grafana stack, and webhook notifications alert you instantly when a service goes offline. Custom service icons upload directly or auto-fetch from the Dashboard Icons collection. Zero-config Docker deployment gets you running in under 30 seconds with a single docker-compose command. Running on a dedicated VPS on RepoCloud with guaranteed CPU, RAM, and SSD, full root SSH access, and a browser serial console. AGPL-3.0 licensed.