SonarQube Community
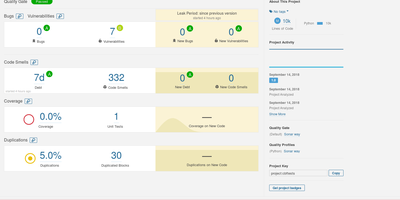
Trusted by over seven million developers worldwide with 310+ contributors and more than 10,600 GitHub stars since 2011, SonarQube has become the industry standard for automated code review and continuous code quality inspection. The platform performs deep static analysis across Java, JavaScript, TypeScript, Python, C#, C++, PHP, Kotlin, Go, Ruby, Swift, and 30+ additional languages, detecting bugs that cause runtime failures, security vulnerabilities exploitable by attackers, security hotspots requiring manual review, code smells degrading maintainability, and code duplications increasing technical debt. Quality Gates define pass-fail thresholds on metrics like coverage, duplications, reliability rating, and security rating, failing CI/CD pipelines when new code introduces issues below organizational standards. Pull request analysis decorates GitHub, GitLab, Bitbucket, and Azure DevOps merge requests with inline issue annotations and overall quality summaries before merging. Built-in quality profiles provide curated rule sets per language following the Sonar Way methodology, with dedicated profiles for AI-generated code that target patterns commonly introduced by agentic coding workflows. Infrastructure-as-Code analysis covers Terraform, Kubernetes, Docker, Ansible, CloudFormation, and Helm charts with supply-chain security rules for CI/CD pipelines. The companion IDE plugin delivers real-time analysis with quick-fix guidance directly in VS Code, IntelliJ, and Eclipse. Running on a dedicated VPS on RepoCloud with guaranteed CPU, RAM, and SSD, full root SSH access, and a browser serial console. LGPL-3.0 licensed.
Pinpoint
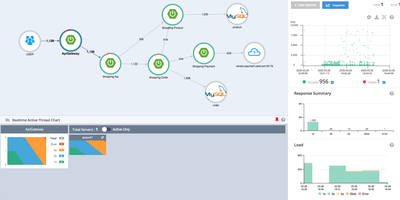
When checkout slows to a crawl somewhere across forty services, Pinpoint draws you the map of what is actually talking to what and where the time went. The ServerMap renders your whole topology live: services, databases, message queues, and external APIs as nodes whose edges carry transaction counts and error rates, so the unhealthy dependency announces itself visually. Click a node and the scatter chart plots every request against its response time; drag across the suspicious cluster and the CallStack opens those exact transactions at code level, method by method, SQL statement by SQL statement, until the bottleneck has nowhere to hide. The Inspector watches each application's CPU, memory, garbage collection, TPS, and JVM arguments, while realtime active-thread charts show stuck work as it happens. Agents attach to Java, PHP, and Python applications without changing a line of code, and applications already instrumented with OpenTelemetry send their traces straight in over OTLP. Group applications into services so each team sees its own Service Map, then arm alarm templates for slow counts, error rates, and thread saturation before users notice. Error Analysis gathers exceptions and error logs grouped by route, and URI metrics rank your hottest endpoints by cost. Running on a dedicated VPS on RepoCloud with guaranteed CPU, RAM, and SSD, full root SSH access, and a browser serial console. Apache-2.0 licensed.
Dokku
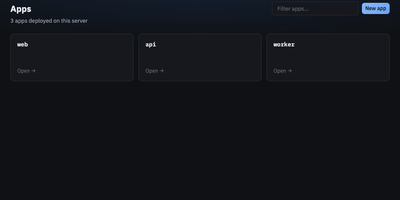
With over 32,000 GitHub stars and a decade of production use since 2013, Dokku is the original self-hosted Heroku alternative — a Docker-powered PaaS that turns any single Ubuntu server into a full application platform with a simple git push. Deploy applications written in Node.js, Python, Ruby, Go, Java, PHP, Scala, and Clojure using Heroku-compatible buildpacks, Cloud Native Buildpacks via pack-cli, standard Dockerfiles, or pre-built Docker images, with automatic language and framework detection handling the rest. Every deployment runs through zero-downtime checks that health-test new containers before routing traffic via the built-in Nginx reverse proxy, which handles virtual host configuration, WebSocket proxying, and HTTP/2 support automatically. The official plugin ecosystem provides managed datastores including PostgreSQL, MySQL, MariaDB, MongoDB, Redis, RabbitMQ, and Elasticsearch, each provisioned with a single CLI command and linked to apps via environment variables. Automated TLS certificates arrive through the Let's Encrypt plugin with auto-renewal, while persistent storage volumes, cron job scheduling, user ACL management, and process scaling round out the platform capabilities. The entire system is CLI-driven — no web dashboard — keeping resource overhead minimal enough to run multiple applications on a $5/month VPS. Dokku also supports Lambda function builds, custom builder plugins, and app.json-based healthcheck configuration for advanced deployment workflows. Running on a dedicated VPS on RepoCloud with guaranteed CPU, RAM, and SSD, full root SSH access, and a browser serial console. MIT licensed.
Compose Craft
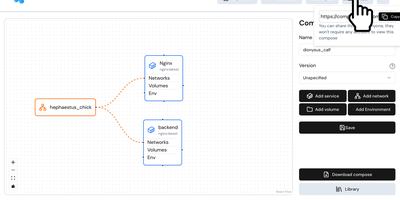
Compose Craft is an open-source visual diagramming and management platform that transforms raw Docker Compose configuration files into an interactive canvas of interconnected service nodes. Developers can drag and drop container services to map complex microservice architectures, automatically wiring port mappings, internal bridge networks, volume mounts, and dependency relationships. The real-time synchronization engine reflects every node repositioning, environment variable adjustment, and resource constraint directly into standard docker-compose syntax alongside a live editable code preview pane. Teams can import existing configuration files to diagnose routing conflicts, auto-format tangled service trees, and generate clean architectural documentation for operational handoffs. Engineers can generate shareable read-only public links to demonstrate infrastructure topologies to teammates and external reviewers without forcing them to register accounts. The built-in playground lets administrators experiment with container restart policies, healthcheck definitions, build contexts, and secret keys before deploying to production hosts. Running on a dedicated VPS on RepoCloud with guaranteed CPU, RAM, and SSD, full root SSH access, and a browser serial console. MIT licensed.
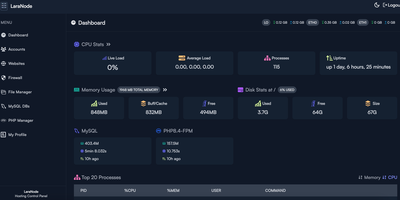
Laranode
Built for self-hosted server deployments, Laranode transforms bare Linux installations into multi-tenant web hosting platforms with automated Let's Encrypt certificates and isolated PHP environments without recurring license fees. System administrators can provision isolated user accounts with dedicated document roots, configure custom domains, and deploy SSL certificates across all active websites in seconds. The integrated PHP manager enables per-site runtime isolation from legacy PHP 7.4 through cutting-edge PHP 8.5 releases, preventing version conflicts between separate production web applications. Operators can create MySQL databases, manage database users, inspect active connections, and adjust UFW firewall port access directly from the visual dashboard. An integrated browser-based file manager lets developers browse directories, edit configuration files, extract compressed archives, and modify file permissions without external FTP tools. Real-time telemetry monitors CPU utilization, memory consumption, disk capacity, and network traffic over customizable historical timeframes to catch bottlenecks early. Automated backup routines archive full accounts, individual websites, or specific databases to local storage, remote SFTP servers, or S3-compatible cloud object stores with point-in-time recovery verification. Running on a dedicated VPS on RepoCloud with guaranteed CPU, RAM, and SSD, full root SSH access, and a browser serial console. MIT licensed.
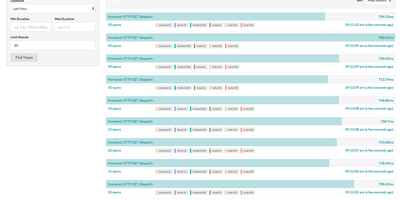
Jaeger
Created by Uber Technologies and graduated as the seventh CNCF top-level project in October 2019 with over 23,000 GitHub stars, Jaeger has become one of the most widely deployed open-source distributed tracing platforms, processing billions of spans per day in production environments at organizations including Uber, Red Hat, and Shopify. Version 2 rebuilt the platform on the OpenTelemetry Collector framework, inheriting its extensible pipeline architecture while implementing Jaeger-specific features as extensions and components, enabling seamless integration with the OpenTelemetry ecosystem through native OTLP protocol support. The platform stores traces in Cassandra 4.0+, Elasticsearch 7.x/8.x, OpenSearch 1.0+, ClickHouse, or the embedded Badger database for development setups. Three sampling strategies control trace volume: head-based sampling with constant, probabilistic, and rate-limiting modes, tail-based sampling using the OpenTelemetry Collector processor that evaluates complete traces before storage decisions, and adaptive sampling that dynamically adjusts probabilities based on observed traffic patterns. Service Performance Monitoring computes RED metrics directly from spans, displaying request rates, error rates, and latency percentiles in the Monitor tab with drill-down from aggregate service views to individual traces. The web UI provides trace search with multi-field filtering, trace detail views with span timeline visualization, trace comparison across services, and dependency graphs mapping service relationships from actual traffic. Deployment options range from a single all-in-one binary for development to distributed collector-ingester-query configurations with Kafka intermediate buffering for production scale. Running on a dedicated VPS on RepoCloud with guaranteed CPU, RAM, and SSD, full root SSH access, and a browser serial console. Apache 2.0 licensed.
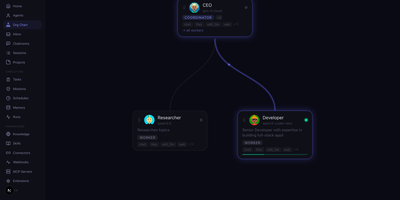
SwarmClaw
Running a single AI agent is straightforward; running a team of specialized agents that delegate tasks, share memory, and coordinate through structured workflows requires an orchestration layer, and that is exactly what SwarmClaw provides. Define a hierarchy of agents in an org chart where a Coordinator (your CEO agent) delegates research tasks to a Researcher, coding tasks to a Developer, and design tasks to a Designer, each configured with its own LLM provider, tool permissions, and skill set. The Task Board presents a Kanban view of all work items across Backlog, Queued, Running, and Completed columns, with each task card showing its assigned agent, tags, due dates, and approval gates that pause execution until a human reviews and approves. Agents execute work using built-in tools for file operations, shell commands, browser automation, and persistent memory, plus any MCP server you connect via stdio, SSE, or streamable HTTP transport. Durable structured sessions support branching logic, repeat loops, parallel branches with explicit joins, and restart-safe run state that survives crashes without losing progress. Over 23 LLM providers ship built-in: Claude Code CLI, OpenAI, Anthropic, Google Gemini, DeepSeek, Groq, Mistral, xAI Grok, Fireworks, Ollama, and more. Connectors push messages to Discord, Slack, and Telegram, while cron schedules and webhooks trigger agent runs automatically. Running on a dedicated VPS on RepoCloud with guaranteed CPU, RAM, and SSD, full root SSH access, and a browser serial console. MIT licensed.
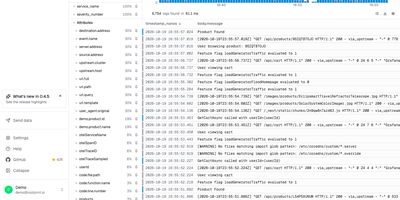
Rootprint
A year of searchable logs and traces no longer needs a metered logging service, because Rootprint keeps the whole index in a storage bucket you already own. A search matches any word on any line, since every log is indexed in full and no service name, stream, or label is needed first. A frequency histogram, one-click field filters, and saved views narrow the results, a fold mode collapses repeated lines, and exports arrive as NDJSON, CSV, or plain text, or as a share link. Open a trace from the log that emitted it, or paste a trace ID, and a waterfall shows per-span timing, attributes, events, and database calls grouped by query, with each span linking back to its logs. The trace explorer charts span volume, error rate, and p50, p95, and p99 latency, ranks the busiest operations, and filters spans by service, duration, and status. Every service gets its own page with request rate, error rate, operations, dependencies, and errors. Data arrives over OpenTelemetry from the Collector, Vector, or Fluent Bit, through a plain HTTP gateway, or by pulling from Kafka, Kinesis, or SQS, with guided setup for nine integrations. Indexes can live in S3, Google Cloud Storage, R2, MinIO, or Azure Blob. Teammates sign in with Google, GitHub, or any OpenID Connect provider, and scoped API keys serve scripts. Running on a dedicated VPS on RepoCloud with guaranteed CPU, RAM, and SSD, full root SSH access, and a browser serial console. Apache-2.0 licensed.
GoAccess
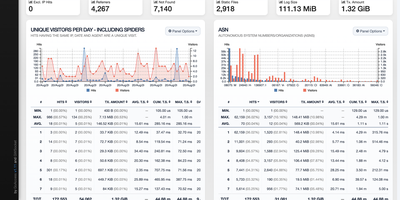
GoAccess processes millions of web log entries in seconds and renders the results as interactive dashboards that update every 200 milliseconds in the terminal or every second via WebSocket-connected HTML reports. Written entirely in C with only ncurses as a dependency, it achieves exceptional performance even on resource-constrained servers, reducing memory usage by approximately 20% and parsing time by 35% in recent releases through optimized in-memory hash tables with on-disk persistence support. The analyzer parses virtually every web log format out of the box (Apache Combined and Common, Nginx, Amazon CloudFront, Amazon S3, AWS Elastic Load Balancing, Google Cloud Storage, Squid, W3C IIS, Caddy JSON, and Traefik) while supporting fully custom log format strings for non-standard configurations. The self-contained HTML dashboard displays 15+ interactive panels covering unique visitors, requested files, static files, 404 errors, referring sites, search keyphrases, geographic location with city-level GeoIP resolution, operating systems, browsers, HTTP status codes, time distribution, and virtual host metrics. WebSocket authentication via JWT provides secure remote access, and incremental log processing ensures data continuity across daemon restarts. Docker deployment requires a single command with volume-mapped access logs. Over 20,800 stars with active development since 2010. Running on a dedicated VPS on RepoCloud with guaranteed CPU, RAM, and SSD, full root SSH access, and a browser serial console. MIT licensed.

pgweb
Inspect a PostgreSQL database right now, without installing pgAdmin or exposing Postgres to the internet - pgweb answers that recurring need. It's a Go application from Dan Sosedoff, a decade in development, shipped as a single statically-linked binary with zero dependencies - the Docker image is essentially just the executable - that puts a clean browser UI in front of any PostgreSQL 9.1+ server. Connect via URL string or host/port credentials, and browse tables, views, and sequences from the sidebar; selecting a table shows its rows immediately alongside tabs for structure, indexes, and constraints. The Query tab executes arbitrary SQL with query history, and the Explain Query button renders the query plan - estimated cost, row counts, execution strategy - which makes pgweb a quick performance-triage tool, not just a browser. Results and entire tables export to CSV, JSON, or XML in a click. Connectivity is more flexible than its size suggests: native SSH tunneling (password or key) reaches databases behind firewalls, server bookmarks make switching instances instant, and an optional multi-session mode handles several databases concurrently. For a RepoCloud stack full of Postgres-backed apps, one pgweb instance is the universal inspection hatch. MIT-licensed, actively maintained.
Kubewall
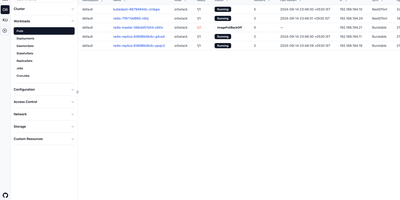
One binary is all that stands between you and every Kubernetes cluster you own: Kubewall opens a realtime web dashboard over all of them, with no agents to install and nothing phoning home. Switch between clusters from the sidebar and browse workloads, networking, storage, configuration, and access control in tables that update live as pods start, fail, and reschedule. Open any resource to inspect its overview, edit its manifest in the built-in YAML editor with validation, watch its events, or stream logs aggregated across pods and containers with search and tail controls. A command palette jumps straight to any resource type, while faceted filters and global search cut through thousands of objects by name, namespace, label, or image. Scale deployments, restart pods, trigger rollout restarts, and apply manifests with a click, or forward a cluster service to your local machine without memorising kubectl incantations. An integrated AI assistant, connected to OpenAI, Claude, Gemini, DeepSeek, OpenRouter, Ollama, or a local model, helps troubleshoot failures and review configurations right beside the resource it concerns. Running on a dedicated VPS on RepoCloud with guaranteed CPU, RAM, and SSD, full root SSH access, and a browser serial console. Apache-2.0 licensed.
Regen
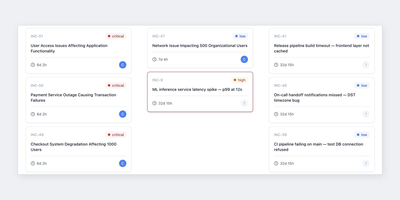
When a production alert fires at 3 a.m., Regen is the self-hosted on-call and incident management platform that makes sure a human answers it, keeping alerts, incidents, schedules, and escalations on one shared timeline instead of split across three tools. Alerts stream in from Prometheus Alertmanager, Grafana, AWS CloudWatch, or any webhook, and deduplication collapses repeat firings before Regen opens an incident automatically; responders can also declare one by hand and let AI draft the title and summary. Layered on-call rotations absorb overrides, holidays, and leave, while multi-step escalation policies with timeouts keep paging the next person until somebody acknowledges, so a critical page never dies in one inbox. The incident timeline syncs to Slack and Microsoft Teams, where bot commands acknowledge, escalate, and post updates without leaving chat, and Telegram notifications cover teams that live there instead. One-click summaries and handoff digests brief the incoming shift, editable postmortem drafts are assembled from the timeline using your own templates, and similar past incidents resurface with what worked last time. AI is bring-your-own-key through OpenAI, Anthropic, or a local Ollama model, and the platform loses nothing core if you never enable it. Schedules and escalation policies import in one click from PagerDuty, Grafana OnCall, or Opsgenie, SAML single sign-on through Okta, Azure AD, or Google Workspace is free, and nothing caps your incidents, schedules, or postmortems. Running on a dedicated VPS on RepoCloud with guaranteed CPU, RAM, and SSD, full root SSH access, and a browser serial console. AGPL-3.0 licensed.
Nexus Repository
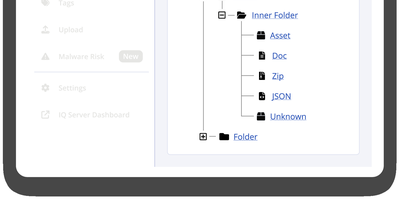
Trusted by millions of developers and integrated into CI/CD pipelines at organizations worldwide, Sonatype Nexus Repository is the industry-standard binary artifact repository manager that stores, organizes, and distributes software components across every major package ecosystem. Community Edition supports over 20 formats including Maven for Java builds, npm for JavaScript packages, Docker for container images, PyPI for Python libraries, NuGet for .NET assemblies, Helm for Kubernetes charts, Go modules, RubyGems, Cargo for Rust crates, Conda for data science environments, APT for Debian packages, Yum for RPM distributions, and Hugging Face for AI/ML models. Three repository types serve different needs: hosted repositories store internally-produced artifacts, proxy repositories cache remote registries like Maven Central, npmjs.org, and Docker Hub reducing bandwidth and improving build reliability, and group repositories aggregate multiple hosted and proxy repositories behind a single URL endpoint. The web UI provides component browsing and search, repository configuration, blob store management with configurable cleanup policies, and direct artifact upload via drag-and-drop. Role-based access control enforces fine-grained permissions per repository with configurable security realms, while the comprehensive REST API enables automated repository provisioning, component management, and integration with Jenkins, GitHub Actions, GitLab CI, and Azure DevOps. External PostgreSQL database support enables Kubernetes deployments with improved backup, restore, and horizontal scaling capabilities. Running on a dedicated VPS on RepoCloud with guaranteed CPU, RAM, and SSD, full root SSH access, and a browser serial console. Eclipse Public License 1.0 licensed.
dyrector.io
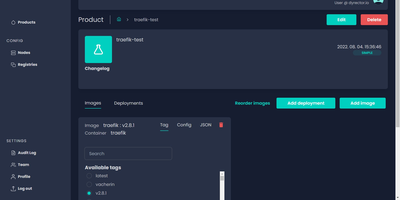
dyrector.io gives teams a visual web interface for deploying and managing containerized applications across Docker, Kubernetes, and Podman environments, replacing repetitive CLI commands and YAML editing with point-and-click configuration. Lightweight Go agents installed on target infrastructure communicate with the central TypeScript platform, enabling deployments to AWS, GCP, Azure, and on-premises servers without requiring infrastructure migration. Unified configuration screens eliminate redundant YAML editing across environments with support for all three container runtimes. Version management lets teams configure OCI-compatible container images once and deploy them as versioned releases with auto-generated changelogs and release notes. Multi-instance deployment enables simultaneous rollouts to multiple nodes with environment-specific configuration overrides, secret management, and instant test environment provisioning from any branch. The fine-grained RBAC system controls user access at project and environment levels, while audit logging tracks every deployment action. Registry integrations support Docker Hub, GitLab, GitHub, Google, and Azure container registries for image sourcing. ChatOps notifications integrate with Slack, Discord, and Microsoft Teams for deployment status alerts. Scheduled releases and workflow support enable automated deployment pipelines triggered by CI events via the REST API with JWT authentication. Running on a dedicated VPS on RepoCloud with guaranteed CPU, RAM, and SSD, full root SSH access, and a browser serial console. Apache 2.0 licensed.
Flowctl
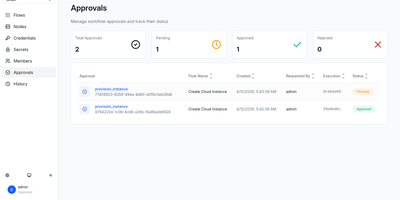
Flowctl turns repetitive ops work, such as granting SSH access, restarting a service, or provisioning a server, into self-service forms that anyone on the team can run without holding credentials. Each workflow is a YAML or HUML file with typed inputs, validation rules, and a list of actions. Actions run in order or as a dependency graph, so independent branches execute in parallel. Every action runs in a Docker container, as a shell script, or as another flow, and scripts can target remote servers over SSH, several at once. Sensitive steps pause until a reviewer approves or rejects them. Output from one action feeds the next, files pass along as artifacts, and failed actions can be retried. Cron schedules with time zones and labels run flows unattended, while logs stream live in the browser. Email, Slack, Mattermost, and webhook notifications announce success, failure, waiting, or cancellation. Teams get isolated namespaces with user, operator, reviewer, and admin roles, OIDC single sign-on, and encrypted storage for SSH keys and secrets. A built-in flow editor means nobody has to hand-write files, and custom executors can be added as Go plugins. Running on a dedicated VPS on RepoCloud with guaranteed CPU, RAM, and SSD, full root SSH access, and a browser serial console. Apache-2.0 licensed.
Yep Anywhere
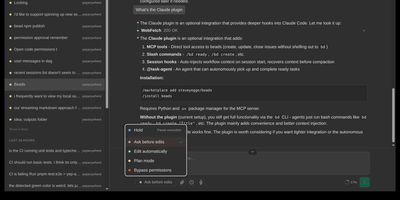
Designed for developers on the go, Yep Anywhere turns any smartphone browser into a full-featured control center for supervising, steering, and reviewing autonomous AI coding agents. Operators can monitor live execution across multiple active projects simultaneously without sitting at a desktop terminal. Real-time reasoning feeds. Instant push alerts for permission prompts. One-tap tool approvals. Developers can unblock pending tasks mid-turn, redirect active workflows, or queue sequential follow-up prompts for automatic delivery at the next safe milestone. An integrated source control viewer displays syntax-highlighted working-tree and commit diffs, allowing reviewers to attach line-level comment bundles directly back into the agent context. Mobile voice transcription lets users dictate instructions straight into running sessions, while photo library integration makes uploading bug screenshots effortless. All agent credentials, CLI configurations, and repository data remain private on the host server without requiring third-party cloud database accounts or proprietary device pairing. Running on a dedicated VPS on RepoCloud with guaranteed CPU, RAM, and SSD, full root SSH access, and a browser serial console. MIT licensed.
Tianji
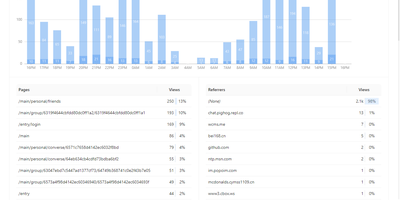
Website analytics, uptime monitoring, and server status - three tools most teams run separately - combined in Tianji, an open-source observability platform. The analytics layer tracks page views, unique visitors, referrers, and UTM parameters with a lightweight cookie-less script, which keeps collection GDPR and CCPA friendly. The uptime monitor checks availability and latency on configurable intervals, accepts passively reported results, and publishes public status pages for incident communication. Server status agents report CPU, memory, disk, and network metrics with threshold-based alerts, and notifications route through webhooks, Slack, Telegram, and other channels with noise control. It also includes anonymous telemetry for tracking deployments of your own open-source projects, surveys, waitlists, team collaboration, and an OpenAPI interface for integrations and exports. The consolidation is the point: traffic analytics, uptime checks, and server metrics share one interface and one alerting layer, so diagnosing an incident does not mean hopping between Google Analytics, Uptime Kuma, and Prometheus - and the built-in public status pages replace a separate paid Statuspage-style subscription. Because collection uses no cookies with IP truncation and aggregation by default, basic traffic measurement requires no consent banner. Built in TypeScript under the Apache 2.0 license and inspired by Umami and Uptime Kuma, it is deliberately right-sized for independent developers and small SaaS teams whose monitoring needs are real but lightweight.
MirrorProxy
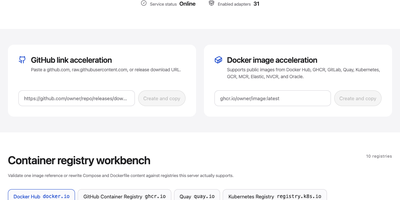
Stop hunting for a public mirror that still works this week: MirrorProxy puts every software source your builds depend on behind one domain you control, so GitHub releases, container images, npm and PyPI packages, and operating-system repositories all come from the same stable gateway. Point it at a source and it fetches and caches on demand, with no full mirror to store or sync, and when an upstream times out or starts rate-limiting, it fails over to the next endpoint and keeps your builds moving. Around thirty adapter types cover the everyday sprawl: Docker Hub and nine other registries, Cargo and Go modules, Maven and NuGet, Homebrew and WinGet, and more than thirty Linux and BSD distributions, plus custom static repositories you define yourself. Sharing the gateway is safe: invite users, set monthly quotas per person or team, restrict which sources each team may use, and gate access with rate limits and IP rules, while the console shows traffic trends, visitor regions, cache behavior, and the health of every source. Email and webhook alerts warn you before a quota runs out or an upstream outage drags on, and the cross-platform client switches a workstation's sources to your gateway and back. Running on a dedicated VPS on RepoCloud with guaranteed CPU, RAM, and SSD, full root SSH access, and a browser serial console. MIT licensed.