Tianji
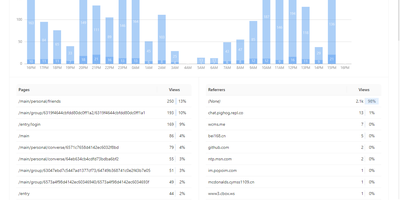
Website analytics, uptime monitoring, and server status - three tools most teams run separately - combined in Tianji, an open-source observability platform. The analytics layer tracks page views, unique visitors, referrers, and UTM parameters with a lightweight cookie-less script, which keeps collection GDPR and CCPA friendly. The uptime monitor checks availability and latency on configurable intervals, accepts passively reported results, and publishes public status pages for incident communication. Server status agents report CPU, memory, disk, and network metrics with threshold-based alerts, and notifications route through webhooks, Slack, Telegram, and other channels with noise control. It also includes anonymous telemetry for tracking deployments of your own open-source projects, surveys, waitlists, team collaboration, and an OpenAPI interface for integrations and exports. The consolidation is the point: traffic analytics, uptime checks, and server metrics share one interface and one alerting layer, so diagnosing an incident does not mean hopping between Google Analytics, Uptime Kuma, and Prometheus - and the built-in public status pages replace a separate paid Statuspage-style subscription. Because collection uses no cookies with IP truncation and aggregation by default, basic traffic measurement requires no consent banner. Built in TypeScript under the Apache 2.0 license and inspired by Umami and Uptime Kuma, it is deliberately right-sized for independent developers and small SaaS teams whose monitoring needs are real but lightweight.
OpenRun
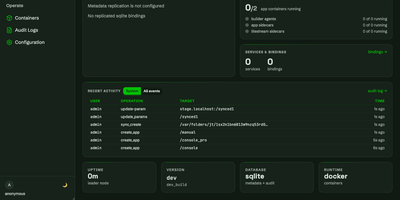
OpenRun replaces the patchwork of CI/CD pipelines, reverse proxies, and identity providers that teams typically assemble when deploying internal tools, offering declarative GitOps-based deployment of web applications to Docker, Podman, or Kubernetes from a single self-hosted Go binary. Point it at a Git repository and it builds containers from AppSpec templates, routes requests by domain or URL path, provisions TLS certificates automatically, and scales idle applications to zero when unused. Blue-green staged deployments promote new versions through development, staging, and production environments with atomic rollback across multiple apps simultaneously. Every deployed application inherits SSO authentication through OAuth, OpenID Connect, or SAML providers alongside role-based access control, all configured once at the platform level rather than per app. Service bindings provision isolated PostgreSQL, MySQL, SQLite, or Redis credentials for each application, while Litestream integration replicates SQLite databases to S3 for automatic disaster recovery. The management console provides a web interface for monitoring containers, reviewing audit logs, configuring syncs, and managing server operations. AppSpec templates handle Streamlit, Gradio, FastAPI, Flask, and FastHTML projects out of the box, deploying existing Python applications without requiring custom Dockerfiles. Running on a dedicated VPS on RepoCloud with guaranteed CPU, RAM, and SSD, full root SSH access, and a browser serial console. Apache-2.0 licensed.

RocketplaneIO
RocketplaneIO is a self-hosted AI SRE platform that gives Kubernetes clusters zero-instrumentation eBPF observability plus a copilot capable of safely diagnosing and fixing issues without your telemetry ever leaving your infrastructure. Point it at any cluster, and an eBPF DaemonSet starts capturing HTTP, gRPC, SQL, Redis, and Kafka spans across every service, including compiled binaries, with cross-service context propagation and no code changes required. The live service map draws itself from actual network traffic, matching technology logos from container images and coloring each node's health from RED metrics. Every log line sits two clicks from its parent distributed trace, and a PromQL query engine, embedded from the real Prometheus evaluator, runs over ClickHouse for long-term metric retention. The complete Kubernetes inventory (Services, Ingress, ConfigMaps, network policies, persistent volumes, CRDs) syncs continuously and is searchable alongside traces and logs. When the copilot identifies a problem, it picks from a catalog of roughly 30 risk-classified safe actions; each action verifies its preconditions, captures a before-state snapshot, executes, checks the result, and rolls back automatically on failure. Disruptive operations pause for explicit human approval before proceeding. An MCP endpoint exposes the identical guardrailed toolbox to external AI agents, so Claude Code or Cursor can operate the cluster through the same safety boundary the browser copilot uses. Complex remediations compose as searchable, forkable Starlark workflows that compile deterministically at save. Running on a dedicated VPS on RepoCloud with guaranteed CPU, RAM, and SSD, full root SSH access, and a browser serial console. Apache-2.0 licensed.
Moneat
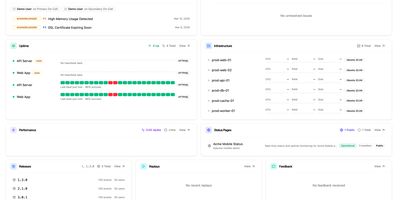
Moneat is the open-source observability platform that unifies error tracking, session replay, performance monitoring, logging, uptime checks, synthetics, product analytics, and AI observability into a single self-hosted application — replacing Sentry, Datadog, and Statuspage with one deployment. The Sentry SDK compatibility layer accepts data from @sentry/browser, @sentry/node, @sentry/react, @sentry/nextjs, sentry-sdk for Python, sentry-kotlin, sentry-java, sentry-android, sentry-cocoa, sentry-go, sentry-ruby, and Sentry.NET by updating one DSN endpoint. Datadog Agent compatibility redirects existing fleets by setting dd_url, and native OpenTelemetry OTLP ingestion accepts logs, traces, and metrics from any exporter or Collector. Error monitoring groups exceptions with smart deduplication, session replay records DOM-based user interactions linked to errors, distributed tracing visualizes transaction and span breakdowns with live service maps, and continuous profiling renders flamegraphs in pprof, JFR, and Sentry formats. Uptime monitoring runs HTTP, TCP, and ping checks with public status pages, while synthetics executes API tests, multi-step workflows, SSL checks, and DNS probes. Custom dashboards support drag-and-drop widgets with Grafana import, product analytics provides funnels and retention cohorts, release tracking surfaces crash-free rates with source map upload, and AI observability traces LLM calls end to end. Built on Kotlin and Java with ClickHouse for analytical storage, PostgreSQL for relational data, and Redis for caching, deployment uses Docker Compose with an interactive installer automating secrets and service orchestration. Running on a dedicated VPS on RepoCloud with guaranteed CPU, RAM, and SSD, full root SSH access, and a browser serial console. AGPL-3.0 licensed.
Percona PMM
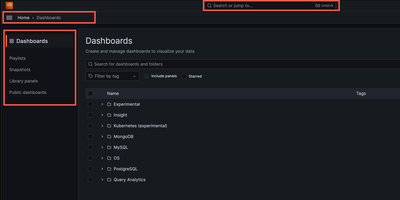
Backed by 1,080+ GitHub stars and maintained by Percona with the latest release v3.8.1 in June 2026, Percona Monitoring and Management delivers the open-source database observability platform that provides a single pane of glass across MySQL, PostgreSQL, MongoDB, Valkey, and Redis databases deployed on-premises, cloud, or hybrid environments. The Go-powered PMM Server collects metrics from lightweight PMM Client agents with minimal performance impact, storing time-series data in ClickHouse for fast querying across configurable retention periods. Query Analytics ranks every query by load across all database engines from one unified dashboard, drilling from fleet-level performance down to individual problematic queries with explain plans, per-query metrics, and anomaly detection. Real-time Query Analytics streams live MongoDB operations updated every 1-5 seconds for immediate troubleshooting of lock contention and long-running queries. Built-in Percona Advisors continuously scan connected databases for security gaps, misconfigurations, and performance problems, distilling decades of DBA expertise into automated actionable recommendations. Percona Alerting integrates with 15+ notification channels including Slack, PagerDuty, email, and webhooks to trigger on custom metric thresholds. Database-specific dashboards visualize InnoDB storage engine details, WiredTiger cache metrics, PostgreSQL tuple activity, replication lag, and cluster health with annotations for root-cause correlation. Deployment options include Docker single-container setup, Podman rootless execution, and Helm charts for Kubernetes with Ingress controller support and ConfigMap management. Running on a dedicated VPS on RepoCloud with guaranteed CPU, RAM, and SSD, full root SSH access, and a browser serial console. AGPL-3.0 licensed.
Tau
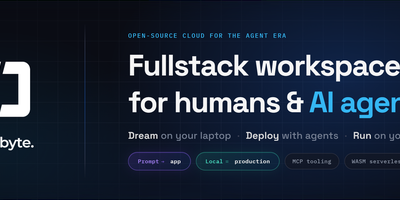
Tau delivers a complete self-hosted cloud platform where Git is the control plane and WebAssembly is the runtime. The Go binary deploys as interconnected nodes that form a P2P network using libp2p for automatic service discovery, eliminating Kubernetes entirely. Serverless functions compile to WebAssembly for secure multi-tenant execution with automatic horizontal scaling — write in Go, Rust, AssemblyScript, or C and deploy by pushing to Git. Branch-based environments map Git branches to isolated deployments, so staging and production run identical infrastructure from different refs. Static website hosting serves frontends with global distribution and automatic content-addressed deduplication via IPFS-derived storage. The built-in K/V database provides distributed storage with automatic replication across nodes, while object storage handles file management with content addressing. Pub/Sub messaging enables real-time communication between functions and external services including WebSocket support. Spore Drive automates multi-host deployment and rolling updates from a single command across bare metal or VMs running Ubuntu. The Dream CLI provides a complete local development environment that mirrors production exactly — same services, same routing, same deployment flow. Zero-configuration HTTPS provisions TLS certificates automatically for custom domains. The web console at console.taubyte.com provides visual project management, or use the tau CLI for Git-native workflows. Running on a dedicated VPS on RepoCloud with guaranteed CPU, RAM, and SSD, full root SSH access, and a browser serial console. BSD-3-Clause licensed.
Stormkit
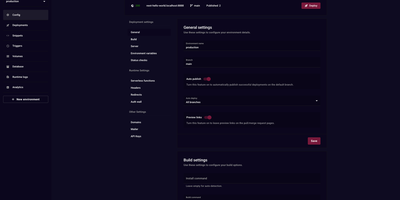
Stormkit delivers a self-hostable PaaS that eliminates vendor lock-in while providing Vercel-class deployment workflows. The Go backend handles build orchestration, hosting, and background job processing while the React frontend provides a complete management dashboard for applications, environments, and team collaboration. Git integration with GitHub, GitLab, and Bitbucket enables push-to-deploy workflows where every commit triggers automated builds with preview links posted directly to pull requests. Serverless functions use filesystem-based routing — each TypeScript or Node.js file in the API directory becomes an endpoint automatically, deploying to AWS Lambda with configurable timeouts. PostgreSQL database schemas ship with automatic migrations, isolated credentials per environment, and secure environment variable injection preventing credential leakage between staging and production. Custom domains provision TLS certificates automatically through Let's Encrypt with support for custom certificates and headers. The environment system creates isolated deployment contexts for production, staging, and development with independent variables, domain bindings, and auto-publish rules per branch. Privacy-respecting server-side analytics track visitors, referrers, and top paths without client cookies or third-party scripts. Role-based access control manages team permissions across applications. Docker Compose deployment provisions the full stack including the API server, hosting service, build runner, and worker server. Running on a dedicated VPS on RepoCloud with guaranteed CPU, RAM, and SSD, full root SSH access, and a browser serial console. AGPL-3.0 licensed.
Vigil
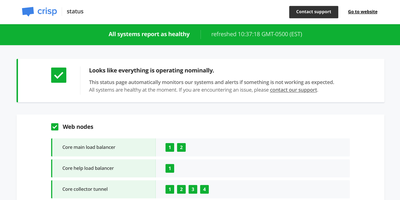
Vigil monitors your entire distributed infrastructure and generates a public status page from a single Rust binary small enough to run on a Raspberry Pi, consuming minimal CPU and memory while providing crash-free reliability. Four distinct monitoring modes cover every topology: poll probes check HTTP, TCP, SSH, and ICMP endpoints for reachability with configurable intervals and thresholds; push probes receive health reports from Vigil Reporter libraries embedded in your application code across Node.js, Python, Golang, Rust, TypeScript, Dart, and C#; local probes delegate monitoring to Vigil Local slave daemons running behind firewalls on separate LANs; and script probes execute custom shell commands for specialized health checks. Each monitored service transitions through healthy, sick, and dead states based on consecutive probe failures, with configurable thresholds controlling state transition sensitivity. When services change state, Vigil dispatches notifications through twelve alert channels including Slack, Email, Twilio SMS, Telegram, Pushover, Gotify, XMPP, Matrix, Zulip, Cisco Webex, and generic webhooks. The generated status page displays service groups organized by category with real-time replica status, system load metrics from reporter probes, and a maintenance announcement system for communicating planned downtime through the Manager HTTP API. Configuration uses a single TOML file defining all probes, services, and notification channels with no database dependency. Docker deployment pulls the official image with volume-mounted configuration. Running on a dedicated VPS on RepoCloud with guaranteed CPU, RAM, and SSD, full root SSH access, and a browser serial console. MPL-2.0 licensed.
NetsGo
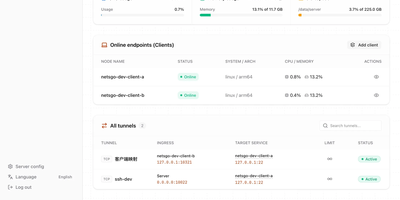
Created to eliminate the configuration fragmentation plaguing multi-device Homelab setups and small-team infrastructures, NetsGo merges what typically requires three separate tools — a tunnel daemon, a management panel, and a monitoring stack — into a single Go binary that starts with one command and listens on one port. The server exposes HTTP, TCP, and UDP tunnels, a built-in Web console for node management, a REST API for automation, and real-time traffic statistics with per-client bandwidth limiting, all sharing default port 9527 so firewalls and reverse proxies need only a single rule. Version 0.1.11 introduced Client-to-Client P2P tunnels via WebRTC DataChannel with three selectable transport strategies — Server relay, Prefer P2P with automatic fallback, and P2P only — reducing latency for direct connections while maintaining the centralized control plane. The management console displays every connected client's online status, authentication tokens, tunnel configuration, active transport mode, P2P candidate gathering progress, and cumulative byte-level traffic counters updated every second. Unlike frp or rathole which delegate management to external plugins or configuration files, NetsGo provides built-in client key generation, tunnel target migration between nodes, SOCKS5 proxying, IP-whitelist console access, and one-command server upgrades. Running on a dedicated VPS on RepoCloud with guaranteed CPU, RAM, and SSD, full root SSH access, and a browser serial console. Apache 2.0 licensed.
Unkey
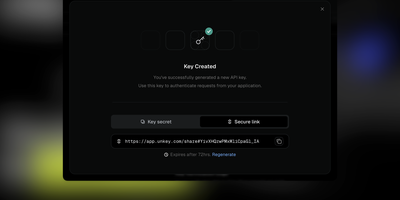
Unkey is the open-source platform that unifies API key management, rate limiting, deployment, and observability into a single control plane. The Go API service validates keys with sub-millisecond latency using regional Redis caches and MySQL 8.0 persistent storage, while ClickHouse captures every verification event for per-key and per-keyspace analytics with filterable time-series charts, request counters, and active key tracking. Keyspaces organize API keys by product, environment, or tier, each configurable with custom prefixes, byte lengths, IP whitelists, encrypted key recovery, and delete protection. Per-key settings include expiration dates, rate limit quotas with configurable windows, RBAC roles and permissions, owner identities linking multiple keys to a single user or organization, and key rotation with grace periods from immediate revocation through 24-hour overlap. The deployment pipeline connects GitHub repositories for automatic Docker container builds, generates preview environments per commit, promotes tested versions to production, and validates releases with OpenAPI diff detection flagging breaking changes before production. The edge gateway authenticates and rate-limits requests at the closest region before routing to the nearest API instance. Immutable audit logs track every key creation, verification, deletion, and configuration change with actor, timestamp, and event metadata. The CLI provides terminal access to key management, analytics queries, and deployment operations. On RepoCloud, deploy Unkey on a dedicated VPS with Docker, root SSH access, and complete control over your API infrastructure, all under the AGPL license.
OliveTin
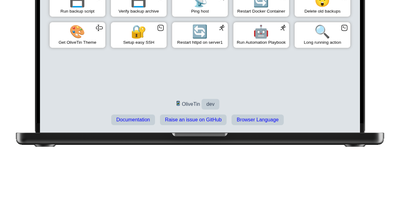
With over 3,600 GitHub stars and a philosophy of deliberate simplicity, OliveTin eliminates the need for SSH sessions, admin panels, and complex automation platforms by letting you define shell commands in a YAML config file and access them as clickable buttons through a clean browser interface. The Go binary consumes only a few megabytes of RAM, running on everything from tiny ARM and RISC-V devices through Linux VMs, containers, macOS, and Windows. Each button executes a predefined shell command with optional typed arguments that render as dropdowns, text fields, and validated inputs, preventing free-form command entry while giving users controlled access to server operations. Access control lists define exactly who can view or run each action — guests, family members, or junior administrators see only the buttons they are permitted to use. Entity templates generate actions dynamically from lists of hosts, containers, or other resources, creating one template that produces many buttons without manual duplication. Flexible triggers extend beyond browser clicks: cron schedules, webhooks, calendar file events, and filesystem watchers run actions automatically when conditions are met. Authentication supports OAuth2, JWT, and header-based methods for integration with reverse proxies and identity providers. Dashboards organize actions into folders and fieldsets for clear navigation across dozens of commands. No plugin system, no extension marketplace, no premium tiers — every feature ships in the single open-source release. Running on a dedicated VPS on RepoCloud with guaranteed CPU, RAM, and SSD, full root SSH access, and a browser serial console. AGPL-3.0 licensed.
Nixopus
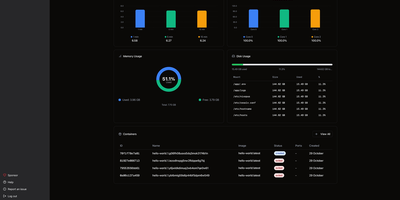
Tell an AI agent to deploy your app and watch it actually happen. Nixopus connects to your GitHub repo, analyzes the codebase to detect your framework, generates the right Docker configuration, resolves dependency conflicts, and ships the whole thing to your server with HTTPS enabled. When something breaks, the agent reads the logs, creates a pull request with a fix, and redeploys without waking you up. The chat interface lets you deploy, add custom domains, check logs, roll back, and troubleshoot in plain English from the web dashboard or directly from your VS Code or Cursor editor. Extensions bring one-click installs for 100+ self-hostable apps like Appwrite, Excalidraw, and Ollama, each showing you exactly what it runs on your server before installation. Connect multiple servers and monitor CPU, memory, disk, and running containers across your entire fleet from a single dashboard with draggable widget layouts. The built-in terminal opens SSH sessions right in the browser with split-pane support, so you can watch logs in one pane while running commands in another. Framework detection covers Next.js, Django, Rails, Go, FastAPI, and anything else that fits a container image. Every deployment gets automatic TLS via Caddy with Let's Encrypt certificates provisioned and renewed silently. Previous container images are retained so rollbacks skip the rebuild step entirely. Deploy on a dedicated VPS on RepoCloud with guaranteed CPU, RAM, and SSD, full root SSH access, and a browser serial console. AGPL-3.0 licensed.
QuickStack
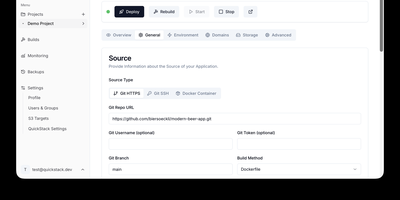
QuickStack transforms your standalone Linux server or cluster into a self-hosted platform-as-a-service that automatically compiles, deploys, and monitors full-stack applications and relational databases without vendor lock-in. Developers can trigger instant deployments directly from public or private Git repositories, upload custom Dockerfiles, or pull container images straight from private registries with automated webhook synchronization. The built-in application catalog enables one-click provisioning of production databases including PostgreSQL, MySQL, MariaDB, MongoDB, and Redis with preconfigured internal network isolation. Administrators can route traffic across custom domains with automated Let's Encrypt SSL certificate issuance, inspect real-time CPU and memory telemetry, stream container runtime logs, and launch in-browser web terminals. Teams can configure granular role-based access controls with single sign-on authentication, establish zero-trust ingress and egress network security policies, and orchestrate automated volume snapshots directly to S3 object storage. When infrastructure requirements expand, operators can attach additional worker nodes using lightweight join tokens to distribute workloads seamlessly across high-availability compute pools. Running on a dedicated VPS on RepoCloud with guaranteed CPU, RAM, and SSD, full root SSH access, and a browser serial console. GNU GPL v3.0 licensed.
PowerDNS-Admin
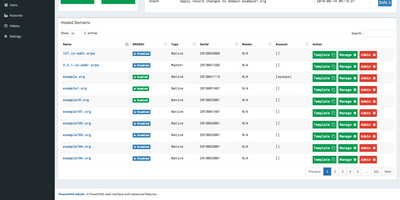
Raw zone files and API calls become something a whole team can operate safely once PowerDNS-Admin puts its web interface in front of a PowerDNS authoritative server. It's a Python/Flask application covering full forward and reverse zone management, with the touches that matter in daily DNS work: zone templates for stamping out consistent new domains, easy IPv6 PTR record editing (reverse zones by hand are misery), full IDN/Punycode support for internationalized domains, and DynDNS 2 protocol support so routers and scripts can update records the way they would against a commercial dynamic-DNS service. Access control is enterprise-grade: local users, LDAP against OpenLDAP or Active Directory, SAML, and OAuth via Google, GitHub, Azure, or OpenID Connect, hardened with TOTP two-factor authentication. Role-based permissions extend to zone-specific access control - hand a developer their project's zone without exposing the rest of your namespace - and activity logging records who changed which record when, the audit trail bare PowerDNS never gives you. The dashboard monitors PDNS service configuration and statistics, and its own API exposes zone and record management for automation on top of the UI. Runs against MySQL/MariaDB or PostgreSQL, talking to PowerDNS through its REST API. MIT-licensed.
pgweb
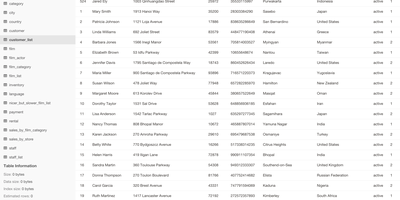
Inspect a PostgreSQL database right now, without installing pgAdmin or exposing Postgres to the internet - pgweb answers that recurring need. It's a Go application from Dan Sosedoff, a decade in development, shipped as a single statically-linked binary with zero dependencies - the Docker image is essentially just the executable - that puts a clean browser UI in front of any PostgreSQL 9.1+ server. Connect via URL string or host/port credentials, and browse tables, views, and sequences from the sidebar; selecting a table shows its rows immediately alongside tabs for structure, indexes, and constraints. The Query tab executes arbitrary SQL with query history, and the Explain Query button renders the query plan - estimated cost, row counts, execution strategy - which makes pgweb a quick performance-triage tool, not just a browser. Results and entire tables export to CSV, JSON, or XML in a click. Connectivity is more flexible than its size suggests: native SSH tunneling (password or key) reaches databases behind firewalls, server bookmarks make switching instances instant, and an optional multi-session mode handles several databases concurrently. For a RepoCloud stack full of Postgres-backed apps, one pgweb instance is the universal inspection hatch. MIT-licensed, actively maintained.
CoreObs
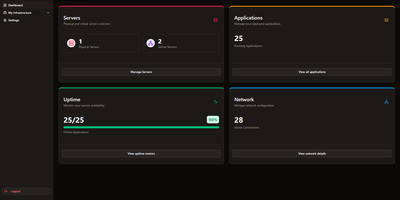
CoreObs delivers a unified self-hosted dashboard that replaces the typical combination of Uptime Kuma, Homer, and separate monitoring tools with a single interface for managing your entire server infrastructure. The Next.js frontend with shadcn components provides a modern dark-themed UI displaying server hardware metrics collected by a lightweight Go agent that leverages Glances for hardware abstraction — streaming real-time per-core CPU load, RAM utilization, NVIDIA GPU statistics, disk usage, system uptime, and load averages via WebSocket connections. The application registry tracks all self-hosted services with configurable uptime monitoring, availability history charts, and instant notifications through Discord, Telegram, Pushover, and email when services go down or recover. Quick-access links provide one-click navigation to each application's management panel directly from the dashboard. The network visualization module built on React Flow enables creating visual topology maps of your infrastructure with drag-and-drop nodes representing servers, switches, and services connected by labeled edges. Server data can be organized with tags, copied between entries, and monitored with configurable pagination and compact view modes. Deploy via Docker Compose with three containers — the Next.js web interface, the Go monitoring agent, and PostgreSQL 17 for persistent storage. Running on a dedicated VPS on RepoCloud with guaranteed CPU, RAM, and SSD, full root SSH access, and a browser serial console. MIT licensed.
Shelve
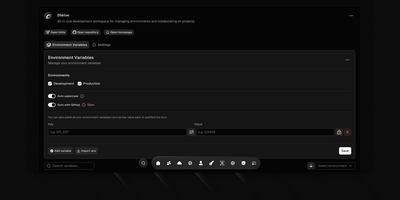
Eliminate scattered configuration files and leaked credentials across development teams with Shelve, an open-source secrets management platform that secures environment variables across development, staging, and production tiers. Engineering teams can organize sensitive database passwords and third-party API credentials within a centralized vault protected by AES-256 encryption and SHA-256 integrity verification. The platform synchronizes configurations directly to GitHub Actions and repository secret stores through an official GitHub App integration. Developers can inject encrypted variables directly into local processes using the dedicated CLI without saving plain-text secrets to disk. The built-in sharing vault creates self-destructing, password-protected links to exchange sensitive credentials securely with external contractors. Administrators can define custom workspace teams with granular role-based access controls, track change audit logs across configuration histories, and navigate management views using a keyboard-driven command palette. Automated schema validation engines detect missing parameters and enforce uniform uppercase naming standards across application tiers. Running on a dedicated VPS on RepoCloud with guaranteed CPU, RAM, and SSD, full root SSH access, and a browser serial console. Apache 2.0 licensed.
Composr
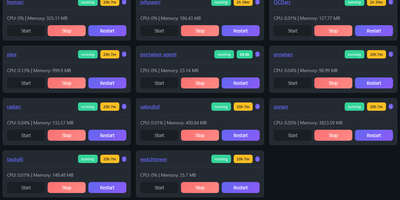
Managing multi-server container fleets often deteriorates into fragmented SSH sessions, mismatched compose files, and conflicting port allocations. Composr consolidates multiple Docker host daemons into a unified web dashboard that controls running containers, stack definitions, and system metrics from a single interface. Operators can connect remote Docker daemons through encrypted TCP sockets, inspect container health, and stream live execution logs with sub-second responsiveness. A built-in project creation wizard guides administrators through drafting new Compose topologies across local directories or remote server nodes. In-browser CodeMirror editors deliver live syntax highlighting for YAML files, configuration dotfiles, and reverse proxy definitions without detaching containers from disk. The platform tracks service properties directly, letting you toggle Compose profiles, relocate services between YAML manifests with pre-flight risk checks, and detect target port collisions before redeployment. Integrated backup managers bundle container metadata, compose files, and environment definitions into downloadable archive packages for automated disaster recovery. System operators can open interactive browser terminals into any active container, execute batch maintenance tasks, and configure scheduled image update checks. Running on a dedicated VPS on RepoCloud with guaranteed CPU, RAM, and SSD, full root SSH access, and a browser serial console. MIT licensed.