pgAdmin
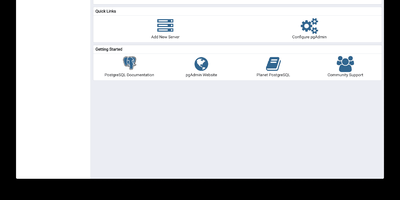
pgAdmin 4 is the reference administration GUI for PostgreSQL, bundled by virtually every Linux distribution and supporting versions 14 through 18 including EDB Advanced Server — browse schemas in a hierarchical tree, write and optimize queries with AI assistance, design entity-relationship diagrams visually, monitor live sessions, and run backup/restore operations entirely from the browser. Built on Python Flask with a ReactJS frontend, version 9.17 delivers a comprehensive web-based platform accessible from any device. The Query Tool provides syntax highlighting, auto-completion, query history, an EXPLAIN plan visualizer with graphical node representation, AI-powered SQL generation from natural language prompts, and AI Insights for execution plan analysis that identifies performance bottlenecks. The Graph Visualiser renders query results as line charts, bar charts, stacked charts, and pie charts directly in the interface. The ERD Tool auto-generates entity-relationship diagrams from existing schemas for visual database design. The Schema Browser presents databases, schemas, tables, views, functions, sequences, roles, and extensions in a navigable hierarchy. Server monitoring dashboards display real-time active sessions, locks, transaction throughput, and vacuum status. GUI-driven backup and restore wraps pg_dump and pg_restore with format and compression options. Authentication supports internal, LDAP, Kerberos, OAuth2/OIDC, and webserver modes. The Helm chart includes an HTTPRoute template for Kubernetes Gateway API deployments. Bundled pg_dump, pg_restore, and psql utilities version 18.4. Deploy via Docker with the official dpage/pgadmin4 image. Running on a dedicated VPS on RepoCloud with guaranteed CPU, RAM, and SSD, full root SSH access, and a browser serial console. PostgreSQL License.
CPA Manager Plus
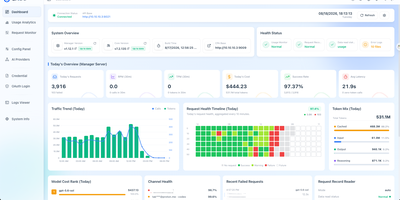
CPA Manager Plus is a self-hosted observability dashboard and management panel that tracks every AI request flowing through your CLI Proxy API gateway, breaking down failures, costs, and account health across providers like OpenAI, Anthropic, xAI, and Codex in one interface. When a request fails, drill into the persistent history to see status codes, affected models, latency, and redacted failure evidence without exposing raw response bodies. The cost analytics engine breaks down token consumption and estimated spend by model, provider, account, API key, project, channel, and time range while tracking input, output, reasoning, cache, and service-tier pricing semantics separately. Model prices sync automatically from models.dev with LiteLLM and OpenRouter fallbacks, and you can add local overrides for aliases or internal models. For teams running Codex or xAI accounts, the health inspector reads quota windows, reset evidence, credential state, and workspace status on a configurable schedule, routing credential failures into an action queue for review rather than letting them silently degrade throughput. Deploy the Lightweight Panel to replace your existing CPA management UI without adding another service, or run Full Mode as a single Docker container that adds the Manager Server with persistent SQLite storage for request history, historical analytics, and automated account inspections. Export or import request history as JSONL for external analysis, and back up the SQLite files alongside your encrypted management keys. Running on a dedicated VPS on RepoCloud with guaranteed CPU, RAM, and SSD, full root SSH access, and a browser serial console. MIT licensed.
Aptabase
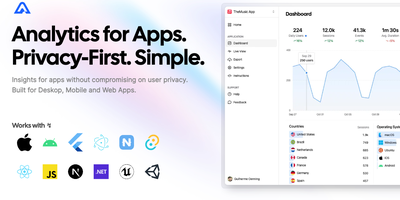
Web analytics tools ignore native mobile, desktop, and game apps; Aptabase was built for exactly those. If Firebase Analytics would force a privacy-policy footnote you don't want to write, this is the alternative - session-based metrics with no cookies, no IDFA or GAID, no device fingerprinting, and a daily-rotated salt that makes cross-day re-identification mathematically impossible. That design means GDPR, CCPA, and PECR compliance out of the box and "Data Not Collected" App Store privacy labels without ATT prompts. The SDK coverage is the widest in its category: eleven first-party libraries spanning Swift, Kotlin, Flutter, React Native, Tauri, Electron, .NET MAUI, NativeScript, Unity, Unreal Engine, and JavaScript for web - each MIT-licensed, following platform conventions, and accepting a custom host parameter that points at your instance. Integration is minutes: initialize with an app key, call trackEvent with optional properties, and the dashboard shows sessions, events, app versions, OS breakdowns, and country-level geography. The self-hosted stack is a .NET server over PostgreSQL for metadata and ClickHouse for high-volume event ingestion, giving cloud-parity features under an AGPL license. For indie iOS/Android apps, Electron and Tauri tools, and Unity or Unreal games, it replaces Firebase without the Google entanglement.
Bugsink
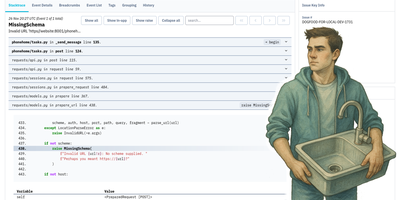
Bugsink has earned over 1,800 GitHub stars as the lightweight self-hosted error tracking platform that replaces Sentry without per-event billing by accepting error reports from any Sentry-compatible SDK across Python, JavaScript, Node.js, Ruby, Java, PHP, Go, and every other language Sentry supports. Simply update the DSN in your existing Sentry configuration and Bugsink captures the same stack traces, local variables, request context, and breadcrumbs that Sentry processes, displayed through a focused interface designed for debugging rather than dashboarding. Automatic issue grouping collapses duplicate error events into single actionable issues based on exception type, message, and stack frame context, turning thousands of raw events into a manageable list. Issue status tracking supports resolved, resolved-in-next-release, and muted states with automatic regression detection when resolved issues recur. Release tracking associates events with deploy versions to correlate error spikes with specific rollouts. Tag-based search filters issues by environment, release, user, browser, operating system, or any custom key-value pair sent by the SDK. Alerting notifies your team through Slack, Discord, Mattermost, and email when new issues appear or resolved issues regress, with per-project webhook configuration and user-level notification preferences. Per-project retention policies with automatic event eviction manage storage growth. A REST API with OpenAPI documentation enables custom integrations and dashboards. Source map support links minified JavaScript to original source. Deploy via Docker with the bugsink/bugsink image. Running on a dedicated VPS on RepoCloud with guaranteed CPU, RAM, and SSD, full root SSH access, and a browser serial console. PolyForm Shield licensed.
Homelable
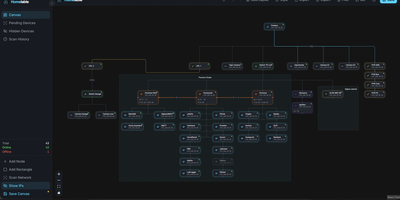
Homelable turns your entire homelab into a live, interactive network canvas where every device, link, and service shows its real-time status at a glance. Run an nmap-powered network scan against your subnets and the tool fingerprints services, queues unknown devices for review, and drops approved hosts onto a drag-and-drop canvas with 15 native node types covering routers, switches, hypervisors, NAS boxes, IoT sensors, and more. Import your full Zigbee2MQTT mesh (controllers, routers, end devices with link quality indicators) and Z-Wave JS device trees in one click, preserving the actual RF topology without manual wiring. Proxmox integration pulls in hosts, VMs, and LXC containers so you can nest virtual machines inside their parent hypervisor node on the canvas. The Rack Canvas mode documents the physical side of your lab: create racks with configurable U-height, mount gear into slots, and patch ports across devices to track your cabling. Health checks run every 60 seconds using ping, HTTP, HTTPS, TCP, SSH, or Prometheus scrape endpoints, with WebSocket push delivering green, red, or pending status pulses directly to the canvas. Split your infrastructure across multiple canvases organized by site, rack, or purpose, and share a read-only Live View URL with anyone on your network. A built-in Model Context Protocol server lets AI assistants like Claude query and modify your topology through natural language. Deploy on a dedicated VPS on RepoCloud with guaranteed CPU, RAM, and SSD, full root SSH access, and a browser serial console. MIT licensed.
Langfuse
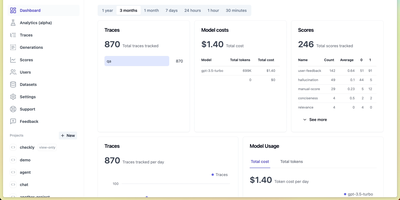
Backed by Y Combinator and trusted by over 2,300 companies processing billions of observations monthly, Langfuse is the most widely adopted open-source platform for building, monitoring, evaluating, and debugging LLM applications. The hierarchical tracing engine captures every LLM call, tool invocation, retrieval step, and agent action as nested spans based on OpenTelemetry, with automatic cost calculation, latency tracking, and token usage attribution across sessions and users. Prompt Management separates prompts from code with versioned artifacts, label-based deployments, one-click rollbacks, and runtime SDK fetching with server-side caching, while linking every generation back to its exact prompt version for attribution analytics. The evaluation system supports LLM-as-a-judge scoring, heuristic code evaluators, user feedback collection, and manual annotation workflows that run automatically on production traces or against curated datasets. The Playground enables interactive prompt testing on real production inputs with side-by-side model comparison across providers. Datasets and Experiments define test cases for systematic benchmarking with comparative result visualization. Native SDKs for Python and TypeScript provide decorator-based instrumentation, while 100+ integrations cover LangChain, LlamaIndex, OpenAI SDK, LiteLLM, Vercel AI SDK, and any OpenTelemetry-instrumented framework. The analytics dashboard surfaces cost breakdowns, quality scores, latency percentiles, and usage trends across models and prompt versions. Running on a dedicated VPS on RepoCloud with guaranteed CPU, RAM, and SSD, full root SSH access, and a browser serial console. MIT licensed.
Beszel
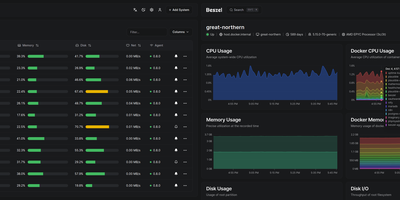
Reaching 24,000 GitHub stars within two years of its first commit in July 2024, Beszel delivers Netdata-grade monitoring dashboards from a single Docker container with no Prometheus stack, no external database, and no complex configuration — just a one-binary hub on PocketBase (SQLite embedded) and a sub-15 MB agent per host that auto-discovers Docker and Podman containers on contact. The agent connects outbound via WebSocket or SSH tunnel, requiring zero open ports on monitored servers and zero manual network configuration. Per-host metrics cover CPU usage, memory with swap and ZFS ARC breakdown, disk I/O across multiple partitions, network throughput, load average, sensor temperatures, battery charge, and GPU utilization with power draw for Nvidia, AMD, and Intel cards — features that competitors lock behind paid tiers. S.M.A.R.T. disk health including eMMC wear indicators and Linux mdraid array status surface hardware degradation before failures occur. Container statistics track CPU, memory, and network history per container with automatic discovery as new containers start. Configurable threshold alerts notify via email, Discord, Telegram, ntfy, Pushover, Gotify, Matrix, Mattermost, Signal, Slack, Microsoft Teams, and Twilio when metrics exceed defined limits. Multi-user accounts with OAuth/OIDC authentication let teams share monitored systems with role-based access, while automatic backups persist data to disk or S3-compatible storage. Running on a dedicated VPS on RepoCloud with guaranteed CPU, RAM, and SSD, full root SSH access, and a browser serial console. MIT licensed.
Headlamp
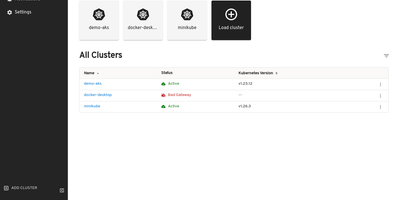
The Kubernetes project's own answer to cluster management UIs: maintained under SIG UI governance, Headlamp's roadmap tracks Kubernetes releases and its design philosophy reflects community needs rather than a vendor's product strategy. The React interface provides full read-write capabilities adapted to each user's RBAC permissions — delete, scale, edit, and restart buttons appear only when the authenticated user holds the corresponding cluster role, preventing accidental unauthorized actions. Multi-cluster support surfaces workloads across development, staging, and production from a single view without context switching. The plugin architecture drives extensibility through a curated catalog: an AI Assistant plugin answers natural-language cluster queries and performs operations via configurable LLM keys, Flux handles GitOps, Karpenter manages nodes. Integrated terminals provide browser-based exec access to running pods, live log streaming follows container output with filtering, and the YAML editor displays inline Kubernetes API documentation alongside resource definitions. Deployment creation forms let you configure containers, environment variables, volumes, and replicas without writing manifests. Side-by-side cluster comparison views surface differences in workload distribution. Works with any distribution: EKS, GKE, AKS, Minikube, Docker Desktop. Helm chart installation via the Headlamp repository with images on GitHub Container Registry. Running on a dedicated VPS on RepoCloud with guaranteed CPU, RAM, and SSD, full root SSH access, and a browser serial console. Apache-2.0 licensed.
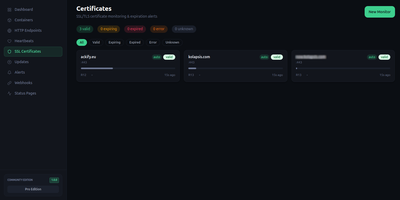
Maintenant
Maintenant replaces three to five separate monitoring tools with a single Go binary that consolidates container discovery, endpoint monitoring, SSL tracking, resource metrics, and public status pages without requiring any external database. The embedded Vue 3 frontend serves on port 8080 immediately after deployment, auto-discovering Docker containers and Kubernetes pods through direct socket and API access without configuration. HTTP and TCP endpoint monitoring validates availability with configurable intervals, while TLS certificate tracking alerts before expiration across all monitored domains. Resource metrics collect CPU, RAM, network throughput, and disk usage per container with real-time Server-Sent Events streaming to the dashboard. Heartbeat and cron monitoring accepts pings from external scheduled jobs, triggering alerts on missed check-ins via webhook callbacks and Discord notifications. The built-in alert engine supports escalation rules and notification batching. Public status pages expose component health to end users without authentication, customizable per monitored service. Network security insights analyze exposed ports, container privilege levels, and host configuration to produce a posture score. Update intelligence scans OCI registries to detect available container image updates with digest comparison. The REST API with SSE broker enables automation, and the integrated MCP server provides tooling for AI assistant integration. SQLite in WAL mode stores all data with zero operational overhead. Running on a dedicated VPS on RepoCloud with guaranteed CPU, RAM, and SSD, full root SSH access, and a browser serial console. AGPL-3.0 licensed.
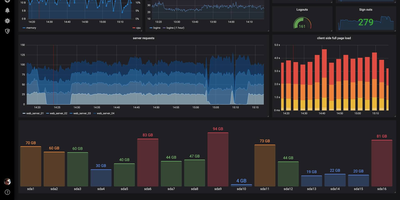
Grafana
The de facto dashboard of observability: Grafana is the open-source frontend that turns the data stores you already run into interactive graphs. It does not store metrics itself; it connects to the data stores you already run and turns their contents into interactive dashboards. Supported sources number over 150 via plugins: Prometheus, Loki, Tempo, InfluxDB, Elasticsearch, MySQL, PostgreSQL, Microsoft SQL Server, AWS CloudWatch, Azure Monitor, Google Cloud Monitoring, and many more. Dashboards are built from a large library of panel types (time series, heatmaps, tables, gauges, logs) with template variables for reusable, parameterized views. Unified alerting evaluates rules against any connected data source, not just Prometheus, and routes notifications to Slack, PagerDuty, email, and other channels with grouping and silencing - unlike Prometheus Alertmanager, a single rule can combine a Loki log pattern, a PostgreSQL query result, and a CloudWatch metric. Dashboards serialize to JSON and data sources configure via provisioning files, so the entire observability setup can live in Git and deploy repeatably across environments. Explore mode adds ad-hoc querying outside dashboards, with split view for correlating a metric spike against the matching log lines, and access control spans organizations, teams, folder permissions, and OAuth, LDAP, and SAML integration. Written in Go and TypeScript, AGPL-licensed. Self-hosting gives you unlimited users, dashboards, and queries at flat hosting cost, without Grafana Cloud's usage-based pricing.
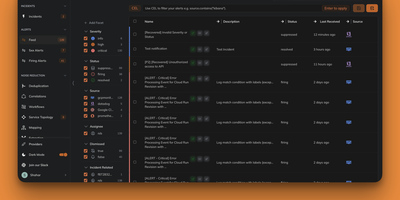
Keep
Keep is an open-source AIOps and alert management platform built with Python FastAPI and Next.js. It provides a single pane of glass for monitoring alerts from 110+ integrations, alert deduplication, correlation, enrichment, and filtering, YAML-based workflow automation similar to GitHub Actions, AI-powered correlation and summarization, and customizable dashboards for incident management. With 12,100+ GitHub stars, Y Combinator backing, and an Elastic partnership, Keep is the open-source AIOps platform that centralizes alert management across your entire monitoring stack into a single customizable dashboard. Alert deduplication identifies duplicate notifications across providers, correlation groups related alerts into incidents based on rules or AI-powered semantic analysis using pluggable LLM backends supporting OpenAI, Anthropic, and local models via Ollama, and enrichment adds context from external sources like CMDBs and databases. Workflow automation follows a GitHub Actions paradigm with declarative YAML files defining triggers, conditions, and actions that can query MySQL, update Jira tickets, send Slack messages, execute Python scripts, or call REST APIs. Authentication supports no-auth, database, Auth0, Keycloak, OAuth2 Proxy, Okta, and OneLogin. The Common Expression Language enables advanced alert querying, slicing, and rule-based grouping to reduce noise. On RepoCloud, deploy Keep on a dedicated VPS with Docker Compose, root SSH access, and complete control over your alert infrastructure, all under the MIT license.
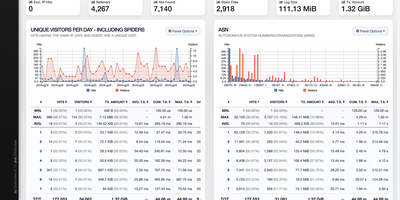
GoAccess
GoAccess processes millions of web log entries in seconds and renders the results as interactive dashboards that update every 200 milliseconds in the terminal or every second via WebSocket-connected HTML reports. Written entirely in C with only ncurses as a dependency, it achieves exceptional performance even on resource-constrained servers, reducing memory usage by approximately 20% and parsing time by 35% in recent releases through optimized in-memory hash tables with on-disk persistence support. The analyzer parses virtually every web log format out of the box (Apache Combined and Common, Nginx, Amazon CloudFront, Amazon S3, AWS Elastic Load Balancing, Google Cloud Storage, Squid, W3C IIS, Caddy JSON, and Traefik) while supporting fully custom log format strings for non-standard configurations. The self-contained HTML dashboard displays 15+ interactive panels covering unique visitors, requested files, static files, 404 errors, referring sites, search keyphrases, geographic location with city-level GeoIP resolution, operating systems, browsers, HTTP status codes, time distribution, and virtual host metrics. WebSocket authentication via JWT provides secure remote access, and incremental log processing ensures data continuity across daemon restarts. Docker deployment requires a single command with volume-mapped access logs. Over 20,800 stars with active development since 2010. Running on a dedicated VPS on RepoCloud with guaranteed CPU, RAM, and SSD, full root SSH access, and a browser serial console. MIT licensed.
PRISM
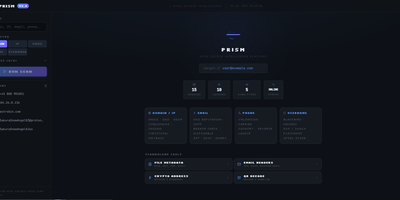
PRISM consolidates passive reconnaissance, credential leak detection, and network asset mapping into a unified operational dashboard to replace fragmented command-line security tools. Analysts can launch simultaneous multi-source investigations against domains, internet protocol addresses, email mailboxes, phone numbers, and online handles to uncover domain registrations, open network ports, cryptographic certificates, and historical web archives. The platform interrogates threat feeds and leak repositories to expose credential leaks, dark web mirrors, and email routing anomalies with automated SMTP mailbox verification. Cross-platform identity engines crawl thousands of social networks and public registries to correlate aliases, discover leaked commit identities, and trace digital footprints across the web. Discovered assets render into interactive entity relationship graphs alongside geographic internet protocol maps to help investigators visualize infrastructure clusters and ownership links. An automated operational security calculator evaluates exposure vulnerabilities across identity, web, and infrastructure vectors, producing an aggregated risk score with granular hardening recommendations. Scheduled watchlists continually monitor target infrastructure, dispatching webhook notifications to chat channels whenever new subdomains, ports, or credential leaks appear. Investigators can export comprehensive audit dossiers as self-contained HTML files, styled PDF documents, or structured spreadsheets. Running on a dedicated VPS on RepoCloud with guaranteed CPU, RAM, and SSD, full root SSH access, and a browser serial console. MIT licensed.
Sentry
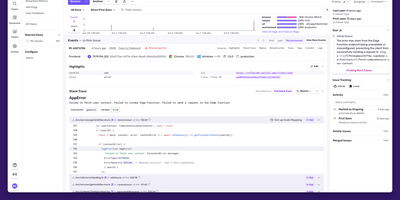
Backed by 44,000 GitHub stars and trusted by over four million developers, Sentry is the debugging platform that captures errors, traces, replays, profiles, and metrics from your applications and connects them all through distributed tracing. The error tracking engine captures full stack traces with source context, breadcrumbs, and automatic demangling for native crashes, while intelligent grouping consolidates duplicate events into actionable issues with regression detection and automatic assignment. Performance monitoring instruments your frameworks automatically, capturing every database query, API call, cache hit, and queue operation as spans within distributed traces that flow across frontend, backend, and mobile boundaries. Session Replay produces video-like recordings of real user sessions showing DOM interactions, network requests, console messages, and errors on a synchronized timeline, with AI-powered summaries that describe what happened without watching the full replay. Continuous profiling captures CPU execution data at the function and line level for Node.js, Python, iOS, and Android, linking slow spans directly to the exact code responsible. Cron monitoring tracks scheduled jobs for failures, missed runs, and duration anomalies. The alerting engine fires notifications through Slack, PagerDuty, Opsgenie, and webhooks on new issues, regressions, error spikes, or when latency and crash-free session rate thresholds are crossed. Self-hosted deployment runs as a Docker Compose stack with PostgreSQL, ClickHouse, Kafka, Redis, and Relay. Running on a dedicated VPS on RepoCloud with guaranteed CPU, RAM, and SSD, full root SSH access, and a browser serial console. FSL licensed.
Wazuh
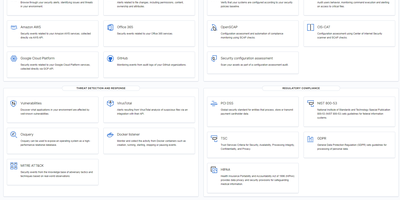
Protecting over 10,000 organizations worldwide with 16,000+ GitHub stars, Wazuh delivers enterprise-grade security operations through a fully open-source platform with zero feature gating. The unified XDR and SIEM solution deploys lightweight agents across Linux, Windows, macOS, Solaris, AIX, and HP-UX endpoints that stream security telemetry to a centralized cluster built on OpenSearch for indexing and the Wazuh Dashboard for visualization and management. Core capabilities include real-time file integrity monitoring with inotify-based detection and who-data attribution, automated vulnerability assessment that correlates software inventories against continuously updated CVE databases, Security Configuration Assessment against CIS benchmarks, rootkit detection, and log data analysis with a rules engine supporting over 3,000 built-in detection rules mapped to MITRE ATT&CK tactics and techniques. Wazuh monitors cloud infrastructure at the API level with native modules for AWS, Azure, and Google Cloud, detects container anomalies through Docker engine integration, and ingests third-party telemetry via syslog and REST APIs from sources like VirusTotal, TheHive, YARA, Suricata, and PagerDuty. Pre-built compliance dashboards and reports cover PCI DSS, HIPAA, NIST 800-53, GDPR, and TSC frameworks. Active response capabilities automatically trigger countermeasures including firewall rule updates, account lockouts, and endpoint isolation when threats are detected. The platform scales horizontally with multi-node clustering for high availability. Running on a dedicated VPS on RepoCloud with guaranteed CPU, RAM, and SSD, full root SSH access, and a browser serial console. GPL-2.0 licensed.
Temps
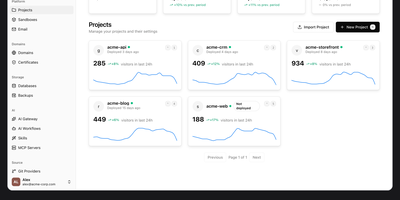
Consolidate application hosting, web analytics, error tracking, and performance monitoring into Temps, an open-source developer platform that replaces disparate SaaS subscriptions with a single compiled Rust binary. Engineering teams deploy full-stack web applications, background daemons, and microservices directly from Git repositories with automated TLS certificate provisioning powered by an embedded Cloudflare Pingora reverse proxy. The centralized web console unifies real-time visitor analytics, conversion funnels, and rrweb-powered session replay recordings without third-party tracking scripts. Integrated error monitoring ingests runtime exceptions with full stack traces and source map resolution, while continuous health checks evaluate container CPU utilization, memory thresholds, and network throughput across custom alerting rules. Developers manage infrastructure through an extensive command line interface containing over 440 operations across 69 command groups, or deploy drop-in skill files that allow AI coding assistants like Claude Code and Codex to provision preview environments autonomously. The platform also provides serverless key-value storage, S3-compatible blob buckets, and native transactional email routing with custom DKIM validation. Running on a dedicated VPS on RepoCloud with guaranteed CPU, RAM, and SSD, full root SSH access, and a browser serial console. Apache 2.0 licensed.
Gatus
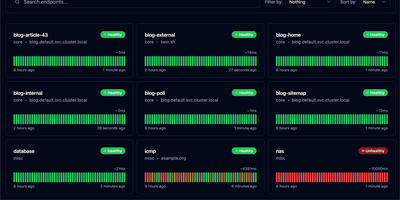
With 11,400+ GitHub stars and active development since 2019, Gatus is the developer-oriented status page and health monitoring tool that ships as a single statically-linked Go binary in a scratch Docker image under 20 MB — deploying in seconds while monitoring your entire infrastructure across 12 protocols from a single YAML configuration file. Define health checks for HTTP, ICMP, TCP, DNS, gRPC, WebSocket, SSH, UDP, SCTP, STARTTLS, and TLS endpoints with conditions that go far beyond simple ping: evaluate response status codes, body content with JSONPath expressions, response time thresholds, certificate expiration days, DNS record values, and IP address ranges. Each endpoint supports independent alerting through Slack, Microsoft Teams, PagerDuty, Discord, Telegram, Twilio, Mattermost, Google Chat, email, Gotify, Pushover, and custom webhook providers with configurable failure thresholds and descriptions. The built-in status page displays uptime badges, response time graphs, and incident timelines with maintenance window support for planned downtime communication. External endpoints accept push-based health reports from services behind firewalls. Prometheus metrics export via the /metrics endpoint enables integration with existing observability stacks. OIDC and Basic Authentication protect the dashboard. PostgreSQL persistence stores historical uptime data. The official Helm chart supports Kubernetes deployment with liveness probes and PVC storage, while a community sidecar auto-generates endpoint configurations from Kubernetes Ingress and HTTPRoute resources. Running on a dedicated VPS on RepoCloud with guaranteed CPU, RAM, and SSD, full root SSH access, and a browser serial console. Apache 2.0 licensed.
SigNoz
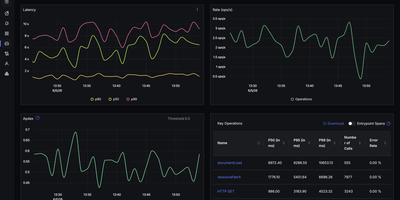
With over 31,000 GitHub stars and native OpenTelemetry support that eliminates vendor lock-in from day one, SigNoz delivers full-stack observability covering metrics, traces, and logs in a single pane of glass without the per-host pricing model of commercial APM platforms. The platform ingests telemetry data through the OpenTelemetry Collector, supporting auto-instrumentation for Java, Python, Node.js, Go, Ruby, PHP, and .NET applications with zero code changes required for basic tracing. ClickHouse serves as the columnar storage backend, providing fast aggregation queries over billions of spans and log lines with configurable retention policies and tiered storage. The distributed tracing view renders flame graphs and Gantt charts showing request flow across microservices with latency breakdowns, error rates, and p99 percentile calculations. Custom dashboards support PromQL and ClickHouse SQL queries with time-series charts, bar graphs, tables, and value widgets. The log management pipeline supports structured and unstructured logs with full-text search, log pipelines for parsing and enrichment, and correlation with traces via trace IDs. Alert rules can be configured on any metric or log query with notification channels including Slack, PagerDuty, OpsGenie, webhooks, and email. The exceptions monitoring module automatically groups and tracks application errors with stack traces, occurrence counts, and first-seen timestamps. Service maps visualize inter-service dependencies with real-time latency and error rate overlays. Running on a dedicated VPS on RepoCloud with guaranteed CPU, RAM, and SSD, full root SSH access, and a browser serial console. MIT licensed with an enterprise edition available.