Gotify
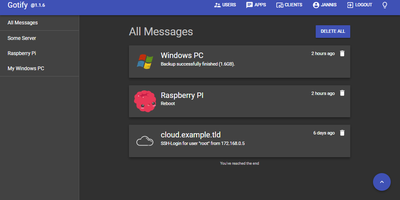
Real-time alerts from your own infrastructure to your phone, with no Firebase, Pushover, or third-party push service in the path: Gotify is a simple, self-hosted notification server written in Go. The model is deliberately minimal: senders push messages with a single HTTP POST to the REST API, receivers subscribe over a WebSocket stream, and a clean React web UI manages the pieces. Senders are namespaced as "applications," each with its own token, so your backup script, Uptime Kuma, CI pipeline, and cron jobs each get an identity, an icon, and independently revocable credentials - centralized alerting from many services with per-source management. Messages carry a title, body, and priority level that maps to notification importance on the client. The official Android app (on both F-Droid and Google Play, notable for working entirely without Google Play Services) shows push notifications for new messages; the web UI itself supports Web Push in the browser; and gotify/cli pushes messages from shell scripts with one command. A server-side plugin system adds custom behavior, and the whole thing runs as a single small binary with SQLite by default - near-zero resource footprint. Because dozens of tools (and Apprise) speak Gotify natively, it slots in as the notification hub for an entire homelab or ops stack.
Icinga 2
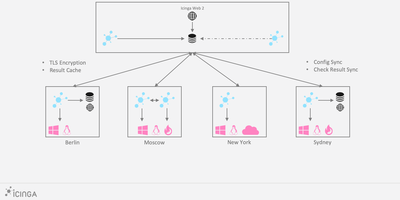
Servers, services, and network gear report their health to Icinga 2, the open-source monitoring core that runs checks, evaluates thresholds, and decides who gets woken up. A distributed hierarchy of master, satellite, and agent zones scales from a single box to global estates: satellites execute checks in remote regions and keep working when the master is unreachable, while agents run local checks under TLS-secured, certificate-based trust. The object-based configuration language defines hosts, services, dependencies, and notification rules as code, with apply rules generating checks across whole groups automatically. Performance data streams into Graphite, InfluxDB, or Elasticsearch writers, and Icinga DB carries runtime state and history into Redis and SQL for the web frontends. The REST API drives acknowledgements, downtimes, and check scheduling from scripts and chat tools, with fine-grained permissions down to diagnostic information. The 2.16 line hardens API security, streams richer runtime updates to Icinga DB for the new Icinga Notifications 1.0 incident workflows, and lets operators set exact acknowledgement times through the API. Running on a dedicated VPS on RepoCloud with guaranteed CPU, RAM, and SSD, full root SSH access, and a browser serial console. GPL-3.0-or-later licensed.
Nightingale
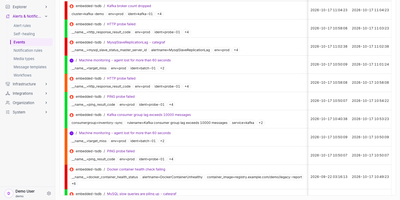
When a query crosses its threshold, Nightingale, a self-hosted alerting engine, decides who hears about it and how, without moving data out of the stores you already run. Rules use PromQL, log queries, or SQL against Prometheus, VictoriaMetrics, Elasticsearch, Loki, ClickHouse, MySQL, or PostgreSQL, graded S1, S2, or S3 with a for-duration that absorbs brief spikes. Existing Prometheus alert rules import from YAML. Business groups give each team its own rules and dashboards, and sign-in works through OIDC, OAuth2, LDAP, or CAS. Once a rule fires, mute rules silence the noise, subscriptions add recipients, and event pipelines rewrite labels or route conditionally. Delivery reaches Slack, PagerDuty, Discord, Telegram, Jira, email, DingTalk, Feishu, WeCom, SMS, and voice calls, plus HTTP webhooks and scripts for anything else. Evaluation records, active and historical events, and notification results show what happened at each step. If an alert misbehaves, the built-in AI agent explains why it fired or never arrived, and it drafts rules, dashboards, and mutes from plain-language requests. Claude Code, Cursor, and other MCP clients can query alerts and manage alerting through /mcp, read-only by default and bound by the caller's own permissions. At remote sites, n9e-edge keeps evaluating and notifying when the link to the center drops. Running on a dedicated VPS on RepoCloud with guaranteed CPU, RAM, and SSD, full root SSH access, and a browser serial console. Apache-2.0 licensed.
Ever Teams
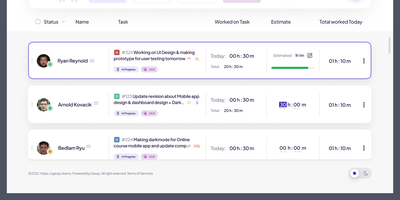
Powering distributed teams seeking full visibility into work patterns and productivity, Ever Teams is an open-source platform unifying time tracking, task management, project coordination, and team collaboration in a single self-hosted application. The real-time timer tracks work against tasks and projects with one-click start/stop, while the Electron desktop app captures periodic screenshots at configurable intervals, monitors keyboard and mouse activity levels, detects idle periods, and syncs offline sessions automatically. Kanban boards with drag-and-drop, calendar views, and daily planning tools organize work across custom statuses, priorities, and sizes. Built-in video conferencing powered by Jitsi or LiveKit enables meetings without leaving the platform. Timesheet management supports submission, review, and approval workflows with configurable time limits and budgets. The backend runs on the Ever Gauzy NestJS platform providing REST and GraphQL APIs, multi-tenant architecture with organization and team scoping, role-based access control, and an integration framework connecting GitHub issues and pull requests bidirectionally plus JIRA import and sync. Infrastructure includes PostgreSQL, Redis for caching and pub/sub, MinIO for S3-compatible storage, Elasticsearch for full-text search, and Cube.js for OLAP analytics. Built with Next.js 16, React 19, Tailwind CSS, and Recoil, with native iOS and Android clients via Expo, Electron desktop apps for Windows, macOS, and Linux, and Plasmo browser extensions for Chrome and Firefox. Internationalization spans 13-plus locales with dark, light, and system themes. Running on a dedicated VPS on RepoCloud with guaranteed CPU, RAM, and SSD, full root SSH access, and a browser serial console. AGPL v3.0 licensed.
Keep
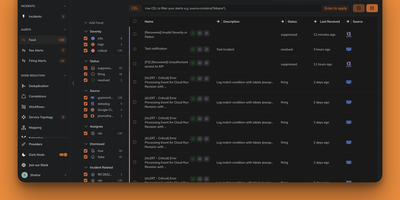
Keep is an open-source AIOps and alert management platform built with Python FastAPI and Next.js. It provides a single pane of glass for monitoring alerts from 110+ integrations, alert deduplication, correlation, enrichment, and filtering, YAML-based workflow automation similar to GitHub Actions, AI-powered correlation and summarization, and customizable dashboards for incident management. With 12,100+ GitHub stars, Y Combinator backing, and an Elastic partnership, Keep is the open-source AIOps platform that centralizes alert management across your entire monitoring stack into a single customizable dashboard. Alert deduplication identifies duplicate notifications across providers, correlation groups related alerts into incidents based on rules or AI-powered semantic analysis using pluggable LLM backends supporting OpenAI, Anthropic, and local models via Ollama, and enrichment adds context from external sources like CMDBs and databases. Workflow automation follows a GitHub Actions paradigm with declarative YAML files defining triggers, conditions, and actions that can query MySQL, update Jira tickets, send Slack messages, execute Python scripts, or call REST APIs. Authentication supports no-auth, database, Auth0, Keycloak, OAuth2 Proxy, Okta, and OneLogin. The Common Expression Language enables advanced alert querying, slicing, and rule-based grouping to reduce noise. On RepoCloud, deploy Keep on a dedicated VPS with Docker Compose, root SSH access, and complete control over your alert infrastructure, all under the MIT license.
Dashy
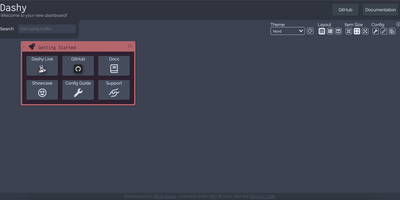
Every service you run, behind one polished start page: Dashy is the most customizable homelab dashboard, built as a Vue.js homepage. Configuration lives in a single YAML file, but you never have to hand-edit it: an integrated UI editor with real-time validation writes changes back to disk, so both config-as-code and point-and-click camps are served. Status indicators put a live health dot next to every app - HTTP checks or pings on custom intervals, with response time and status details on hover - giving you an at-a-glance uptime overview before anything breaks. Over 50 built-in widgets pull dynamic content from the services you already run: Pi-hole and AdGuard block stats, Proxmox lists, Nextcloud status, Netdata CPU/memory history, Prometheus data, plus weather, RSS, crypto prices, and generic iframe/API-response widgets for anything with an endpoint. Instant fuzzy search launches any app as you type, with customizable hotkeys and web-search fallthrough. Theming is deep: dozens of built-in themes, a UI color palette editor, and custom CSS over CSS variables. Alternate views include a fast-loading minimal startpage and a workspace view that embeds apps side-by-side without leaving the dashboard. Icons resolve from Font Awesome, homelab icon packs, emojis, or auto-fetched favicons. Built-in authentication, multi-page support, cloud backup/sync, and multi-language round out an MIT project with a massive community.
Checkcle
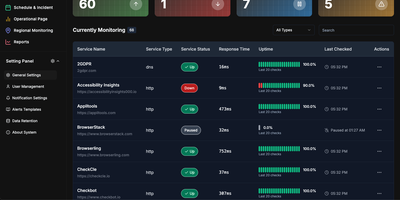
CheckCle provides a complete uptime monitoring and infrastructure observability platform that deploys with a single Docker container and stores all data in embedded SQLite via PocketBase. The Go backend runs three microservices — a service operation engine handling HTTP, HTTPS, DNS, Ping, and TCP checks at configurable intervals, a distributed regional check agent for multi-location network testing, and a server monitoring agent collecting CPU, RAM, disk usage, and network metrics via gRPC. The React frontend built with Vite, TypeScript, Tailwind CSS, and shadcn-ui subscribes to PocketBase WebSocket endpoints for real-time dashboard updates without polling. SSL and domain monitoring tracks certificate issuers, expiration dates, days remaining, and validation status. The incident management system records UP, DOWN, WARNING, and PAUSE states with full history, while scheduled maintenance windows prevent false alerts during planned downtime. Public status pages provide external stakeholders with live service health information. Health heatmaps visualize uptime performance and outage patterns over time. Notification channels include email, Telegram, Discord, and Slack, with multiple alert targets per monitored service. The one-click agent installation script supports Debian, Ubuntu, CentOS, Red Hat, Alpine, and Windows in beta. Docker deployment runs on port 8090 with a single persistent volume at /mnt/pb_data, requiring minimum 1 vCPU and 500MB RAM. On RepoCloud, deploy CheckCle on a dedicated VPS with root SSH access, persistent storage for your monitoring database, and complete control over agent endpoints and notification configurations, all under the MIT license.
GEOInflow
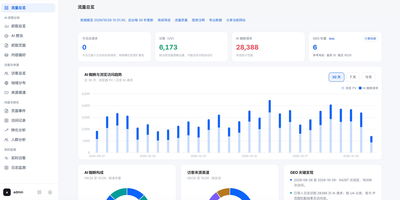
GEOInflow is a self-hosted analytics platform that shows website owners which AI crawlers visit their pages, what those crawlers read, and how much traffic and revenue AI search actually sends back. Import a sitemap, CSV, or JSON inventory and the coverage report compares it against observed crawl logs, flagging important pages that no AI crawler has ever requested and directories where coverage keeps dropping. The built-in catalog recognizes 61 AI crawler identities, including crawlers from OpenAI, Anthropic, Perplexity, Google, Microsoft, ByteDance, Baidu, Kimi, and Tencent Hunyuan, and separates training, AI search, and user-triggered visits. Verification combines declared user agents with official IP ranges and DNS evidence, so a spoofed crawler name never counts as a confirmed visit. Browser tracking connects AI search referrals to landing pages, custom events, goals, funnels, and conversions, letting teams measure whether visibility in AI answers turns into signups and sales. Alongside the GEO reports, teams get pageviews, unique visitors, referrers, geography, devices, heatmaps, retention, and visitor paths, with CSV, JSON, and ZIP exports for any selected scope. Workspaces, team permissions, and public sharing links let agencies and publishers give each client or department its own dashboards without exposing raw data or other sites. Running on a dedicated VPS on RepoCloud with guaranteed CPU, RAM, and SSD, full root SSH access, and a browser serial console. MIT licensed.
Nezha Monitoring
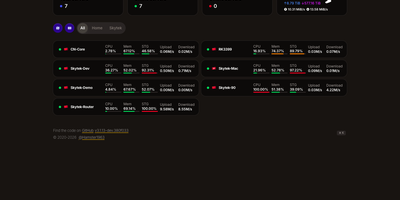
Keep every VPS, home-lab box, NAS, and router you run on one self-hosted dashboard, with a small agent on each machine reporting whether it is up and how hard it is working. Nezha tracks CPU, memory, swap, disk, load, traffic, process counts, and TCP and UDP connections on Linux, Windows, macOS, OpenWRT, and Synology machines, plus GPU and temperature where supported. Servers sort into groups and appear as cards, a list, or a world map, with live charts and, when the optional time-series database is on, 1, 7, and 30 days of history. HTTP GET, ICMP Ping, and TCPing monitors run from the servers you choose, chart latency and packet loss, and warn about HTTPS certificate changes and upcoming expiry. Alert rules watch offline servers, resource use, bandwidth, and cycle traffic limits, then message Telegram, Slack, Matrix, Feishu, DingTalk, or any webhook. A browser terminal and file manager handle quick fixes, while scheduled or alert-triggered tasks run backups, restarts, and scripts across many servers. DDNS updates Cloudflare, Tencent Cloud, or Hurricane Electric records when an agent's IP changes, and NAT traversal publishes a home router or NAS page on your own domain. Admin and user roles, scoped API tokens, and an optional MCP endpoint let people and AI tools list servers and run commands within their permissions. Running on a dedicated VPS on RepoCloud with guaranteed CPU, RAM, and SSD, full root SSH access, and a browser serial console. Apache-2.0 licensed.
CaddyUI
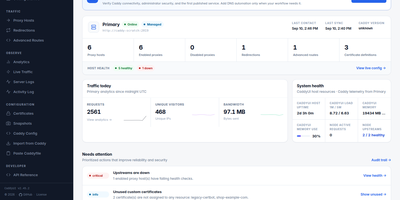
Providing an intuitive control plane for modern reverse proxy infrastructure, CaddyUI enables system administrators to manage proxy hosts, automated TLS certificates, and traffic routing without hand-editing configuration files. Operators can create and adjust reverse proxy destinations, URL path rewrites, custom headers, and redirection rules using structured forms that validate against the proxy engine before saving. The platform coordinates automatic ACME certificate requests and renewals, displaying live certificate expiration timelines, validation stages, and internal self-signed certificate authority options for local network services. Fleet management tools synchronize proxy rules across multiple distributed server instances, preventing configuration drift across staging and production clusters. Automated post-deployment health checks verify upstream endpoint availability, HTTP status codes, and latency thresholds, instantly rolling back to the previous configuration if an expectation fails. An integrated observability suite delivers real-time visitor traffic analytics, geographic maps, HTTP response code breakdowns, and single-click client IP blocking to counter malicious probing attempts. Administrators can schedule automated database backups, configure multi-user access with role permissions, and integrate CrowdSec threat intelligence to protect backends. Running on a dedicated VPS on RepoCloud with guaranteed CPU, RAM, and SSD, full root SSH access, and a browser serial console. Apache 2.0 licensed.
Langfuse
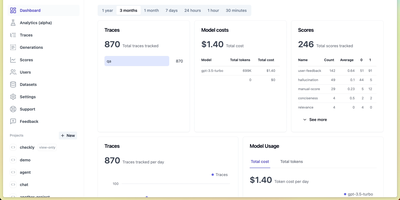
Backed by Y Combinator and trusted by over 2,300 companies processing billions of observations monthly, Langfuse is the most widely adopted open-source platform for building, monitoring, evaluating, and debugging LLM applications. The hierarchical tracing engine captures every LLM call, tool invocation, retrieval step, and agent action as nested spans based on OpenTelemetry, with automatic cost calculation, latency tracking, and token usage attribution across sessions and users. Prompt Management separates prompts from code with versioned artifacts, label-based deployments, one-click rollbacks, and runtime SDK fetching with server-side caching, while linking every generation back to its exact prompt version for attribution analytics. The evaluation system supports LLM-as-a-judge scoring, heuristic code evaluators, user feedback collection, and manual annotation workflows that run automatically on production traces or against curated datasets. The Playground enables interactive prompt testing on real production inputs with side-by-side model comparison across providers. Datasets and Experiments define test cases for systematic benchmarking with comparative result visualization. Native SDKs for Python and TypeScript provide decorator-based instrumentation, while 100+ integrations cover LangChain, LlamaIndex, OpenAI SDK, LiteLLM, Vercel AI SDK, and any OpenTelemetry-instrumented framework. The analytics dashboard surfaces cost breakdowns, quality scores, latency percentiles, and usage trends across models and prompt versions. Running on a dedicated VPS on RepoCloud with guaranteed CPU, RAM, and SSD, full root SSH access, and a browser serial console. MIT licensed.
Exceptionless
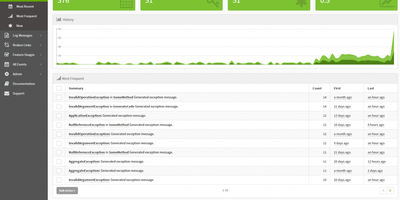
Exceptionless has earned over 2,400 GitHub stars and has been processing production errors since 2014 as the real-time event monitoring platform that captures far more than crashes. Built with ASP.NET Core on Elasticsearch for storage and Redis for caching, Exceptionless ingests exceptions, log messages, feature usage events, broken links, and custom event types through official SDKs for JavaScript, Node.js, .NET Core, ASP.NET, WPF, Web API, WebForms, Console apps, and React Native. Automatic event stacking groups related occurrences by exception type, message, and call stack into single actionable items, while manual stacking keys let developers create custom groupings for specific features or workflows. The real-time dashboard displays Most Frequent, Most Recent, and New event views with filtering by project, date range, environment, and custom tags. Stack management tracks resolution status with version-aware regression detection that automatically reopens resolved issues when the same error surfaces in a newer release. Webhook integrations connect to Slack, Discord, and external services through Zapier for automated issue tracking in GitHub Issues and Jira. Per-project notification settings control email and chat alerts for new errors, regressions, and critical events. OpenTelemetry support captures distributed traces alongside error data. The v8.6.0 release introduced a hosted Model Context Protocol server at the /mcp endpoint, enabling AI tools to query error data via OAuth-authenticated access. Deploy via Docker with the exceptionless/exceptionless image alongside Elasticsearch and Redis. Running on a dedicated VPS on RepoCloud with guaranteed CPU, RAM, and SSD, full root SSH access, and a browser serial console. Apache 2.0 licensed.
Monitor
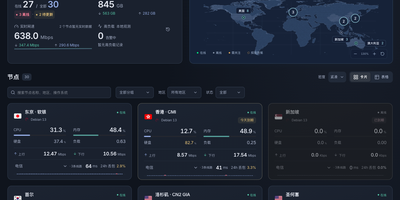
Monitor watches your servers the way a status page should: second by second, from one small binary you run yourself. A lightweight Linux agent on each machine reports CPU, memory, disks, network throughput, connections, and processes to your hub over a persistent connection, and the hub pushes a fresh snapshot to your browser every two seconds. History is kept for charting, so node pages show how load, traffic, and latency behaved over days. Ping tasks run from the hub's side too: define targets once and every agent measures latency to them on its own interval, drawing the curves next to the machine metrics. The public face is a status page you can reskin without touching the server: themes install from the panel, run as static pages against a small public API, and anonymous visitors see only the nodes you marked public, with addresses and hostnames stripped out. Node management stays practical: registration windows hand out tokens safely, installing an agent is one command, and replacing a token disconnects the old connection immediately. When a node goes offline, crosses its traffic allowance, approaches expiry, or someone signs in, alerts go out through Telegram or any webhook. The hub listens only on localhost behind your HTTPS proxy, signs in by password or GitHub OAuth allowlist, and lists revocable sessions. Running on a dedicated VPS on RepoCloud with guaranteed CPU, RAM, and SSD, full root SSH access, and a browser serial console. MIT licensed.
OpenMES
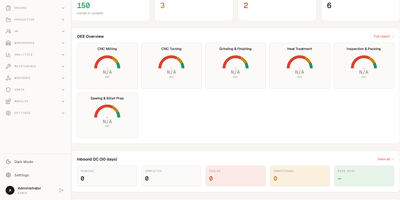
Admins, supervisors, and operators each get their own screens in OpenMES, a free self-hosted manufacturing execution system for small factories. Drag work orders across weekly, daily, hourly, and monthly planner views, and any order that stock cannot cover gets flagged. Automatic scheduling drafts a feasible plan from shift calendars, maintenance, and material shortages, and nothing changes until a supervisor applies it, with undo. Work orders carry partial batches, reusable process templates, and priority scores built from customer tier, planned quantity, and hours until due, and CSV or Excel imports bulk-load orders, materials, and recipes. Operators work from touch-optimized tablet queues, where one tap starts, completes, or reports an issue, even offline, and a critical issue halts production automatically. When a machine stops, MQTT, Modbus TCP, or OPC UA signals record the downtime automatically, and the same signals drive good and reject counters and OEE. At goods-in, an inbound inspection records pass or fail criteria and a disposition such as accept, rework, scrap, or quarantine. Material lots track received and available quantities with hold and release status, and the production cost report splits each finished order into material, labor, and additional costs, with CSV export. Supervisors follow the shift on a live monitor. Webhooks, a REST API, and hook-based modules connect OpenMES to ERP systems and custom code. Running on a dedicated VPS on RepoCloud with guaranteed CPU, RAM, and SSD, full root SSH access, and a browser serial console. AGPL-3.0 licensed.
Wazuh
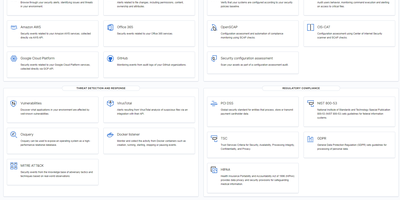
Protecting over 10,000 organizations worldwide with 16,000+ GitHub stars, Wazuh delivers enterprise-grade security operations through a fully open-source platform with zero feature gating. The unified XDR and SIEM solution deploys lightweight agents across Linux, Windows, macOS, Solaris, AIX, and HP-UX endpoints that stream security telemetry to a centralized cluster built on OpenSearch for indexing and the Wazuh Dashboard for visualization and management. Core capabilities include real-time file integrity monitoring with inotify-based detection and who-data attribution, automated vulnerability assessment that correlates software inventories against continuously updated CVE databases, Security Configuration Assessment against CIS benchmarks, rootkit detection, and log data analysis with a rules engine supporting over 3,000 built-in detection rules mapped to MITRE ATT&CK tactics and techniques. Wazuh monitors cloud infrastructure at the API level with native modules for AWS, Azure, and Google Cloud, detects container anomalies through Docker engine integration, and ingests third-party telemetry via syslog and REST APIs from sources like VirusTotal, TheHive, YARA, Suricata, and PagerDuty. Pre-built compliance dashboards and reports cover PCI DSS, HIPAA, NIST 800-53, GDPR, and TSC frameworks. Active response capabilities automatically trigger countermeasures including firewall rule updates, account lockouts, and endpoint isolation when threats are detected. The platform scales horizontally with multi-node clustering for high availability. Running on a dedicated VPS on RepoCloud with guaranteed CPU, RAM, and SSD, full root SSH access, and a browser serial console. GPL-2.0 licensed.
Headlamp
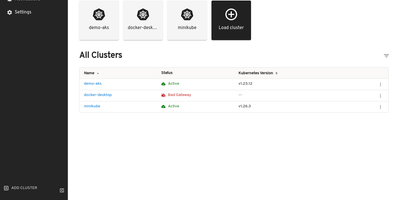
The Kubernetes project's own answer to cluster management UIs: maintained under SIG UI governance, Headlamp's roadmap tracks Kubernetes releases and its design philosophy reflects community needs rather than a vendor's product strategy. The React interface provides full read-write capabilities adapted to each user's RBAC permissions — delete, scale, edit, and restart buttons appear only when the authenticated user holds the corresponding cluster role, preventing accidental unauthorized actions. Multi-cluster support surfaces workloads across development, staging, and production from a single view without context switching. The plugin architecture drives extensibility through a curated catalog: an AI Assistant plugin answers natural-language cluster queries and performs operations via configurable LLM keys, Flux handles GitOps, Karpenter manages nodes. Integrated terminals provide browser-based exec access to running pods, live log streaming follows container output with filtering, and the YAML editor displays inline Kubernetes API documentation alongside resource definitions. Deployment creation forms let you configure containers, environment variables, volumes, and replicas without writing manifests. Side-by-side cluster comparison views surface differences in workload distribution. Works with any distribution: EKS, GKE, AKS, Minikube, Docker Desktop. Helm chart installation via the Headlamp repository with images on GitHub Container Registry. Running on a dedicated VPS on RepoCloud with guaranteed CPU, RAM, and SSD, full root SSH access, and a browser serial console. Apache-2.0 licensed.
CliRelay
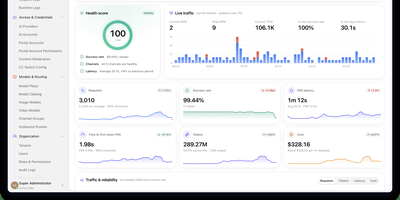
Anyone who pays for Claude Code, Codex, and Gemini CLI separately ends up juggling three endpoints, three sets of keys, and three kinds of rate-limit surprise, and CliRelay collapses all of that into one self-hosted gateway with a control panel. Clients speak the OpenAI Chat or Responses, Anthropic Messages, or Gemini protocol, and CliRelay translates each request for whichever upstream account is healthy. Channel groups limit where each key may send traffic, round-robin, fill-first, and session-sticky scheduling spread it, and cooldowns with automatic failover move requests off accounts that have run out of quota. Add upstreams from the /manage console through browser sign-in, device codes, or bulk credential import, covering Claude, Codex, Gemini, Antigravity, Vertex AI, AWS Bedrock, Grok, Qwen, Kimi, and any OpenAI-compatible service. Portal accounts own client keys with daily, period, and lifetime quotas, RPM and TPM limits, and per-model pricing. A monitor center scores health and charts live traffic, P50 to P99 latency, and time to first token, while every request lands in a searchable log with tokens, latency, and cost. Tenants, roles with resource.action permissions, content moderation profiles, an outbound proxy pool, and an audit trail make shared deployments workable, and the console speaks English, Simplified Chinese, and Russian. Running on a dedicated VPS on RepoCloud with guaranteed CPU, RAM, and SSD, full root SSH access, and a browser serial console. MIT licensed.
Velociraptor
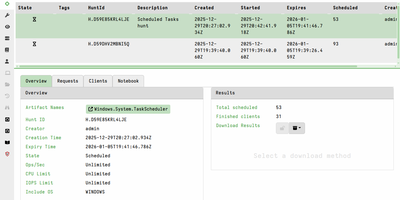
Hunting for a suspicious file, process, or registry key across every endpoint becomes a single hunt in Velociraptor, an endpoint visibility and digital forensics platform. A web console sends tasks to clients on Windows, Linux, and macOS machines, which hold a persistent connection and run each task as soon as it is issued. A hunt runs a VQL artifact, one of more than 400 built in, across selected endpoints, picks up machines that reconnect later, and tracks which hosts have answered. Each hunt and collection opens into a notebook where markdown and live VQL cells group, filter, and timeline the results. A virtual file system browses a client's directories and fetches files through file, NTFS, and registry accessors, with hex and text viewers. Offline collectors bundle chosen artifacts into one binary that writes an optionally encrypted container for later import, suiting machines that never reach the server. Client event queries stream telemetry such as DNS lookups to the server, and server event queries can alert Slack, email, Elastic, or Splunk. Quarantine confines a host's network traffic to the Velociraptor server, and the Shell page runs commands on it. Sign-in works through Google, Azure, GitHub, OIDC, or SAML, with reader, analyst, investigator, and administrator roles. Responders reach for it during threat hunts, compromised host triage with KapeFiles targets, and dead disk image analysis. Running on a dedicated VPS on RepoCloud with guaranteed CPU, RAM, and SSD, full root SSH access, and a browser serial console. AGPL-3.0 licensed.