Radar
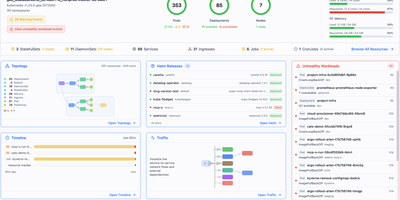
Radar is an open-source Kubernetes management dashboard and Model Context Protocol server that gives engineering teams complete cluster visibility, automated issue diagnosis, and GitOps controls through a unified web interface. Operators explore live interactive cluster topology maps rendered with automated layout engines, grouping workloads by namespace or custom application labels to trace network communication pathways. The unified event timeline retains Kubernetes activity and state change diffs well beyond default one-hour limits, allowing site reliability engineers to diagnose historical CrashLoopBackOff states and investigate failed deployment rollouts. Teams manage Helm releases by inspecting deployed values, comparing manifest revisions side by side, and initiating rollbacks or upgrades with a single click. The built-in GitOps workspace correlates ArgoCD and Flux applications, surfacing synchronization health, field-level configuration drifts, and automated remediation suggestions. Developers inspect container image filesystems directly from pod detail panels without pulling images locally or establishing interactive terminal sessions, browsing permissions and downloading specific files. Native Model Context Protocol endpoints expose cluster telemetry and operational tools to artificial intelligence coding assistants, enabling external agents to diagnose failing pods and inspect access controls securely. Running on a dedicated VPS on RepoCloud with guaranteed CPU, RAM, and SSD, full root SSH access, and a browser serial console. Apache 2.0 licensed.
Kuvasz
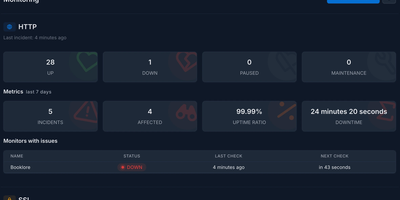
Continuous infrastructure monitoring meets automated SSL expiration tracking in Kuvasz, a self-hosted uptime platform that alerts DevOps teams before outages disrupt production operations. Operators can configure granular health checks across HTTP endpoints, ICMP ping targets, and raw TCP ports with custom polling intervals down to seconds. Automated SSL inspectors track certificate validity, issuing early warning notices before cryptographic chains expire and disrupt production traffic. A push monitoring system receives incoming heartbeat signals from background cron jobs, database backups, and recurring automation scripts, triggering alerts whenever expected pings fail to arrive on schedule. Multi-channel dispatchers route incident notifications through Slack, Discord, Telegram, Microsoft Teams, PagerDuty, and custom webhook payloads with adjustable failure count thresholds to eliminate transient false alarms. Maintenance windows let teams schedule planned downtime through one-off intervals or recurring cron expressions, automatically muting notifications during deployment cycles. Public and private status pages publish categorized system health metrics, historical latency charts, and incident timelines to keep internal stakeholders and end users informed. An integrated Model Context Protocol server allows AI assistants to query monitoring states and toggle checks directly via conversational interfaces. Running on a dedicated VPS on RepoCloud with guaranteed CPU, RAM, and SSD, full root SSH access, and a browser serial console. AGPL-3.0 licensed.