Domain Locker
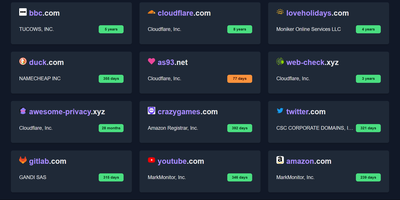
Domain Locker provides an all-in-one domain portfolio dashboard that consolidates expiration tracking, DNS records, and infrastructure health across every registrar you use. Add your domains to automatically harvest registration dates, name servers, SSL validity windows, IP allocations, and subdomains without manual data entry. Customizable notification rules broadcast renewal warnings and configuration change alerts through webhooks, email, Telegram, Slack, or WhatsApp before services experience unintended downtime. Interactive timeline views map renewal deadlines and calculate historical acquisition costs against annual operating expenses to clarify portfolio valuations. Built-in monitoring tools ping endpoints to record response latencies, HTTP status codes, and server availability metrics for every registered address. Audit logs preserve historical snapshots of DNS modifications, WHOIS adjustments, and registrar migrations to simplify infrastructure troubleshooting across teams. Integrated tags and resource associations organize personal blogs, client projects, and staging environments into isolated workspaces with role-based permissions and two-factor authentication. Running on a dedicated VPS on RepoCloud with guaranteed CPU, RAM, and SSD, full root SSH access, and a browser serial console. MIT licensed.
PanWatch
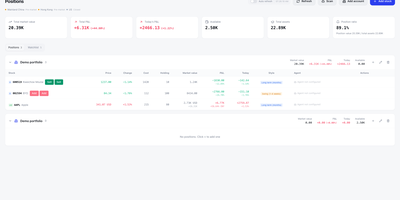
PanWatch's three scheduled AI agents plan the trading day before the bell, watch the session, and review it after the close for your China A-share, Hong Kong, and U.S. holdings. Day one begins with the portfolio: several brokerage accounts, holdings and profit and loss, and search for stocks or listed ETFs by code or name. The pre-market agent folds overnight moves, news, and technical structure into that plan and skips exchange holidays. Through the session, the intraday monitor watches for unusual moves and technical signals. Price alerts combine price, percentage change, turnover, and volume ratio with AND/OR logic, cooldowns, and expiry times. Each rule picks its own channel from Telegram, WeCom, DingTalk, Feishu, Bark, or a webhook. Spot something odd? The brain icon next to a holding starts TradingAgents, where four analyst roles feed a bull and bear debate, a risk review, and a portfolio-manager decision, with the reasoning trail in the app and your notifications. The opportunities screen ranks AI-scored ideas with entry levels and targets, and paper trading simulates signal-based entries and exits and tracks equity and performance. At day's end, the daily report reviews the session and prepares the next trading day's plan. OpenAI-compatible providers or local Ollama models power the analysis, and the PWA installs on a phone in English or Simplified Chinese. Running on a dedicated VPS on RepoCloud with guaranteed CPU, RAM, and SSD, full root SSH access, and a browser serial console. MIT licensed.
Parca
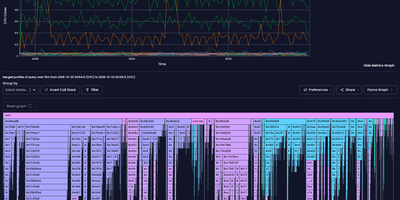
A flight recorder for production code, Parca profiles CPU and memory continuously and keeps the history to query after something breaks. A slow memory leak or a momentary CPU spike is already on record by the time anyone looks. Point it at any service that exposes pprof endpoints, or deploy the eBPF-based Parca Agent to profile every process on a Linux host or Kubernetes node without touching application code. The agent covers C, C++, Rust, Go, and more. In the web UI, pick a profile type such as on-CPU, narrow it with Prometheus-style label selectors, sum or group by any label, and click a point on the time series to open its flame graph. Switch the same query to a table, add extra panels, or try the alpha Flame Chart and Sandwich views. After a deploy, open the Compare page, set two queries side by side by label or time range, and the functions that gained or lost CPU time stand out as a diff. Native binaries are symbolized from uploaded debuginfo or upstream debuginfod servers. Recent releases add support for OpenTelemetry eBPF profiler profiles and GPU profile types. Optional persistence keeps history across restarts, and a Prometheus-style scrape configuration with service discovery decides what gets profiled. Running on a dedicated VPS on RepoCloud with guaranteed CPU, RAM, and SSD, full root SSH access, and a browser serial console. Apache-2.0 licensed.
Limelit Open
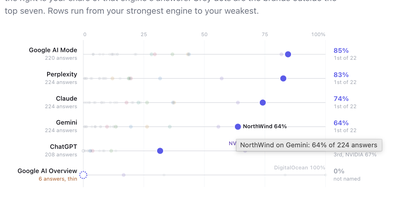
When a buyer asks ChatGPT, Claude, or Perplexity which product to choose, Limelit Open shows whether your brand appears in the answer, where it ranks, and which sources the engines trusted. You define the prompts your market actually asks, register your competitors, and the tracker runs every prompt against seven engines on a schedule you control: ChatGPT, Claude, Perplexity, and Gemini through vendor APIs with web search on, plus Google AI Overviews, Google AI Mode, and Bing Copilot through scraper providers, each result labeled by how it was collected. Every stored answer is searched for your brand and each competitor with the rank of the list item they appear in, so visibility, share of voice, average position, and citation share rest on readable evidence rather than a black-box score. Click any number and you land on the full answer text with matches highlighted, the searches the engine ran, the brands it named, and every cited URL classified as yours, a competitor's, social, informational, or other. A prompt by engine grid makes weak spots obvious, and the built-in MCP server lets Claude or another assistant query the same data in plain language. Runs are capped by a daily ceiling you set, prompts and answers live in one SQLite file, and a single export command dumps the whole instance as JSON or CSVs for your own reporting. Running on a dedicated VPS on RepoCloud with guaranteed CPU, RAM, and SSD, full root SSH access, and a browser serial console. Apache-2.0 licensed.
Peekaping
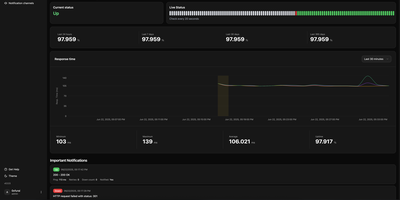
Keep users ahead of outages by consolidating infrastructure monitoring into Peekaping, a unified uptime monitoring and incident communication platform that alerts engineering teams to network and application failures before customers experience disruptions. Users can configure automated synthetic checks across HTTP endpoints, database engines, message queues, and container runtimes to verify response latency, payload integrity, and SSL certificate expiration. When performance thresholds degrade or connections drop, the platform broadcasts structured incident notices across twenty-two notification channels including Slack, Discord, Telegram, PagerDuty, and custom webhooks. Visual dashboards display live heartbeat timelines, historical latency percentiles, and rolling availability scores for each monitored endpoint. System administrators can assemble custom public status pages with custom domains, branded color schemes, and component grouping to inform external stakeholders during planned maintenance or unforeseen service degradations. Teams can schedule recurring maintenance windows to pause alert notifications during routine deployments and generate API tokens to automate monitor creation directly from CI/CD deployment pipelines. Running on a dedicated VPS on RepoCloud with guaranteed CPU, RAM, and SSD, full root SSH access, and a browser serial console. MIT licensed.
Kuvasz
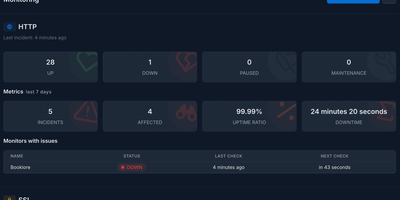
Continuous infrastructure monitoring meets automated SSL expiration tracking in Kuvasz, a self-hosted uptime platform that alerts DevOps teams before outages disrupt production operations. Operators can configure granular health checks across HTTP endpoints, ICMP ping targets, and raw TCP ports with custom polling intervals down to seconds. Automated SSL inspectors track certificate validity, issuing early warning notices before cryptographic chains expire and disrupt production traffic. A push monitoring system receives incoming heartbeat signals from background cron jobs, database backups, and recurring automation scripts, triggering alerts whenever expected pings fail to arrive on schedule. Multi-channel dispatchers route incident notifications through Slack, Discord, Telegram, Microsoft Teams, PagerDuty, and custom webhook payloads with adjustable failure count thresholds to eliminate transient false alarms. Maintenance windows let teams schedule planned downtime through one-off intervals or recurring cron expressions, automatically muting notifications during deployment cycles. Public and private status pages publish categorized system health metrics, historical latency charts, and incident timelines to keep internal stakeholders and end users informed. An integrated Model Context Protocol server allows AI assistants to query monitoring states and toggle checks directly via conversational interfaces. Running on a dedicated VPS on RepoCloud with guaranteed CPU, RAM, and SSD, full root SSH access, and a browser serial console. AGPL-3.0 licensed.
MikroTik Manager
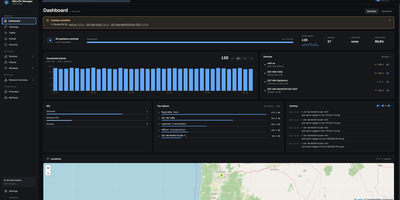
MikroTik Manager is a web control plane for whole RouterOS fleets, built so that a bad VLAN change reverts itself instead of costing you a drive to the site. Before any risky edit, Change Guard saves a restore point on the device and arms a scheduler; if a fresh connection cannot reach the router afterwards, it rolls itself back. Lockout prediction simulates each change against live device state and refuses one that would cut management access, naming the exact port and VLAN at fault. Config Health audits for settings RouterOS accepts but silently ignores. Day to day, a live dashboard tracks availability, wireless clients, and alerts delivered by email, Slack, Discord, Telegram, or ntfy. Switch faceplates, per-port client views, VLAN copy wizards, bulk SSID deployment, RF health charts, rogue AP detection, and a guest Wi-Fi captive portal wizard cover the wired and wireless side. A rule builder handles firewall and NAT, topology maps come from LLDP, CDP, and MNDP, and a built-in NetFlow collector attributes traffic to clients and applications. Firmware rolls out in canary waves that halt on failure, and every configuration snapshot supports diffs and one-click rollback. OIDC single sign-on, TOTP two-factor, role-based access, and scoped API tokens protect the console, while sites group devices per customer network. Running on a dedicated VPS on RepoCloud with guaranteed CPU, RAM, and SSD, full root SSH access, and a browser serial console. AGPL-3.0 licensed.
JellyGlance
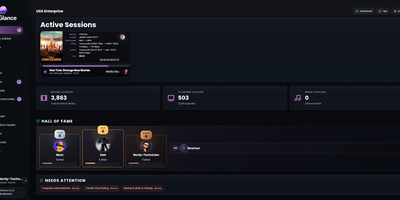
Running a Jellyfin or Emby server usually means a dozen open tabs; JellyGlance folds your whole media server into one screen you can leave open on a wall. Live sessions show who is watching what, from where, on which client, with direct play or transcode state, codec, bitrate, subtitles, and progress for every stream. Playback history accumulates in its own database, so statistics survive even when the media server forgets: top movies, series, libraries, clients, and users, watch-time trends, activity heatmaps, and weekly, monthly, and yearly recaps rendered as shareable cards. The home dashboard arranges by drag and drop, with presets, density controls, themes, kiosk mode for a wall display, and alert rules. Recently added shelves group by library, while library views surface totals and metadata gaps. Jellyseerr and Overseerr requests appear with poster cards, requester context, and admin actions, and the release calendar pulls upcoming titles from your *arr apps beside the queues of your torrent and Usenet clients, stalled items included. Wizarr invites, Tdarr transcodes, and Maintainerr cleanup connect from the same integrations area. Notifications travel by webhook, Discord, Gotify, and email newsletters, backups export to a plain folder, and sign-in spans local accounts, Jellyfin Quick Connect, and OIDC. Running on a dedicated VPS on RepoCloud with guaranteed CPU, RAM, and SSD, full root SSH access, and a browser serial console. MIT licensed.
Cronmaster
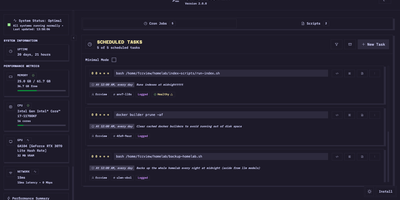
Silent background task failures and scattered crontab files across Linux hosts make routine maintenance risky, which Cronmaster solves with a visual scheduling dashboard and live execution log viewer. Five-field cron expressions translate automatically into plain English alongside one-click schedule presets. Operators can create, comment, clone, pause, or delete scheduled jobs across single or multiple Linux users in seconds. A built-in script manager lets you write, duplicate, and organize reusable Bash scripts from starter templates right inside the browser. Turning on per-job execution logging wraps commands automatically to record standard output, standard error, start and finish timestamps, duration, and exit codes. Log retention policies keep disk usage bounded automatically. Long-running tasks stream their console output live over Server-Sent Events, and any job can be triggered on demand with a single click. Across the top of the workspace, real-time hardware telemetry cards report system uptime, CPU load, memory consumption, network throughput, and GPU utilization. Administrators can protect the interface with local password authentication, OpenID Connect single sign-on with group and role rules, or Bearer API keys for the full REST API. Running on a dedicated VPS on RepoCloud with guaranteed CPU, RAM, and SSD, full root SSH access, and a browser serial console. AGPL-3.0 licensed.
Krawl
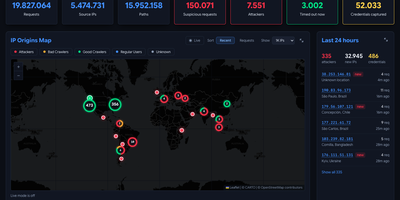
Leave a fake door unlocked and see who walks through: Krawl is a self-hosted honeypot that poses as a sloppy web server and records everything scanners and scrapers try. Fake WordPress, phpMyAdmin, and admin logins. Every attempt logged, every credential captured. A .env file leaking fake database strings, AWS keys, and Stripe secrets. SQL injection, XSS, path traversal, XXE, and command injection traps that answer with believable fake output. SQLMap gets a different database error on every request. Malicious crawlers wander an endless maze of random links. An optional tarpit adds delay and word salad that cost scrapers time, storage, and tokens. Optional AI-generated pages write a plausible decoy for any path an attacker requests. A hidden dashboard shows an attacker map, top IPs, captured credentials, and per-IP forensics. TLSH fuzzy hashing groups webshell variants into campaigns. A behavior score labels each IP attacker, bad crawler, good crawler, or regular user. Export bans as raw lists, iptables, or nftables rules, with guides for Fail2Ban, OPNsense, and RouterOS. A canary-token link in decoy pages emails you the IP and user agent of anyone who follows it. Running on a dedicated VPS on RepoCloud with guaranteed CPU, RAM, and SSD, full root SSH access, and a browser serial console. MIT licensed.
PotatoMesh
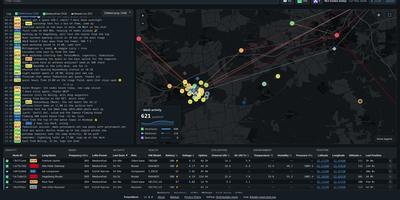
When your community asks what its LoRa mesh is doing right now, PotatoMesh answers with a live map, chat log, and node table built from the traffic your own radios hear. It is a self-hosted dashboard for Meshtastic, Meshcore, and Reticulum networks, with no MQTT clutter. Each node gets a detail page charting battery, voltage, channel utilization, temperature, humidity, and air quality over the past week, plus the neighbors it hears with signal strength and the trace routes it appears in. New nodes and telemetry reports pop up in the chat as they arrive, and a charts page follows telemetry and packets per hour across the whole network. Federation finds other PotatoMesh communities automatically and plots them on a world map with active-node counts per protocol. Ingestors feed the dashboard from radios over serial, TCP, Bluetooth, or passive UDP, and several can report to one instance. Open browsers update live, a Prometheus endpoint exports metrics, and Markdown pages publish your rules, contact details, or legal notice. Add a stop-sign emoji to a node's name to hide it, or switch on private mode to drop the chat entirely. Running on a dedicated VPS on RepoCloud with guaranteed CPU, RAM, and SSD, full root SSH access, and a browser serial console. Apache-2.0 licensed.
AKHQ
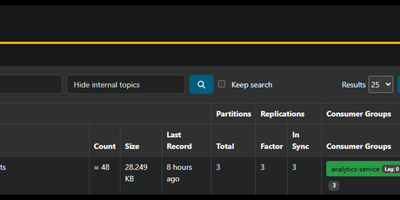
AKHQ puts every Kafka cluster your team runs into one browser console, so topics, messages, consumer lag, schemas, and connectors stop being command-line archaeology. Browse live data inside any topic with search and Live Tail, inspect records by key or partition, and produce test messages without touching a console producer. Consumer group views show lag per partition, and offset resets take a couple of clicks instead of a maintenance window. Multiple clusters sit side by side in the same interface, each with its own Schema Registry, Kafka Connect, and ksqlDB connections attached. Schemas can be created, updated, and versioned from the UI, and Connect clusters report connector and task status you can pause, restart, or reconfigure. Administrators manage ACLs and cluster configuration from the same screens developers use to explore data. Access control goes deep: roles bundle resources and actions, groups scope them with topic patterns and cluster restrictions, and sign-in plugs into OIDC, LDAP, or basic authentication. Point it at your brokers with one configuration file, run it as a single container, and the whole platform team shares one safe window into production Kafka. Running on a dedicated VPS on RepoCloud with guaranteed CPU, RAM, and SSD, full root SSH access, and a browser serial console. Apache-2.0 licensed.
PatchMon
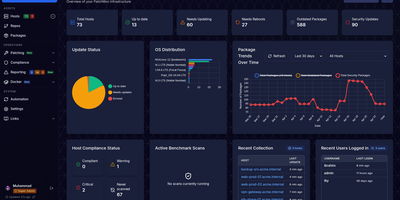
Unpatched Linux servers expose production environments to critical vulnerabilities, and PatchMon eliminates that blind spot by centralizing package telemetry, security advisory tracking, and automated update orchestration across your entire fleet. Administrators can inspect pending updates across APT, DNF, YUM, APK, Pacman, Zypper, FreeBSD pkg, Windows Update, and winget from one unified queue without opening inbound firewall ports on monitored hosts. Before touching production workloads, operators run dry-run validations to preview exact package transactions, enforce multi-user approval workflows, and schedule rollouts during fixed maintenance windows. During execution, live agent output streams directly to the browser over WebSocket so engineers can watch progress in real time or halt a problematic upgrade mid-flight. Beyond package updates, the platform runs OpenSCAP CIS benchmark and Docker Bench security assessments, inventories running containers and outdated base images, and routes host-down or threshold alerts to Slack, Discord, Microsoft Teams, ntfy, or email. Built-in browser SSH and Apache Guacamole RDP terminals let teams troubleshoot machines directly through the outbound agent tunnel with role-based access control and OIDC single sign-on. Running on a dedicated VPS on RepoCloud with guaranteed CPU, RAM, and SSD, full root SSH access, and a browser serial console. AGPL-3.0 licensed.
Radar
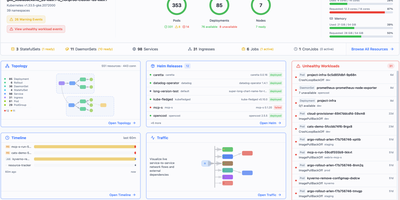
Radar is an open-source Kubernetes management dashboard and Model Context Protocol server that gives engineering teams complete cluster visibility, automated issue diagnosis, and GitOps controls through a unified web interface. Operators explore live interactive cluster topology maps rendered with automated layout engines, grouping workloads by namespace or custom application labels to trace network communication pathways. The unified event timeline retains Kubernetes activity and state change diffs well beyond default one-hour limits, allowing site reliability engineers to diagnose historical CrashLoopBackOff states and investigate failed deployment rollouts. Teams manage Helm releases by inspecting deployed values, comparing manifest revisions side by side, and initiating rollbacks or upgrades with a single click. The built-in GitOps workspace correlates ArgoCD and Flux applications, surfacing synchronization health, field-level configuration drifts, and automated remediation suggestions. Developers inspect container image filesystems directly from pod detail panels without pulling images locally or establishing interactive terminal sessions, browsing permissions and downloading specific files. Native Model Context Protocol endpoints expose cluster telemetry and operational tools to artificial intelligence coding assistants, enabling external agents to diagnose failing pods and inspect access controls securely. Running on a dedicated VPS on RepoCloud with guaranteed CPU, RAM, and SSD, full root SSH access, and a browser serial console. Apache 2.0 licensed.
MySpeed
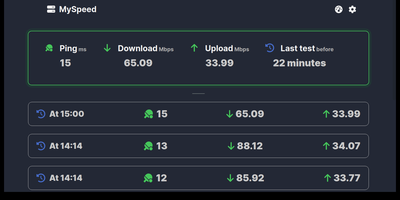
Holding internet service providers accountable for promised bandwidth requires continuous, automated measurement, and MySpeed turns any server into an always-on connection performance analyzer that tracks download speeds, upload throughput, ping latency, and jitter around the clock. Instead of running manual browser tests only when video calls stutter, you can schedule recurring speed checks using custom Cron expressions and switch freely between Ookla, LibreSpeed, and Cloudflare testing servers to verify routing performance across different upstream networks. Interactive statistics views render gradient speed timelines, ping and jitter graphs, hourly performance breakdowns that expose peak-hour congestion, and standard deviation consistency charts, using smart 300-bucket downsampling so multi-month histories load instantaneously. Failed tests are flagged with visual markers on the timeline, while built-in health checks dispatch instant alerts to Discord, Telegram, Signal, WhatsApp, Gotify, email, or custom webhooks whenever bandwidth drops below your target thresholds or outages occur. Administrators can link multiple remote MySpeed instances into a single dashboard to compare bandwidth across branch offices, pause scheduled runs during heavy file transfers, export historical logs, and scrape real-time telemetry into Prometheus and Grafana. Running on a dedicated VPS on RepoCloud with guaranteed CPU, RAM, and SSD, full root SSH access, and a browser serial console. MIT licensed.
Dynacat
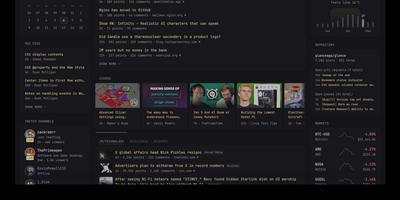
Monitoring dozens of self-hosted containers, RSS feeds, and web services from a single customizable startpage becomes effortless with Dynacat, a dynamic dashboard engine driven by declarative YAML configuration and live data widgets. You can arrange multi-tab layouts in the browser-based visual editor by dragging widgets across columns and picking color themes, and Dynacat automatically writes every adjustment back to your configuration file. Built-in widgets aggregate RSS and Atom feeds, Reddit communities, Hacker News, Lobste.rs, YouTube channel uploads, Twitch streams, weather forecasts, stock and crypto market tickers, and software releases across GitHub, GitLab, Codeberg, and Docker Hub. Homelab operators can inspect and control Docker containers, track server CPU, memory, and disk mountpoints, monitor AdGuard Home or Pi-hole DNS statistics, view Sonarr and Radarr release calendars, and manage torrents across qBittorrent, Deluge, and Transmission from one screen. For custom services, the visual widget builder connects to any JSON endpoint and binds UI blocks to response fields without manual template coding, while the Dynawidgets catalog imports community widgets with a single slug. Every widget refreshes independently on its own schedule and exposes cached data through a local JSON API, with OpenID Connect group rules securing private admin pages. Running on a dedicated VPS on RepoCloud with guaranteed CPU, RAM, and SSD, full root SSH access, and a browser serial console. AGPL-3.0 licensed.
Jellystat
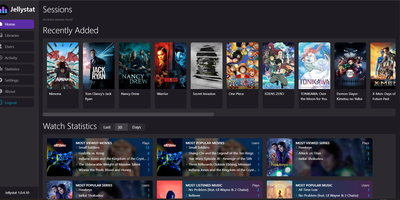
Jellystat is a self-hosted media analytics and live session monitoring dashboard for Jellyfin and Emby servers that turns raw streaming activity into detailed user, library, and playback insights. Media server administrators use the live dashboard to watch active streams in real time, inspecting transcoding status, client devices, bitrates, and playback progress as sessions happen. Every completed or partial stream is logged automatically so you can browse chronological watch histories, filter by library or stream type, and analyze peak concurrent streaming hours across the week. Dedicated library and user views break down total watch duration, play counts, and most popular movies, episodes, or music albums per account. If you already use the official Jellyfin Playback Reporting or Statistics plugins, you can import existing historical records directly into your instance without losing past data. Built-in database backup and restore tools, automatic library synchronization tasks, IP geolocation via MaxMind GeoLite, and interactive Swagger API documentation at the /swagger endpoint round out the administrative toolkit. Running on a dedicated VPS on RepoCloud with guaranteed CPU, RAM, and SSD, full root SSH access, and a browser serial console. MIT licensed.
What's Up Docker
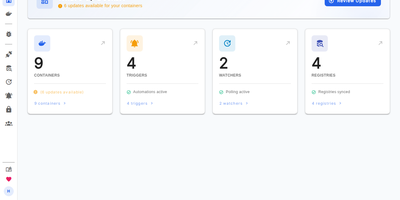
Does your container fleet silently fall behind on upstream patches until a critical vulnerability advisory forces an emergency audit? What's Up Docker continuously watches standalone Docker daemons, Compose stacks, Swarm services, Kubernetes workloads, and Nomad jobs to detect new image tags across public and private registries before sending alerts or rolling out updates automatically. Watchers connect over local sockets, TLS-secured TCP endpoints, kubeconfigs, or Nomad APIs to inventory active workloads without invasive sidecars. From there, registry connectors authenticate against Docker Hub, GitHub Container Registry, AWS ECR, Google Artifact Registry, Azure Container Registry, Quay, GitLab, Gitea, Forgejo, and self-hosted OCI registries to compare digests and tags. Flexible filtering rules let you restrict alerts to major, minor, or patch semantic version increments, match custom regular expressions, or pin specific tag patterns per container label. Once an eligible release appears, over thirty built-in triggers can dispatch notifications to Discord, Slack, Telegram, Matrix, Mattermost, Gotify, Ntfy, Pushover, Apprise, PagerDuty, or SMTP, publish events to MQTT, Kafka, RabbitMQ, or NATS, or recreate containers directly on demand. A responsive web dashboard and REST API provide manual update controls, OpenID Connect single sign-on with role-based access control, and Prometheus metrics for Grafana observability. Running on a dedicated VPS on RepoCloud with guaranteed CPU, RAM, and SSD, full root SSH access, and a browser serial console. MIT licensed.