Zabbix
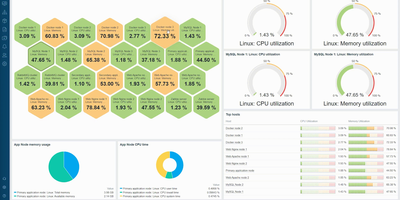
Monitoring everything from network switches to Kubernetes clusters since 2001 with over 6,200 GitHub stars and deployments exceeding 100,000 devices per installation, Zabbix has established itself as one of the most mature and feature-rich open-source monitoring platforms available, trusted by organizations including Dell, Salesforce, ICANN, and T-Mobile. The platform collects metrics from virtually any source using Zabbix Agent written in C, Zabbix Agent 2 written in Go with native plugin support, SNMP v1/v2c/v3 polling and trapping, IPMI for hardware health, JMX for Java applications, SSH and Telnet checks, HTTP/HTTPS polling, and ODBC database queries. Version 7.0 LTS introduced synthetic browser monitoring that executes user-defined JavaScript via WebDriver to simulate multi-step user interactions on websites, proxy load balancing with automatic host redistribution across proxy groups for high availability, in-memory proxy data buffering delivering up to 100x performance improvement, native multi-factor authentication with TOTP and Duo support, and just-in-time user provisioning from SAML and LDAP. Low-level discovery automatically detects file systems, network interfaces, SNMP OIDs, VMware resources, and Kubernetes pods, creating monitoring items and triggers dynamically. The alerting engine correlates events with configurable escalation chains, sending notifications through Slack, Microsoft Teams, PagerDuty, Jira, email, and SMS with customizable message templates. Over 1,000 official templates provide instant monitoring for Linux, Windows, VMware, AWS, Azure, Docker, PostgreSQL, MySQL, Apache, Nginx, and hundreds more. Running on a dedicated VPS on RepoCloud with guaranteed CPU, RAM, and SSD, full root SSH access, and a browser serial console. AGPL-3.0 licensed.
Healthchecks
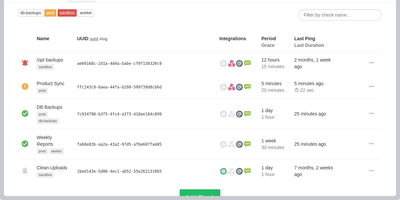
With 10,100+ GitHub stars and 75 releases over a decade of continuous development, Healthchecks is the open-source cron job monitoring service that catches failures your other monitoring tools miss — the jobs that silently stop running, the backups that never completed, the nightly reports that disappeared without error. The dead man's switch architecture requires zero agent installation: your cron jobs, scripts, and services ping a unique URL via HTTP request or email, and Healthchecks alerts you only when a ping does not arrive within the configured Period and Grace Time window. Each check supports cron expression scheduling, optional start, success, and failure signals for measuring execution time, and HTTP body keyword filtering for intelligent alert routing. Twenty-five notification integrations cover every channel teams actually use: Slack, Discord, Microsoft Teams, PagerDuty, Opsgenie, Splunk On-Call, Telegram, Signal, WhatsApp, SMS, email, webhooks, GitHub Issues, Pushover, ntfy, Gotify, Matrix, Mattermost, Zulip, Pushbullet, PagerTree, Spike.sh, and Trello. The web dashboard provides a visual grid showing real-time status with color-coded badges and per-check integration toggles. Monthly, weekly, and daily email reports summarize uptime trends with checks sorted by downtime duration. Team management supports projects with member roles and read-only access. Prometheus metrics expose check health and grace state for Grafana dashboards. WebAuthn and TOTP two-factor authentication secure accounts. Deploy via Docker images available for amd64, arm/v7, and arm64 architectures. Running on a dedicated VPS on RepoCloud with guaranteed CPU, RAM, and SSD, full root SSH access, and a browser serial console. BSD 3-Clause licensed.
xyOps
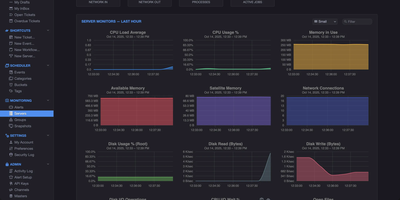
With 4,500+ GitHub stars and version 1.0.92 released August 2026, xyOps delivers a complete operations platform that unifies workflow automation, job scheduling, server monitoring, alerting, and incident response in one self-hosted system. The platform uses a distributed architecture where a central conductor coordinates lightweight xySat satellite agents running on Linux, macOS, or Windows worker nodes via persistent WebSocket connections. The visual workflow builder lets you chain events, triggers, actions, and monitors into multi-step pipelines with conditional logic, fan-out/fan-in parallelism, multiplex controllers for fleet-wide execution, and configurable resource limits. QuickMon provides per-second CPU, memory, disk, and network visibility streamed live to the web UI, while user-defined monitor plugins sample metrics every minute with time-series storage at hourly, daily, monthly, and yearly resolutions. Alert triggers evaluate expressions against live data and fire notifications via email, webhook, or custom actions, with full server snapshots attached showing every running process, network connection, and resource utilization at the moment of detection. Failed jobs and alerts automatically create tickets with linked logs, metrics history, and context for end-to-end incident tracking. The plugin marketplace supports extensions written in any language, and the Docker plugin enables container-based job execution. Deploy via Docker with persistent volumes on port 5522 for the web UI and 5523 for API access, running on a dedicated VPS on RepoCloud with guaranteed CPU, RAM, and SSD, full root SSH access, and a browser serial console. BSD-3-Clause licensed.
OneUptime
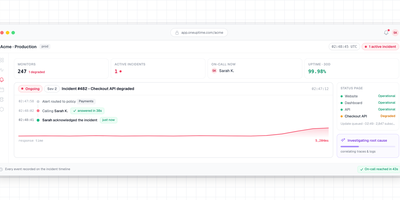
With 7,400+ GitHub stars and a feature set that replaces seven separate SaaS subscriptions — Pingdom for monitoring, StatusPage.io for status pages, PagerDuty for on-call, Incident.io for incident management, Datadog for APM, Loggly for logs, and Sentry for error tracking — OneUptime delivers every tool your reliability team needs in a single open-source platform that is genuinely 100% open source under Apache 2.0 (not open-core). Uptime monitoring runs synthetic checks against websites, APIs, ports, SSL certificates, and DNS records from distributed global probes with configurable intervals and thresholds. Branded status pages publish automatically when monitors detect issues, notifying subscribers via email, SMS, webhook, or RSS without manual intervention during an outage. On-call scheduling routes alerts through escalation policies to the right engineer via phone call, SMS, push notification, Slack, or Microsoft Teams. The incident management workflow handles declaration, triage, communication, resolution, and post-mortem generation in a unified timeline. APM collects traces and metrics via native OpenTelemetry integration — no proprietary agents required — while log management provides full-text search and alerting. An AI agent continuously monitors telemetry data, identifies root causes, and opens GitHub pull requests with proposed fixes for review. Deploy via Docker Compose or Kubernetes Helm charts with a Terraform provider for infrastructure-as-code configuration. Running on a dedicated VPS on RepoCloud with guaranteed CPU, RAM, and SSD, full root SSH access, and a browser serial console. Apache-2.0 licensed.
Keep
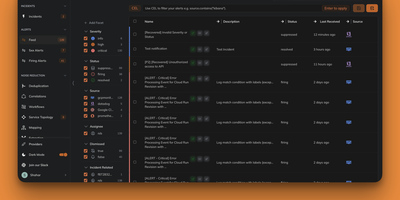
Keep is an open-source AIOps and alert management platform built with Python FastAPI and Next.js. It provides a single pane of glass for monitoring alerts from 110+ integrations, alert deduplication, correlation, enrichment, and filtering, YAML-based workflow automation similar to GitHub Actions, AI-powered correlation and summarization, and customizable dashboards for incident management. With 12,100+ GitHub stars, Y Combinator backing, and an Elastic partnership, Keep is the open-source AIOps platform that centralizes alert management across your entire monitoring stack into a single customizable dashboard. Alert deduplication identifies duplicate notifications across providers, correlation groups related alerts into incidents based on rules or AI-powered semantic analysis using pluggable LLM backends supporting OpenAI, Anthropic, and local models via Ollama, and enrichment adds context from external sources like CMDBs and databases. Workflow automation follows a GitHub Actions paradigm with declarative YAML files defining triggers, conditions, and actions that can query MySQL, update Jira tickets, send Slack messages, execute Python scripts, or call REST APIs. Authentication supports no-auth, database, Auth0, Keycloak, OAuth2 Proxy, Okta, and OneLogin. The Common Expression Language enables advanced alert querying, slicing, and rule-based grouping to reduce noise. On RepoCloud, deploy Keep on a dedicated VPS with Docker Compose, root SSH access, and complete control over your alert infrastructure, all under the MIT license.
Apache HertzBeat
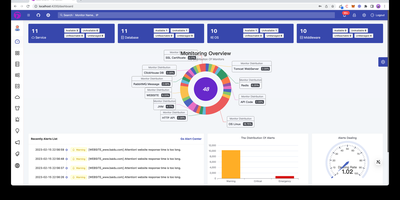
Instead of deploying proprietary background agents across dozens of target nodes, engineers rely on Apache HertzBeat to monitor real-time infrastructure health, metrics gathering, threshold alerting, and public status pages from a central operations platform. Operations teams can poll hundreds of target services without deploying proprietary background daemons, gathering performance data across Linux hosts, Kubernetes clusters, SQL databases, and network switches using native connection protocols. Engineers can define custom monitoring targets directly within the web dashboard by composing declarative YAML templates that specify polling intervals, parsing expressions, and metric extraction rules. The centralized alert engine processes inbound threshold events, suppresses cascading alert storms during maintenance windows, and dispatches actionable incident notifications to Discord channels, Slack rooms, Telegram groups, and webhook endpoints. Telemetry streams flow into interactive charts with customizable refresh cadences, enabling site reliability engineers to inspect latency waterfalls, correlate log spikes against CPU exhaustion, and track disk capacity trends over extended timeframes. Administrators can also publish real-time public status pages that inform external stakeholders about service availability, scheduled downtime, and ongoing incident resolutions. Running on a dedicated VPS on RepoCloud with guaranteed CPU, RAM, and SSD, full root SSH access, and a browser serial console. Apache 2.0 licensed.

RocketplaneIO
RocketplaneIO is a self-hosted AI SRE platform that gives Kubernetes clusters zero-instrumentation eBPF observability plus a copilot capable of safely diagnosing and fixing issues without your telemetry ever leaving your infrastructure. Point it at any cluster, and an eBPF DaemonSet starts capturing HTTP, gRPC, SQL, Redis, and Kafka spans across every service, including compiled binaries, with cross-service context propagation and no code changes required. The live service map draws itself from actual network traffic, matching technology logos from container images and coloring each node's health from RED metrics. Every log line sits two clicks from its parent distributed trace, and a PromQL query engine, embedded from the real Prometheus evaluator, runs over ClickHouse for long-term metric retention. The complete Kubernetes inventory (Services, Ingress, ConfigMaps, network policies, persistent volumes, CRDs) syncs continuously and is searchable alongside traces and logs. When the copilot identifies a problem, it picks from a catalog of roughly 30 risk-classified safe actions; each action verifies its preconditions, captures a before-state snapshot, executes, checks the result, and rolls back automatically on failure. Disruptive operations pause for explicit human approval before proceeding. An MCP endpoint exposes the identical guardrailed toolbox to external AI agents, so Claude Code or Cursor can operate the cluster through the same safety boundary the browser copilot uses. Complex remediations compose as searchable, forkable Starlark workflows that compile deterministically at save. Running on a dedicated VPS on RepoCloud with guaranteed CPU, RAM, and SSD, full root SSH access, and a browser serial console. Apache-2.0 licensed.
Grafana OnCall
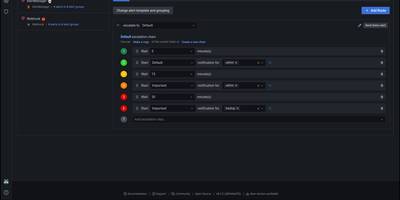
With 3,900 GitHub stars, 140 contributors, and 380 releases since its 2022 launch, Grafana OnCall delivers developer-friendly incident response that routes alerts from any monitoring system to the right engineer at the right time through the right channel. The platform accepts alerts via unique API URLs from Alertmanager, Grafana Alerting, Zabbix, Datadog, Pagerduty-compatible sources, Jira, inbound email, and generic HTTP webhooks, then applies routing templates to direct each alert to the appropriate escalation chain. Escalation chains define notification sequences — notify the primary on-call via Slack, wait 5 minutes, escalate to SMS and phone, wait 10 minutes, page the secondary on-call and notify the engineering manager — continuing until acknowledgment or resolution. On-call schedules support multi-layer rotations with overrides, shift swaps, and timezone-aware handoffs rendered directly inside Grafana dashboards. ChatOps integration publishes alert groups to Slack channels and Telegram groups with interactive buttons for acknowledge, resolve, and silence actions. Template engines based on Jinja2 control alert grouping, appearance rendering, and behavioral automation. The REST API enables programmatic management of integrations, schedules, and escalation policies. Deploy via Docker Compose with PostgreSQL, Redis, and Celery workers alongside your existing Grafana instance. Running on a dedicated VPS on RepoCloud with guaranteed CPU, RAM, and SSD, full root SSH access, and a browser serial console. GNU AGPL v3 licensed.
GoCron
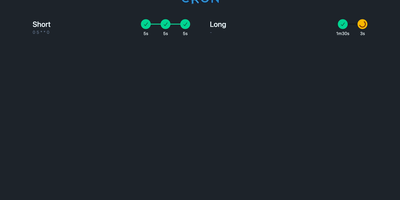
Configuring recurring cron jobs via version-controlled YAML manifests becomes seamless with GoCron, giving systems engineers and DevOps administrators a responsive web console to orchestrate scheduled commands with hot-reloading and sandboxed execution. Administrators can declare schedules using standard five-field cron syntax, establish global default configurations, and inherit execution timeouts, retry policies, and environment variable expansions across individual tasks. The interactive web interface provides immediate visibility into upcoming runs, past execution durations, status badges, and expandable terminal output logs stored in local SQLite databases. Operators can trigger ad-hoc job runs on demand, cancel stalled processes, and utilize a built-in sandboxed terminal utility governed by strict command whitelists. Automated health check webhooks dispatch HTTP notifications to external monitoring services upon job initiation, successful completion, or unexpected execution failure. The container environment bundles common server utilities including Restic, BorgBackup, and Rclone, streamlining automated offsite database backups and cloud storage synchronization routines without additional dependencies. Dynamic configuration reloading automatically detects filesystem modifications to YAML manifests without restarting the daemon, ensuring zero-downtime schedule updates. Running on a dedicated VPS on RepoCloud with guaranteed CPU, RAM, and SSD, full root SSH access, and a browser serial console. MIT licensed.