Checkmate
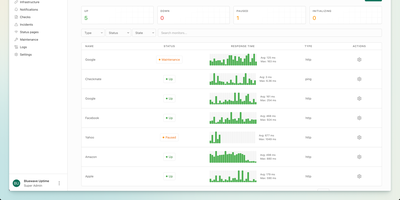
With 10,400 GitHub stars, 153 contributors, and no per-monitor pricing to worry about, Checkmate delivers comprehensive infrastructure monitoring from a single self-hosted dashboard — tracking uptime, page speed, server hardware, Docker containers, and even game servers without sending a byte of telemetry off your network. Ten monitor types cover HTTP, ping, TCP, gRPC, WebSocket, DNS, SSL certificate expiry, Docker container health, Lighthouse page speed with Core Web Vitals tracking, and game server status for over 100 server types including Minecraft and CS2. The Globalping integration enables geo-distributed monitoring from six continents, running ping and HTTP checks from Africa, Asia, Europe, North America, South America, and Oceania with results plotted on an interactive map. The optional Capture agent written in Go collects CPU, RAM, disk usage, temperature, and network metrics from any Linux, Windows, Mac, or Raspberry Pi host. Public status pages ship with four built-in themes and custom branding support, showing per-service uptime bars and incident history on a single shareable URL. Alert notifications reach teams through email, Discord, Slack, PagerDuty, Microsoft Teams, Telegram, Matrix, ntfy, Twilio SMS, and webhooks. Deploy via a single Docker Compose file requiring roughly 1 GB RAM — up and running in under five minutes on any Docker host. Running on a dedicated VPS on RepoCloud with guaranteed CPU, RAM, and SSD, full root SSH access, and a browser serial console. AGPLv3 licensed.
Checkcle
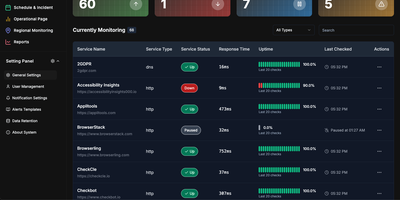
CheckCle provides a complete uptime monitoring and infrastructure observability platform that deploys with a single Docker container and stores all data in embedded SQLite via PocketBase. The Go backend runs three microservices — a service operation engine handling HTTP, HTTPS, DNS, Ping, and TCP checks at configurable intervals, a distributed regional check agent for multi-location network testing, and a server monitoring agent collecting CPU, RAM, disk usage, and network metrics via gRPC. The React frontend built with Vite, TypeScript, Tailwind CSS, and shadcn-ui subscribes to PocketBase WebSocket endpoints for real-time dashboard updates without polling. SSL and domain monitoring tracks certificate issuers, expiration dates, days remaining, and validation status. The incident management system records UP, DOWN, WARNING, and PAUSE states with full history, while scheduled maintenance windows prevent false alerts during planned downtime. Public status pages provide external stakeholders with live service health information. Health heatmaps visualize uptime performance and outage patterns over time. Notification channels include email, Telegram, Discord, and Slack, with multiple alert targets per monitored service. The one-click agent installation script supports Debian, Ubuntu, CentOS, Red Hat, Alpine, and Windows in beta. Docker deployment runs on port 8090 with a single persistent volume at /mnt/pb_data, requiring minimum 1 vCPU and 500MB RAM. On RepoCloud, deploy CheckCle on a dedicated VPS with root SSH access, persistent storage for your monitoring database, and complete control over agent endpoints and notification configurations, all under the MIT license.
UptimeKuma
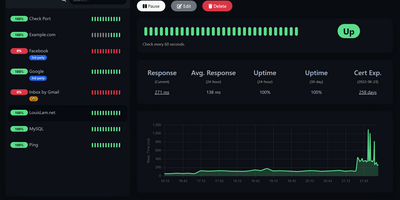
Sixty-thousand-plus GitHub stars make Uptime Kuma the most popular self-hosted monitoring tool - MIT-licensed, Node.js, and the standard replacement for UptimeRobot, Pingdom, and Freshping. It watches a dozen monitor types: HTTP(S) endpoints with keyword and JSON-query content validation, TCP ports, ICMP ping, DNS records, WebSockets, Docker containers via the socket, Steam game servers, MQTT brokers, gRPC services, and push-based heartbeats for cron jobs and internal workers. Checks run at intervals as tight as 20 seconds - versus UptimeRobot's 5-minute free tier - with unlimited monitors and unlimited data retention. When something fails, alerts fan out through 90+ notification channels: Slack, Discord, Telegram, email with LiquidJS templating, PagerDuty, OpsGenie, ntfy, Gotify, Matrix, and dozens more via native providers plus the Apprise library. Unlimited public or password-protected status pages - mappable to specific domains and organized into monitor groups - communicate health to customers, with maintenance windows that suppress alerts during planned work. The reactive dashboard graphs response times, tracks SSL certificate expiry with advance warnings, supports proxies and 2FA, and ships in dozens of languages. One Docker container with a SQLite volume covers an entire infrastructure.
Gatus
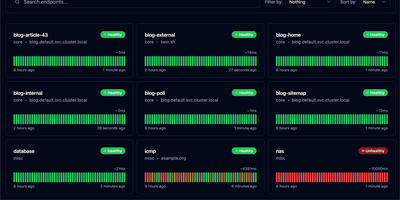
With 11,400+ GitHub stars and active development since 2019, Gatus is the developer-oriented status page and health monitoring tool that ships as a single statically-linked Go binary in a scratch Docker image under 20 MB — deploying in seconds while monitoring your entire infrastructure across 12 protocols from a single YAML configuration file. Define health checks for HTTP, ICMP, TCP, DNS, gRPC, WebSocket, SSH, UDP, SCTP, STARTTLS, and TLS endpoints with conditions that go far beyond simple ping: evaluate response status codes, body content with JSONPath expressions, response time thresholds, certificate expiration days, DNS record values, and IP address ranges. Each endpoint supports independent alerting through Slack, Microsoft Teams, PagerDuty, Discord, Telegram, Twilio, Mattermost, Google Chat, email, Gotify, Pushover, and custom webhook providers with configurable failure thresholds and descriptions. The built-in status page displays uptime badges, response time graphs, and incident timelines with maintenance window support for planned downtime communication. External endpoints accept push-based health reports from services behind firewalls. Prometheus metrics export via the /metrics endpoint enables integration with existing observability stacks. OIDC and Basic Authentication protect the dashboard. PostgreSQL persistence stores historical uptime data. The official Helm chart supports Kubernetes deployment with liveness probes and PVC storage, while a community sidecar auto-generates endpoint configurations from Kubernetes Ingress and HTTPRoute resources. Running on a dedicated VPS on RepoCloud with guaranteed CPU, RAM, and SSD, full root SSH access, and a browser serial console. Apache 2.0 licensed.
Statping-ng
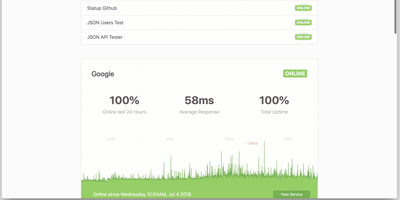
A status page and uptime monitor in one Go binary: Statping-ng - the actively maintained fork of Statping - replaces the UptimeRobot-plus-Statuspage combo with a ~20 MB Docker image using under 50 MB of RAM. It checks services over HTTP, TCP, UDP, ICMP ping, and gRPC health checks on configurable intervals, with per-service timeouts, expected status codes, POST requests with custom JSON bodies, SSL verification, and failure thresholds before alerting. The public status page is the differentiator against plain monitors: visitors see live status, uptime percentages, and latency charts grouped into service categories, with incident announcements and scheduled-maintenance messages you publish from the dashboard - and Sass-based custom styling matches the page to your brand rather than a vendor template. When something fails, notifiers fire immediately: Slack, Discord, Telegram, SMTP email, PagerDuty, Twilio SMS, Pushover, and custom webhooks, each testable before saving. Because notifiers are single Go files, the plugin system makes new channels straightforward. A RESTful API manages services and reads uptime data programmatically, and the free Statping mobile app connects to your server via QR code for on-the-go monitoring. Data persists to SQLite, MySQL, or PostgreSQL. Point it at internal services too - anything the container can reach is monitorable.
Tianji
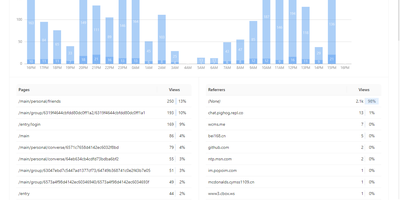
Website analytics, uptime monitoring, and server status - three tools most teams run separately - combined in Tianji, an open-source observability platform. The analytics layer tracks page views, unique visitors, referrers, and UTM parameters with a lightweight cookie-less script, which keeps collection GDPR and CCPA friendly. The uptime monitor checks availability and latency on configurable intervals, accepts passively reported results, and publishes public status pages for incident communication. Server status agents report CPU, memory, disk, and network metrics with threshold-based alerts, and notifications route through webhooks, Slack, Telegram, and other channels with noise control. It also includes anonymous telemetry for tracking deployments of your own open-source projects, surveys, waitlists, team collaboration, and an OpenAPI interface for integrations and exports. The consolidation is the point: traffic analytics, uptime checks, and server metrics share one interface and one alerting layer, so diagnosing an incident does not mean hopping between Google Analytics, Uptime Kuma, and Prometheus - and the built-in public status pages replace a separate paid Statuspage-style subscription. Because collection uses no cookies with IP truncation and aggregation by default, basic traffic measurement requires no consent banner. Built in TypeScript under the Apache 2.0 license and inspired by Umami and Uptime Kuma, it is deliberately right-sized for independent developers and small SaaS teams whose monitoring needs are real but lightweight.
Kuvasz
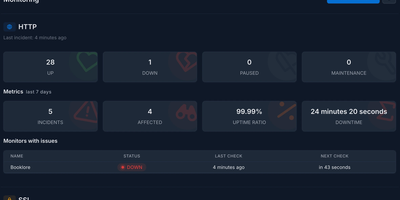
Continuous infrastructure monitoring meets automated SSL expiration tracking in Kuvasz, a self-hosted uptime platform that alerts DevOps teams before outages disrupt production operations. Operators can configure granular health checks across HTTP endpoints, ICMP ping targets, and raw TCP ports with custom polling intervals down to seconds. Automated SSL inspectors track certificate validity, issuing early warning notices before cryptographic chains expire and disrupt production traffic. A push monitoring system receives incoming heartbeat signals from background cron jobs, database backups, and recurring automation scripts, triggering alerts whenever expected pings fail to arrive on schedule. Multi-channel dispatchers route incident notifications through Slack, Discord, Telegram, Microsoft Teams, PagerDuty, and custom webhook payloads with adjustable failure count thresholds to eliminate transient false alarms. Maintenance windows let teams schedule planned downtime through one-off intervals or recurring cron expressions, automatically muting notifications during deployment cycles. Public and private status pages publish categorized system health metrics, historical latency charts, and incident timelines to keep internal stakeholders and end users informed. An integrated Model Context Protocol server allows AI assistants to query monitoring states and toggle checks directly via conversational interfaces. Running on a dedicated VPS on RepoCloud with guaranteed CPU, RAM, and SSD, full root SSH access, and a browser serial console. AGPL-3.0 licensed.
ServerBee
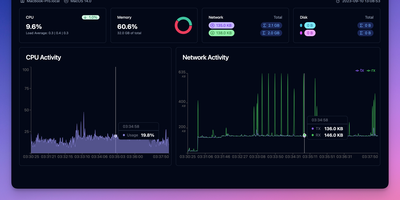
ServerBee delivers complete fleet monitoring from a single Rust binary that embeds both the server and web UI, requiring no external database or heavy runtime. Lightweight agents installed on each node stream CPU, memory, disk, network, load, temperature, GPU, and disk I/O metrics over persistent WebSocket connections to a central server backed by embedded SQLite. The real-time React dashboard presents 17 drag-and-drop widget types across custom layouts, with historical charts spanning one hour to 30 days and monthly traffic statistics with billing-cycle prediction and cost insights including burn rate and per-resource unit cost scoring. Network monitoring covers ICMP, TCP, and HTTP ping probes, service monitors for SSL certificates, DNS records, HTTP keyword matching, TCP ports, and WHOIS expiration, plus network-quality probing across 96 China 3-ISP and international presets with IP-quality and streaming-unlock detection. Remote management features include a web terminal with sandboxed file manager, Docker container stats with logs and events, firewall configuration, and agent auto-update capabilities. Public status pages display 90-day uptime timelines, while alerting supports email and webhook notifications with flexible trigger expressions. A native iOS companion app provides mobile monitoring access. Deploy via Docker or download the single binary for Linux, macOS, or Windows, running on a dedicated VPS on RepoCloud with guaranteed CPU, RAM, and SSD, full root SSH access, and a browser serial console. AGPL-3.0 licensed.