Highlight
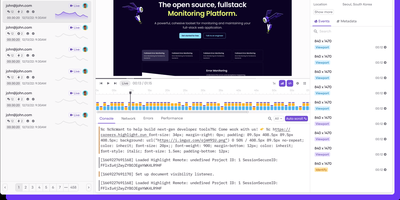
With over 9,000 GitHub stars and a focus on developer experience over legacy monitoring complexity, Highlight.io delivers a unified observability platform that correlates frontend user behavior with backend performance data in a single interface. The session replay engine captures high-fidelity DOM recordings showing exactly what users experienced, including console logs, network requests, page transitions, and user interactions, with configurable privacy redaction for sensitive content. Error monitoring automatically groups and deduplicates errors, surfaces affected user sessions, and provides full stack traces with source map support for minified production code. The logging pipeline ingests structured and unstructured logs from any backend service with automatic property extraction, full-text search, and configurable alerting thresholds. Distributed tracing tracks request flows across microservices with embedded links to associated sessions, errors, and logs for complete request lifecycle visibility. The metrics system collects custom application metrics alongside built-in web vitals and performance data for trend analysis and anomaly detection. Search across all telemetry types uses a unified query language with automatic attribute discovery and saved views for recurring investigations. Integrations connect with Slack, Discord, Linear, Jira, Vercel, and dozens of other developer tools for notification routing and workflow automation. SDKs cover React, Next.js, Vue, Angular, Python, Go, Ruby, Java, PHP, and Elixir with framework-specific instrumentation. Self-hosted deployment runs via Docker Compose with ClickHouse for analytics storage. Running on a dedicated VPS on RepoCloud with guaranteed CPU, RAM, and SSD, full root SSH access, and a browser serial console. Apache 2.0 licensed.
LogTide
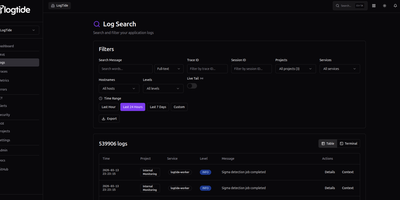
Every production incident starts the same way: someone asks "what do the logs say?" and the answer takes 45 minutes to find. LogTide collapses that search into seconds with a unified observability platform that indexes logs, traces, and metrics into a single queryable interface, backed by your choice of TimescaleDB, ClickHouse, or MongoDB. The log search interface supports full-text queries across millions of entries with filters for trace ID, session ID, project, service, hostname, and severity level, plus a live tail mode that streams new log lines as they arrive. Distributed traces render as waterfall timelines showing every span, its duration, and cross-service dependencies, while correlated logs for each trace are one click away. The metrics explorer visualizes OTLP gauge and counter data from your applications with system CPU, memory, disk, and network panels that update in near real-time. Where LogTide diverges from standard observability is its built-in SIEM engine: Sigma-compatible detection rules scan incoming logs for security threats like SQL injection, privilege escalation, lateral movement, and C2 communication, surfacing findings on a dedicated security dashboard with severity distribution, detection timelines, and affected service breakdowns. Alerting pushes notifications to Email, Slack, or Discord webhooks when thresholds trip or security rules fire. Native SDKs for Node.js, Python, Go, PHP, Kotlin, and Ruby ship logs with retry logic and circuit breakers, and the platform accepts OpenTelemetry data natively. Running on a dedicated VPS on RepoCloud with guaranteed CPU, RAM, and SSD, full root SSH access, and a browser serial console. AGPL-3.0 licensed.
Grafana OnCall
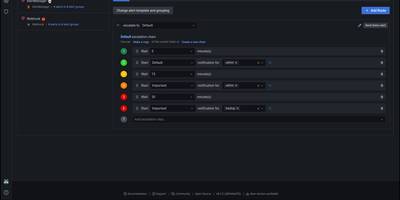
With 3,900 GitHub stars, 140 contributors, and 380 releases since its 2022 launch, Grafana OnCall delivers developer-friendly incident response that routes alerts from any monitoring system to the right engineer at the right time through the right channel. The platform accepts alerts via unique API URLs from Alertmanager, Grafana Alerting, Zabbix, Datadog, Pagerduty-compatible sources, Jira, inbound email, and generic HTTP webhooks, then applies routing templates to direct each alert to the appropriate escalation chain. Escalation chains define notification sequences — notify the primary on-call via Slack, wait 5 minutes, escalate to SMS and phone, wait 10 minutes, page the secondary on-call and notify the engineering manager — continuing until acknowledgment or resolution. On-call schedules support multi-layer rotations with overrides, shift swaps, and timezone-aware handoffs rendered directly inside Grafana dashboards. ChatOps integration publishes alert groups to Slack channels and Telegram groups with interactive buttons for acknowledge, resolve, and silence actions. Template engines based on Jinja2 control alert grouping, appearance rendering, and behavioral automation. The REST API enables programmatic management of integrations, schedules, and escalation policies. Deploy via Docker Compose with PostgreSQL, Redis, and Celery workers alongside your existing Grafana instance. Running on a dedicated VPS on RepoCloud with guaranteed CPU, RAM, and SSD, full root SSH access, and a browser serial console. GNU AGPL v3 licensed.
GlitchTip
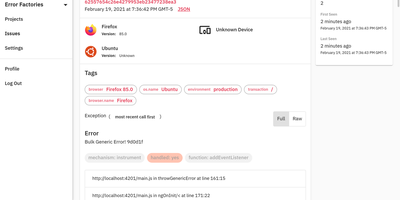
GlitchTip speaks Sentry's protocol without Sentry's operational weight - open-source error tracking that your existing SDKs already understand. The pitch is pragmatic: instrument your application with the official Sentry SDKs you already know - any language they cover - and point the DSN at your own GlitchTip instance instead. Errors, exceptions, log messages, and Content Security Policy violations flow into one place for triage, grouped into issues with stack traces, with alerts delivered by email or webhook the moment things break. Where self-hosted Sentry has ballooned into a docker-compose stack of twenty-plus containers, GlitchTip is a deliberately lean Django and PostgreSQL application a small team can actually run. Beyond errors, it bundles three more monitoring concerns: performance monitoring takes a works-out-of-the-box approach - no dashboard building, just your slowest web requests, database queries, and transactions surfaced automatically; uptime monitoring pings your sites and alerts on failures, or runs in reverse as a dead-man's-switch heartbeat for cron jobs that must check in on schedule; and log search puts application logs alongside errors for faster debugging. Unlimited projects and team members, MIT-licensed, built by Burke Software - your event volume is limited only by your own hardware.